163
5
Chapter
Education and Labor Market
Outcomes in Urban West Africa
Mathias Kuépié, Christophe J. Nordman, and François Roubaud
Education in Sub-Saharan Africa is oft en seen as the main policy instrument in the fi ght against poverty. In practice, however, although education is an intrinsic component of development and well-being, its economic value is not clear, as urban unemployment in Sub-Saharan Africa is rising, especially among edu-cated workers.
Th e mismatch between (increasing) investment in schooling on the one hand and actual labor market opportunities on the other represents a major challenge for policy makers. For years, the existence of signifi cant rents in the formal sector (especially in the dominant public sector) were so high that it made sense for individuals to “queue” and to undervalue returns in the informal sector. Today, education no longer seems to guard against poverty and social exclusion. It is therefore critical to reappraise the external effi ciency of invest-ment in schooling in these countries.
Traditional studies of the external effi ciency of education systems look at the impact of education on individuals aft er they leave school.1 Th ey examine two types of impacts, economic and social, which can be interpreted either from the individual or the collective standpoint. Th is chapter focuses solely on the economic and private dimensions of the effi ciency of education.
Th e analysis of private returns to education is based on standard human capital theory, according to which earnings diff erentials between individu-als result from diff erences in wage compensation for diff erent human capital endowments. Th is theory suggests that investment in education is an explana-tory factor in the distribution of individual earnings.
Th is principle has substantial implications for low-income countries, because it explains the existence of earnings diff erences between individuals in the labor market. From a policy viewpoint, if returns to education are high for individuals from poor households, poverty reduction policies designed to promote equal opportunities in access to schooling would be appropriate.
164 URBAN LABOR MARKETS IN SUB-SAHARAN AFRICA
Numerous objections and criticisms have been made regarding the assump-tion that educaassump-tion—and hence productivity—is the main determinant of dif-ferences in individuals’ earnings. Many authors have shown that traditional theories postulating the leveling of income levels by individuals with identical levels of human capital do not describe reality when markets are imperfect or segmented.
Markets in African countries are imperfect, and the nature of work contracts interferes signifi cantly in the relationship between human capital endowments and earnings. Th ere are four types of labor markets in developing countries: rural, public, private formal, and informal. Each type of market has its own char-acteristics, such as job seasonality and uncertainty about the level of demand, the nature of contracts, and the structure of wages and earnings. However, many studies on the link between education and labor market outcomes in Africa overlook the fact that the existence of diff erent employment segments, espe-cially in the rural and informal sectors, may have major implications regarding the role of education in labor market integration.2
Th is chapter analyzes the eff ects of education on remuneration in seven cities in the West African Economic and Monetary Union (WAEMU).3 Using Phase 1 of the 1-2-3 surveysin these capitals, we broaden the scope and refi ne the indicators generally used to assess the effi ciency of education for labor market integration in Sub-Saharan Africa, using the same method for each city.4 In particular, we estimate the determinants of earnings, especially the eff ect of education. Th e data allow us to compare the returns to vocational versus general education at diff erent levels of the schooling path, shedding light on the debate over whether general education or vocational training yields higher returns. Th e household survey data enable us to account for two persistent economet-ric problems: the possible sample selectivity biases introduced by endogenous sector choices and the possible endogeneity of the education variable in the earnings function.
Th e results show that returns to schooling generally increase once an endog-enous education variable is accounted for. Th is eff ect is particularly strong in the informal sector. In most cities in the sample, the returns to education are highest in the public sector, followed by the formal private sector and then the informal sector. We also shed light on the fi nding that returns to education are convex in all cities and sectors, including the informal sector. We provide evi-dence of signifi cant eff ects of education on individual earnings in the informal sectors of the major WAEMU cities, even at high levels of schooling.
Th e chapter is organized as follows. Th e fi rst section describes the econo-metric models. Th e second section analyzes and discusses the fi ndings. Th e last section presents the conclusions and off ers some policy recommendations.5
EDUCATION AND LABOR MARKET OUTCOMES IN URBAN WEST AFRICA 165
Econometric Methods
Our methodological approach consists of estimating diff erent models to evalu-ate the impact of education (years of education, type of education [general ver-sus vocational], level reached, and qualifi cations obtained) on earnings. Th e surveys enable us to estimate Mincer-type earnings models, taking account of the sample selection eff ects associated with individuals’ participation and sec-tor choices. In addition, the data allow us to address the possible endogeneity of the education variable in the earnings function using alternative techniques that make use of information on family background.
Earnings Equations with Selection Bias Correction
Let Sj be the sectoral situation (j = 0–3), where S0 = no work, S1 = public sector,
S2 = formal private sector, and S3 = informal private sector. We can view Sj as a
“response function” to a set of latent continuous variables S*
j that measure the
propensities to have the sectoral situations Sj:
S*
ij = bj’ Xi + eij (5.1)
and
Yij= zj’ Zi + hij, (5.2)
where S*
ij measures the propensities of individual i to have the sectoral situation
Sj; Yijdenotes the income individual i earns by working in sector j, where j = 1
(public sector), 2 (formal sector), and 3 (informal sector); Xi and Zi are vectors
of observable individual characteristics (including education); bjand zj are
vec-tors of parameters to be estimated; and ejj and hij are error terms. Th e aim is to
estimate the coeffi cients zj for each sector. Yj is observed only if sector j is chosen;
hjand ej are therefore not independent. As a result, the ordinary least squares
estimator is potentially biased.
In the fi rst stage, multinomial logit models are used to compute the correc-tion terms lij from the predicted probability of individual i working in sector j.
Th e generalized forms of the inverse Mills ratios are then introduced into the earnings equation for each sector j, yielding consistent estimators of bj. Lee’s
method has been criticized because it relies on a strong assumption regarding the joint distribution of error terms of the equations of interest (see Vijver-berg 1993; Dahl 2002; Bourguignon, Fournier, and Gurgand 2007). However, the alternative methods we tried (Dubin and McFadden 1984; Dahl 2002) did not appear more effi cient given the small size of the sectoral subsamples.6 We
166 URBAN LABOR MARKETS IN SUB-SAHARAN AFRICA
therefore chose Lee’s correction method, which has the advantage of providing an easier interpretation of the correction terms.
Another potential problem is that the multinomial logit may suff er from the independence of irrelevant alternatives (IIA) assumption, which in most cases is questionable. Th e Hausman-type tests performed for each city and sector pro-vide overwhelming epro-vidence that the IIA assumption was not violated, except in the informal sector in Bamako.7
In both Heckman’s and Lee’s procedure, identifi cation is achieved using exclusion restrictions (that is, by the inclusion of additional regressors in the fi rst-stage selection equations). In order to preserve comparability across coun-tries as much as possible, we rely on the same exclusion restrictions for each city. However, aft er considering tests of appropriateness of the exclusion restrictions, we relaxed such constraints at the sector level (that is, we use diff erent sets of identifying variables for selection into the informal sector and the formal sec-tors [public and private]).8 In the formal sectors, we use six dummy variables describing the individual’s relationship to the household head (child, spouse), together with the household’s inverse dependency ratio (the number of working individuals divided by the total number of people in the household). For the informal sector, we excluded only the dependency ratio from the second-step regressions, where the individual’s situation in the household oft en appeared signifi cant. We tested the appropriateness of this identifi cation strategy using Wald tests of joint signifi cance of the identifying variables in the fi rst stage and insignifi cance in the second stage for each sector in all cities (21 cases). Th e tests highlighted the appropriateness of this choice in 19 cases.9 However, bearing i n mind the methodological controversies surrounding the choice of identify-ing variables in general, we report summary results from uncorrected earnidentify-ings functions (ordinary least squares) as well, which makes it easier to compare our results with the results of other studies.
Endogenous Education
It is widely recognized in the literature that using ordinary least squares to estimate the returns to education from cross-sectional data is potentially problematic. Th e standard concern is that education may be an endogenous variable—that is, correlated with the residual of the earnings function because of unobserved individual heterogeneity. To address this issue, researchers com-monly use instrumental variables techniques, which involve fi nding variables that are uncorrelated with the individuals’ unobserved heterogeneity but cor-related with their education. Th e instrumentation is oft en based on household and demographic characteristics that are assumed to be uncorrelated with the error term of the earnings equation. Th ese instruments, which are popular in analyses of developing country data, may capture various genetic and environ-mental infl uences (Sahn and Alderman 1988).10
EDUCATION AND LABOR MARKET OUTCOMES IN URBAN WEST AFRICA 167
We tackle the issue of endogeneity using various techniques. First, we use father’s schooling and main occupation as instruments and adopt a control function approach (Garen 1984; Wooldridge 2005; Söderbom and others 2006). Th is method is adopted when the earnings-education profi le is nonlinear in the estimated parameters. As our results show, the marginal eff ects of education are nonconstant (for details and discussion of the implementation of this method, see Kuépié, Nordman, and Roubaud 2009).
Following Blackburn and Neumark (1995), Lam and Schoeni (1993), and Ashenfelter and Zimmerman (1997), we also use family background informa-tion diff erently, introducing it directly into the earnings funcinforma-tions. Doing so is another way of applying the control function procedure (see Kuépié, Nordman, and Roubaud 2009).
All of these techniques are interesting, because the diff erent hypotheses behind them may lead to common features in the results that can be considered relatively robust. Th us, even if endogeneity issues are not perfectly corrected, the similarity of results from the diff erent methods should help convince read-ers of their soundness.
Impact of Education on Labor Market Outcomes
Th is section examines the eff ect of education on labor market insertion and inter-individual earnings diff erentials. In the fi rst subsection, we present some fi gures on the link between labor market integration (unemployment, sector choice) and education. In the second subsection, we report results from pooled and sectoral earnings functions and examine summary results obtained with diff er-ent econometric methodologies, considering in particular selectivity- corrected earnings functions and the education variable as an endogenous regressor. In the third subsection, we focus on the cross-country comparison, using a set of estimates deemed most reliable for each city and sector. In the last subsection, we provide an overview of the marginal returns to diff erent qualifi cations.
Education, Unemployment, and Labor Market Insertion
Th e subsection presents fi ndings on the effi ciency of education in terms of exits from unemployment and integration into diff erent labor market segments (formal versus informal). For the seven cities, the unemployment rate is lowest (15 percent) among people with the least education. It rises to 20–21 percent for people with levels ranging from completed primary schooling to completed secondary schooling.11 It drops slightly (to 19 percent) for people who com-pleted at least one year of higher education.
Th e fact that human capital is thin on the ground does not appear to protect people who have it against unemployment. Th is is particularly true in Lomé,
168 URBAN LABOR MARKETS IN SUB-SAHARAN AFRICA
where unemployment increases strictly with the level of education (from 8 percent among people with no education to 23 percent among people with higher educa-tion). Th e trends are less linear in other cities. In most cases, unemployment tends fi rst to increase with the level of education, before decreasing with completion of secondary school and entry into higher education. Th is pattern is particularly strong in Cotonou, Dakar, and Ouagadougou, where higher education somewhat reduces the extent of unemployment.
Findings from a logit of the probability of being unemployed (controlling for individual and household characteristics such as age, gender, migrant sta-tus, marital stasta-tus, household per capita income, the individual’s relationship to the head of household, and the household’s dependency ratio) are similar to the fi ndings of the descriptive analysis.12 All else equal, individuals with little or no education appear to be less exposed to unemployment than individu-als who have at least completed primary school, probably indicating lower job aspirations. Lomé shows a strong positive relation between unemployment and education. Abidjan and Cotonou also follow this trend. In the other cities, the link between unemployment and the level of education takes the bell shape observed previously.
Th e fact that investment in human capital does not always open the door to employment refl ects deterioration of African urban labor markets, the result of the failure (or absence) of urbanization policies to set in motion a drive to cre-ate skilled jobs. It is also a consequence of structural adjustment policies that reduced staff in the civil service. Evidence of the eff ect of these policies is found in the fact that among people 45–59, who entered the labor market before the urban boom and the full force of the structural adjustment plans was felt, higher education is associated with a low risk of unemployment in all seven cities.
Although being unemployed is an indicator of exclusion from the labor mar-ket, having a job does not always guard against precariousness (see chapters 1, 2, and 4). In the following subsections, we look at the link between education and the quality of the job held in addition to its impact on unemployment.
A quantitative analysis of the balance in the labor markets reveals the exis-tence of signifi cant unemployment against which human capital accumulation is no shield, especially among young people. An analysis of external effi ciency should consider the correspondence between the level of education and job quality. Job quality is studied here in terms of the employment sector: public formal, private formal, and informal (for another approach, see chapter 2).
Th ere is a very close link between the level of education and the employ-ment sector. For the sample as a whole, 91 percent of employed workers who did not start or complete primary school work in the informal sector. Com-pleted primary schooling brings the proportion in the informal sector down to 75 percent; completed middle school reduces it to 50 percent. Only 19 percent of people who entered higher education work in the informal sector. Th is pattern
EDUCATION AND LABOR MARKET OUTCOMES IN URBAN WEST AFRICA 169
holds for all cities except Lomé. In Lomé, the formal sector clearly supplants the informal sector as the level of education rises, but the correlation is weaker than in the other cities and a signifi cant proportion of people with higher education (39 percent) work in the informal sector (95 percent of people who did not start or complete primary school work in the informal sector).
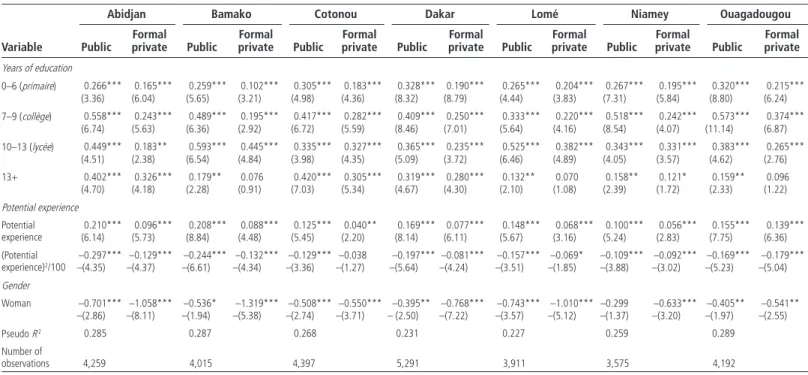
We decompose the formal sector into public and private formal sectors and then run a multinomial logit model to measure the net infl uence of education on sector allocation (table 5.1).13 Th e results show that for all cities and school grades, an additional year of education tends to yield the maximum impact for integrating the public sector, followed by the private formal sector. In three cities (Bamako, Lomé, and Ouagadougou), additional years of higher educa-tion (more than 13 years of schooling) have no infl uence on the probability of integrating into the formal private sector. Th is result may refl ect the incapacity of formal private fi rms to create highly qualifi ed jobs for people with higher education.
Th e type of education also plays an important role in providing access to the formal sector. Only 37 percent of individuals who complete at least four years of vocational education—aft er which they receive an occupational profi ciency certifi cate (the Certifi cat d’aptitude professionnelle [CAP])—work in the informal sector, as opposed to nearly 50 percent of individuals who reached an equivalent level in the secondary school system (that is, completed middle school without starting secondary school). Vocational education is more eff ective for integrat-ing people into the formal sector than general education in Niamey, Dakar, Bamako, Cotonou, and Lomé. Th e share of workers with vocational training who work in the formal sector is 82 percent in Niamey, 71 percent in Dakar and Bamako, 58 percent in Cotonou, and 50 percent in Lomé. By way of comparison, the proportion of individuals who completed general studies at middle school and worked in the formal sector stood at 68 percent in Niamey, 55 percent in Dakar, 41 percent in Bamako, 44 percent in Cotonou, and 30 percent in Lomé. In Abidjan and Ouagadougou, vocational education shows no advantage over general education in terms of the chances of entering the formal sector. Specifi cations of Earnings Functions
Th e earnings regressions assess the seven cities separately. Th e estimates are obtained using the log of hourly rather than monthly earnings to take account of the heterogeneity of working hours in diff erent sectors. Th e additional explana-tory variables in the models are migrant status (dummies for rural, urban, and foreign migrants); marital status (dummies for single, monogamous married, polygamous married, widowed, free union, divorced); and religion (dummies for Muslim and Christian).
In most studies, log earnings are assumed to be linear or quadratic in years of education. Here we seek to document the shape of the entire earnings-education
Table 5.1 Multinomial Logit Models of Impact of Education on Allocation of Labor to Public or Formal Private Sector in Seven Cities in West Africa, 2001/02
Variable
Abidjan Bamako Cotonou Dakar Lomé Niamey Ouagadougou
Public Formal private Public Formal private Public Formal private Public Formal private Public Formal private Public Formal private Public Formal private Years of education 0–6 (primaire) 0.266*** 0.165*** 0.259*** 0.102*** 0.305*** 0.183*** 0.328*** 0.190*** 0.265*** 0.204*** 0.267*** 0.195*** 0.320*** 0.215*** (3.36) (6.04) (5.65) (3.21) (4.98) (4.36) (8.32) (8.79) (4.44) (3.83) (7.31) (5.84) (8.80) (6.24) 7–9 (collège) 0.558*** 0.243*** 0.489*** 0.195*** 0.417*** 0.282*** 0.409*** 0.250*** 0.333*** 0.220*** 0.518*** 0.242*** 0.573*** 0.374*** (6.74) (5.63) (6.36) (2.92) (6.72) (5.59) (8.46) (7.01) (5.64) (4.16) (8.54) (4.07) (11.14) (6.87) 10–13 (lycée) 0.449*** 0.183** 0.593*** 0.445*** 0.335*** 0.327*** 0.365*** 0.235*** 0.525*** 0.382*** 0.343*** 0.331*** 0.383*** 0.265*** (4.51) (2.38) (6.54) (4.84) (3.98) (4.35) (5.09) (3.72) (6.46) (4.89) (4.05) (3.57) (4.62) (2.76) 13+ 0.402*** 0.326*** 0.179** 0.076 0.420*** 0.305*** 0.319*** 0.280*** 0.132** 0.070 0.158** 0.121* 0.159** 0.096 (4.70) (4.18) (2.28) (0.91) (7.03) (5.34) (4.67) (4.30) (2.10) (1.08) (2.39) (1.72) (2.33) (1.22) Potential experience Potential experience 0.210*** 0.096*** 0.208*** 0.088*** 0.125*** 0.040** 0.169*** 0.077*** 0.148*** 0.068*** 0.100*** 0.056*** 0.155*** 0.139*** (6.14) (5.73) (8.84) (4.48) (5.45) (2.20) (8.14) (6.11) (5.67) (3.16) (5.24) (2.83) (7.75) (6.36) (Potential experience)2/100 –0.297*** –0.129*** –0.244*** –0.132*** –0.129*** –0.038 –0.197*** –0.081*** –0.157*** –0.069* –0.109*** –0.092*** –0.169*** –0.179*** –(4.35) –(4.37) –(6.61) –(4.34) –(3.36) –(1.27) –(5.64) –(4.24) –(3.51) –(1.85) –(3.88) –(3.02) –(5.23) –(5.04) Gender Woman –0.701*** –1.058*** –0.536* –1.319*** –0.508*** –0.550*** –0.395** –0.768*** –0.743*** –1.010*** –0.299 –0.633*** –0.405** –0.541** –(2.86) –(8.11) –(1.94) –(5.38) –(2.74) –(3.71) – (2.50) –(7.22) –(3.57) –(5.12) –(1.37) –(3.20) –(1.97) –(2.55) Pseudo R 2 0.285 0.287 0.268 0.231 0.227 0.259 0.289 Number of observations 4,259 4,015 4,397 5,291 3,911 3,575 4,192
Sources: Based on Phase 1 of the 1-2-3 surveys of selected countries in the West African Economic and Monetary Union (WAEMU) conducted in 2001/02 by the Observatoire économique et statistique d’Afrique Subsaharienne (AFRISTAT); Développement, Institutions et Mondialisation (DIAL); and national statistics institutes.
Note: The base category is the informal sector. The additional explanatory variables are migrant status (dummies for rural, urban, or foreign migrants); marital status (dummies for single, monogamous married, polygamous married, widowed, free union, divorced); and dummies for religion (Muslim, Christian). Figures in parentheses are student statistics.
* significant at the 10 percent level, ** significant at the 5 percent level, *** significant at the 1 percent level.
EDUCATION AND LABOR MARKET OUTCOMES IN URBAN WEST AFRICA 171
profi le. We therefore adopt a more fl exible approach, specifying education as a piecewise linear spline function (see below) that allows the strength of the relationship between education and earnings to vary across diff erent parts of the educational distribution. We distinguish four levels of education: primary, lower secondary (collège), upper secondary (lycée), and tertiary. Th e education variables introduced have the form sk(e), where e is years of completed
school-ing at the k level (k: 1,…,4):
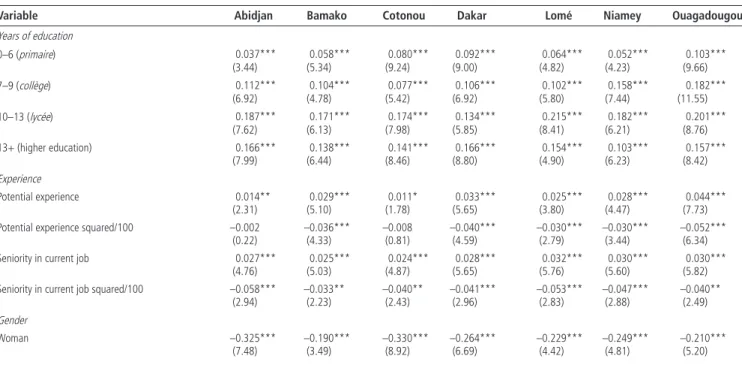
s e e e e s e e e e e s e e 1 2 3 6 6 6 0 6 4 6 6 10 10 0 1 ( ) , ( ) , ( ) =⎧⎨ ≤≤ ⎩ = − ⎧ ⎨ ⎪ ⎩ ⎪ ≤ < ≤ > = − 00 3 10 10 13 13 0 13 13 13 4 ⎧ ⎨ ⎪ ⎩ ⎪ ≤ < ≤ > =⎧⎨ − >≤ ⎩ e e e s e e e e , ( ) . (5.3) Table 5.2 reports the pooled earnings functions estimates across sectors using Heckman’s two-step approach and endogenous education with the control function method. Th e use of a single model for all gainfully employed individu-als provides only the average eff ect of education on earnings, masking specifi c education eff ects in each employment sector. Where diff erences in these eff ects across sectors are small, a pooled model is suffi cient to be able to draw conclu-sions about each labor market segment. Where these eff ects vary widely, the returns to education must be estimated separately for each sector.
Tables 5.3–5.5 report the estimates corrected for potential endogenous sector selection (using Lee’s method).14 To ease reading, given the number of coun-tries studied and the set of alternative estimation techniques, we also present a synthesis table (table 5.6) reporting the average marginal returns to schooling using diff erent methods.15 Before turning to the comments on the returns to human capital, we briefl y discuss the results obtained with diff erent estimation strategies.16
Ordinary least squares versus selectivity-corrected earnings functions. Using a pooled population of paid-work participants across the three sectors, the selection-correction terms stemming from a probit equation of paid-work participation in the fi rst stage are generally insignifi cant, except in Abidjan at the 1 percent level (this fi nding means that the mechanism of allocation of paid-work participants versus nonparticipants is not random and aff ects earnings signifi cantly). Paid-work participation is associated with unobserved characteristics that are negatively correlated with earnings. If sample selectiv-ity is not accounted for, ordinary least squares estimates would yield biased estimates of the returns to observed characteristics, notably human capital.
Table 5.2 Earnings Functions with Endogenous Education and Selectivity Correction in All Sectors in Seven Cities in West Africa, 2001/02 (dependent variable: log of hourly earnings)
Variable Abidjan Bamako Cotonou Dakar Lomé Niamey Ouagadougou
Years of education 0–6 (primaire) 0.037*** 0.058*** 0.080*** 0.092*** 0.064*** 0.052*** 0.103*** (3.44) (5.34) (9.24) (9.00) (4.82) (4.23) (9.66) 7–9 (collège) 0.112*** 0.104*** 0.077*** 0.106*** 0.102*** 0.158*** 0.182*** (6.92) (4.78) (5.42) (6.92) (5.80) (7.44) (11.55) 10–13 (lycée) 0.187*** 0.171*** 0.174*** 0.134*** 0.215*** 0.182*** 0.201*** (7.62) (6.13) (7.98) (5.85) (8.41) (6.21) (8.76) 13+ (higher education) 0.166*** 0.138*** 0.141*** 0.166*** 0.154*** 0.103*** 0.157*** (7.99) (6.44) (8.46) (8.80) (4.90) (6.23) (8.42) Experience Potential experience 0.014** 0.029*** 0.011* 0.033*** 0.025*** 0.028*** 0.044*** (2.31) (5.10) (1.78) (5.65) (3.80) (4.47) (7.73)
Potential experience squared/100 –0.002 –0.036*** –0.008 –0.040*** –0.030*** –0.030*** –0.052***
(0.22) (4.33) (0.81) (4.59) (2.79) (3.44) (6.34)
Seniority in current job 0.027*** 0.025*** 0.024*** 0.028*** 0.032*** 0.030*** 0.030***
(4.76) (5.03) (4.87) (5.65) (5.76) (5.60) (5.82)
Seniority in current job squared/100 –0.058*** –0.033** –0.040** –0.041*** –0.053*** –0.047*** –0.040**
(2.94) (2.23) (2.43) (2.96) (2.83) (2.88) (2.49)
Gender
Woman –0.325*** –0.190*** –0.330*** –0.264*** –0.229*** –0.249*** –0.210***
(7.48) (3.49) (8.92) (6.69) (4.42) (4.81) (5.20)
Sector
Public sector 0.675*** 0.281*** 0.383*** 0.469*** 0.610*** 0.420*** 0.640*** (14.24) (5.75) (9.13) (11.14) (10.99) (9.41) (15.83) Formal private sector 0.476*** 0.229*** 0.229*** 0.407*** 0.418*** 0.397*** 0.591***
(15.03) (4.59) (5.64) (11.83) (7.39) (8.49) (13.16) Corrections
Control variable (residuals of education regression) –0.007 –0.030*** –0.028*** –0.037*** –0.023* –0.015 –0.038***
(0.74) (3.70) (3.81) (4.02) (1.90) (1.60) (4.79)
Inverse Mills ratio –0.240*** 0.058 –0.092 0.004 –0.026 0.035 0.055
(3.86) (1.06) (1.49) (0.07) (0.36) (0.58) (1.03)
Constant –2.023*** –2.480*** –2.296*** –2.506*** –2.967*** –2.759*** –3.214*** (19.41) (23.18) (21.30) (20.02) (24.76) (20.51) (28.63)
Number of observations 4,011 3,821 4,184 4,364 3,496 3,069 3,665
Pseudo R 2 0.51 0.38 0.41 0.42 0.38 0.46 0.55
Sources: Based on Phase 1 of the 1-2-3 surveys of selected countries (see table 5.1 for details).
Note: The additional explanatory variables in the models are migrant status (dummies for rural, urban, and foreign migrants); marital status (dummies for single, monogamous married, polygamous married, widowed, free union, divorced); and religion (dummies for Muslim and Christian). The inverse Mills ratio is derived from a probit estimation of labor market participation for each city (with a dummy variable of strictly positive earnings as the dependent variable) comprising age and its square, gender, years of education, migrant status, marital status, religion, and one identifying variable (the dependency ratio). The reference category is a man working in the informal sector. Figures in parentheses are student statistics. Standard errors are bootstrapped with 500 replications.
* significant at the 10 percent level, ** significant at the 5 percent, *** level significant at the 1 percent level.
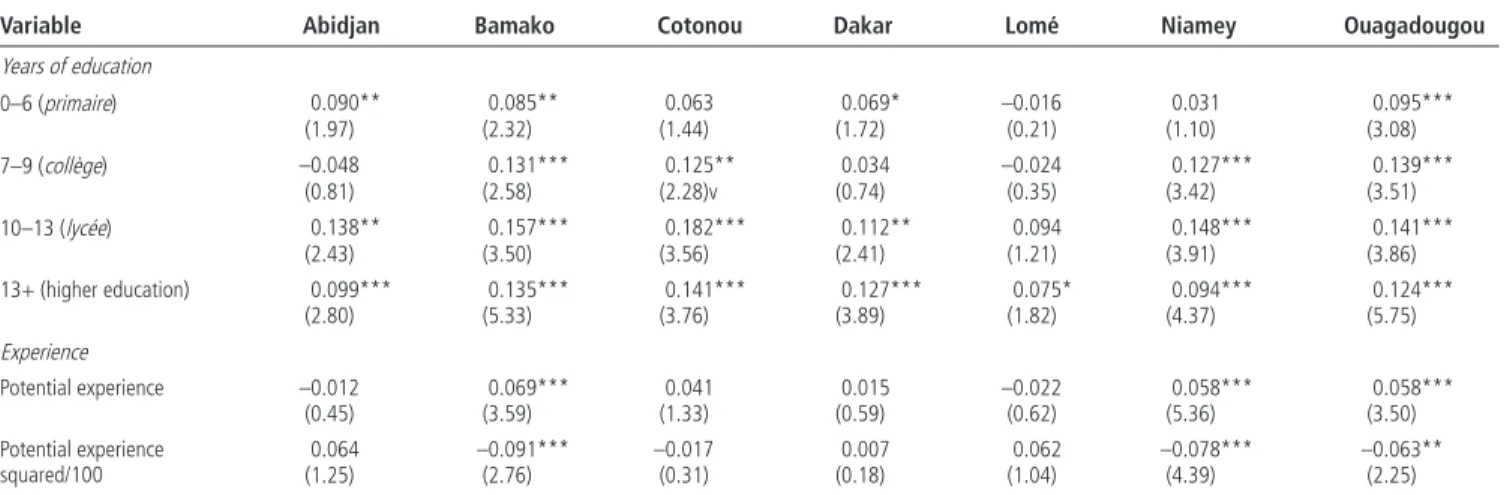
Table 5.3 Earnings Functions with Endogenous Education and Selectivity Correction in the Public Sector in Seven Cities in West Africa, 2001/02 (dependent variable: log of hourly earnings)
Variable Abidjan Bamako Cotonou Dakar Lomé Niamey Ouagadougou
Years of education 0–6 (primaire) 0.090** 0.085** 0.063 0.069* –0.016 0.031 0.095*** (1.97) (2.32) (1.44) (1.72) (0.21) (1.10) (3.08) 7–9 (collège) –0.048 0.131*** 0.125** 0.034 –0.024 0.127*** 0.139*** (0.81) (2.58) (2.28)v (0.74) (0.35) (3.42) (3.51) 10–13 (lycée) 0.138** 0.157*** 0.182*** 0.112** 0.094 0.148*** 0.141*** (2.43) (3.50) (3.56) (2.41) (1.21) (3.91) (3.86) 13+ (higher education) 0.099*** 0.135*** 0.141*** 0.127*** 0.075* 0.094*** 0.124*** (2.80) (5.33) (3.76) (3.89) (1.82) (4.37) (5.75) Experience Potential experience –0.012 0.069*** 0.041 0.015 –0.022 0.058*** 0.058*** (0.45) (3.59) (1.33) (0.59) (0.62) (5.36) (3.50) Potential experience squared/100 0.064 –0.091*** –0.017 0.007 0.062 –0.078*** –0.063** (1.25) (2.76) (0.31) (0.18) (1.04) (4.39) (2.25) 174
Gender
Woman –0.017 –0.072 –0.003 –0.105 0.281* –0.081 –0.058
(0.20) (1.07) (0.03) (1.19) (1.88) (1.37) (0.97)
Corrections
Control variable (residuals of education regression)
–0.006 –0.015 –0.008 –0.015 0.033 0.011 –0.007
(0.26) (1.04) (0.51) (0.97) (1.13) (0.86) (0.59)
Inverse Mills ratio 0.493** –0.184 –0.100 0.249 0.711* 0.016 0.003
(2.42) (1.03) (0.29) (0.92) (1.88) (0.12) (0.01)
Constant –0.176 –3.235*** –2.679** –1.089 0.253 –2.427*** –2.716***
(0.21) (4.77) (2.00) (1.09) (0.18) (5.79) (3.95)
Number of observations 306 459 411 483 313 597 595
Pseudo R 2 0.44 0.38 0.46 0.38 0.45 0.47 0.53
Sources: Based on Phase 1 of the 1-2-3 surveys of selected countries (see table 5.1 for details).
Note: The additional explanatory variables in the models are migrant status, marital status, and religion. The Lee ratio is derived from a multinomial logit model of sector choices (with, as reference category, nonpaid work participation) comprising age and its square, gender, years of education, migrant status, marital status, religion, and identifying variables (namely, dummies on the individual’s relationship to the head of household and the dependency ratio). Figures in parentheses are student statistics. Standard errors are bootstrapped with 500 replications.
* significant at the 10 percent level, ** significant at the 5 percent level, *** significant at the 1 percent level.
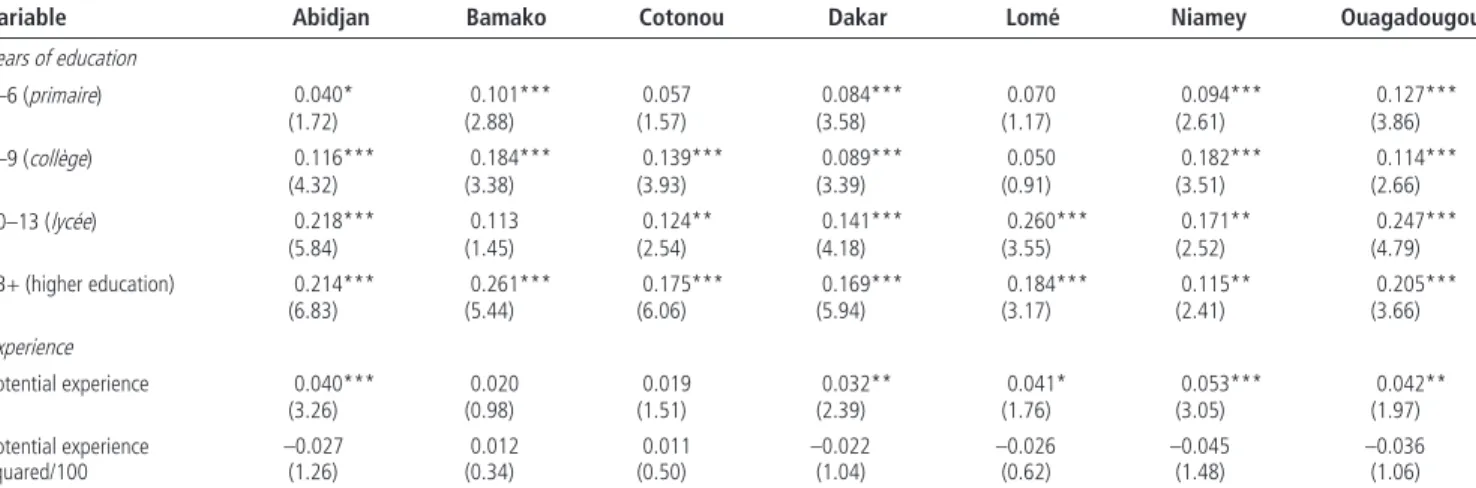
Table 5.4 Earnings Functions with Endogenous Education and Selectivity Correction in the Formal Private Sector in Seven Cities in West Africa, 2001/02 (dependent variable: log of hourly earning)
Variable Abidjan Bamako Cotonou Dakar Lomé Niamey Ouagadougou
Years of education 0–6 (primaire) 0.040* 0.101*** 0.057 0.084*** 0.070 0.094*** 0.127*** (1.72) (2.88) (1.57) (3.58) (1.17) (2.61) (3.86) 7–9 (collège) 0.116*** 0.184*** 0.139*** 0.089*** 0.050 0.182*** 0.114*** (4.32) (3.38) (3.93) (3.39) (0.91) (3.51) (2.66) 10–13 (lycée) 0.218*** 0.113 0.124** 0.141*** 0.260*** 0.171** 0.247*** (5.84) (1.45) (2.54) (4.18) (3.55) (2.52) (4.79) 13+ (higher education) 0.214*** 0.261*** 0.175*** 0.169*** 0.184*** 0.115** 0.205*** (6.83) (5.44) (6.06) (5.94) (3.17) (2.41) (3.66) Experience Potential experience 0.040*** 0.020 0.019 0.032** 0.041* 0.053*** 0.042** (3.26) (0.98) (1.51) (2.39) (1.76) (3.05) (1.97) Potential experience squared/100 –0.027 0.012 0.011 –0.022 –0.026 –0.045 –0.036 (1.26) (0.34) (0.50) (1.04) (0.62) (1.48) (1.06) 176
Gender
Woman –0.083 0.036 –0.039 –0.058 0.031 –0.422** –0.016
0.040* 0.101*** 0.057 0.084*** 0.070 0.094*** 0.127***
Corrections
Control variable (residuals of education regression)
–0.008 –0.068*** –0.021 –0.029* 0.015 0.009 –0.042**
(0.53) (2.98) (1.31) (1.88) (0.39) (0.39) (2.07)
Inverse Mills ratio 0.070 0.345 –0.093 0.203 –0.122 –0.328 0.050
(0.62) (1.18) (0.56) (1.04) (0.44) (1.38) (0.21)
Constant –1.930*** –2.081*** –2.362*** –1.778*** –3.186*** –3.491*** –2.708***
(5.77) (3.02) (4.64) (3.39) (3.75) (5.48) (3.30)
Number of observations 854 455 529 957 307 414 346
Pseudo R 2 0.46 0.32 0.36 0.32 0.35 0.46 0.48
Sources: Based on Phase 1 of the 1-2-3 surveys of selected countries (see table 5.1 for details).
Note: The additional explanatory variables in the models are migrant status, marital status, and religion. The Lee ratio is derived from a multinomial logit model of sector choices (with nonpaid work participation as the reference category) comprising age and its square, gender, years of education, migrant status, marital status, religion, and iden-tifying variables (namely, dummies on the individual’s relationship to the head of household and the dependency ratio). Figures in parentheses are student statistics. Standard errors are bootstrapped with 500 replications.
* significant at the 10 percent level, ** significant at the 5 percent level, *** significant at the 1 percent level.
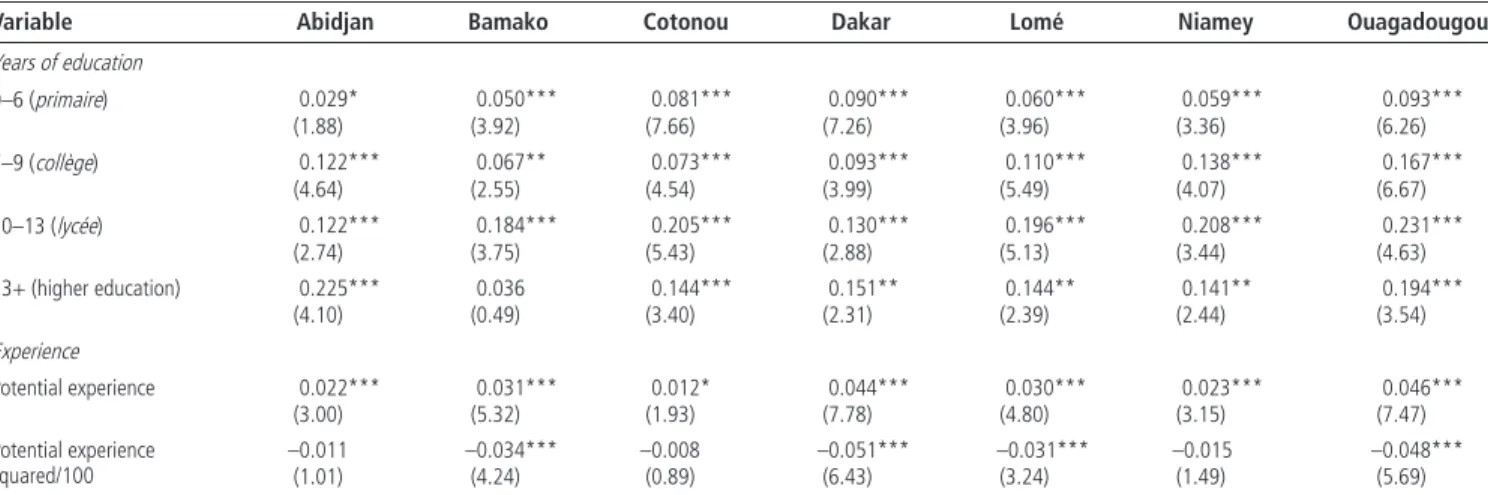
Table 5.5 Earnings Functions with Endogenous Education and Selectivity Correction in the Informal Sector in Seven Cities in West Africa, 2001/02
(dependent variable: log of hourly earnings)
Variable Abidjan Bamako Cotonou Dakar Lomé Niamey Ouagadougou
Years of education 0–6 (primaire) 0.029* 0.050*** 0.081*** 0.090*** 0.060*** 0.059*** 0.093*** (1.88) (3.92) (7.66) (7.26) (3.96) (3.36) (6.26) 7–9 (collège) 0.122*** 0.067** 0.073*** 0.093*** 0.110*** 0.138*** 0.167*** (4.64) (2.55) (4.54) (3.99) (5.49) (4.07) (6.67) 10–13 (lycée) 0.122*** 0.184*** 0.205*** 0.130*** 0.196*** 0.208*** 0.231*** (2.74) (3.75) (5.43) (2.88) (5.13) (3.44) (4.63) 13+ (higher education) 0.225*** 0.036 0.144*** 0.151** 0.144** 0.141** 0.194*** (4.10) (0.49) (3.40) (2.31) (2.39) (2.44) (3.54) Experience Potential experience 0.022*** 0.031*** 0.012* 0.044*** 0.030*** 0.023*** 0.046*** (3.00) (5.32) (1.93) (7.78) (4.80) (3.15) (7.47) Potential experience squared/100 –0.011 –0.034*** –0.008 –0.051*** –0.031*** –0.015 –0.048*** (1.01) (4.24) (0.89) (6.43) (3.24) (1.49) (5.69) 178
Gender
Woman –0.491*** –0.254*** –0.442*** –0.320*** –0.331*** –0.269*** –0.310***
(8.57) (4.34) (10.09) (7.82) (5.86) (4.27) (5.49)
Corrections
Control variable (residuals of education regression)
0.006 –0.020* –0.031*** –0.033*** –0.027** –0.029* –0.032**
(0.39) (1.74) (3.43) (2.67) (2.01) (1.80) (2.38)
Inverse Mills ratio 0.233*** –0.062 0.125* –0.018 0.047 0.054 –0.049
(3.08) (1.06) (1.77) (0.29) (0.59) (0.78) (0.72)
Constant –1.778*** –2.256*** –2.101*** –2.386*** –2.811*** –2.483*** –2.995***
(13.61) (17.81) (17.60) (19.14) (20.07) (13.96) (21.99)
Number of observations 2,859 2,929 3,250 3,423 2,930 2,233 2,771
Pseudo R 2 0.25 0.24 0.26 0.20 0.22 0.17 0.31
Sources: Based on Phase 1 of the 1-2-3 surveys of selected countries (see table 5.1 for details).
Note: The additional explanatory variables in the models are migrant status; marital status; the individual’s relationship to the head of household (dummies for head of house-hold, spouse, son/daughter, father/mother, other relatives); and religion. The Lee ratio is derived from a multinomial logit model of sector choices (with nonpaid work participa-tion as the reference category) comprising age and its square, gender, years of educaparticipa-tion, migrant status, marital status, the individual’s relaparticipa-tionship to the head of household, religion, and one identifying variable (namely, the dependency ratio). Figures in parentheses are student statistics. Standard errors are bootstrapped with 500 replications.
* significant at the 10 percent level, ** significant at the 5 percent, *** level significant at the 1 percent level.
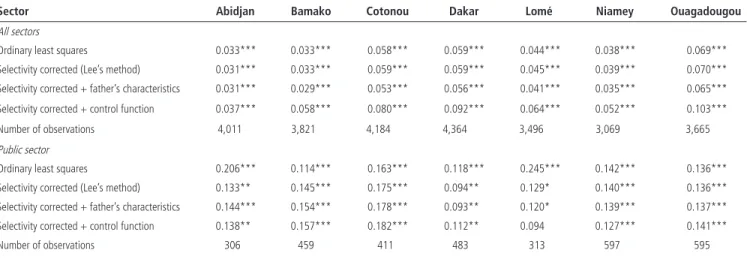
Table 5.6 Marginal Returns to Education in Seven Cities in West Africa, Using Alternative Estimation Techniques, 2001/02
Sector Abidjan Bamako Cotonou Dakar Lomé Niamey Ouagadougou
All sectors
Ordinary least squares 0.033*** 0.033*** 0.058*** 0.059*** 0.044*** 0.038*** 0.069*** Selectivity corrected (Lee’s method) 0.031*** 0.033*** 0.059*** 0.059*** 0.045*** 0.039*** 0.070*** Selectivity corrected + father’s characteristics 0.031*** 0.029*** 0.053*** 0.056*** 0.041*** 0.035*** 0.065*** Selectivity corrected + control function 0.037*** 0.058*** 0.080*** 0.092*** 0.064*** 0.052*** 0.103***
Number of observations 4,011 3,821 4,184 4,364 3,496 3,069 3,665
Public sector
Ordinary least squares 0.206*** 0.114*** 0.163*** 0.118*** 0.245*** 0.142*** 0.136*** Selectivity corrected (Lee’s method) 0.133** 0.145*** 0.175*** 0.094** 0.129* 0.140*** 0.136*** Selectivity corrected + father’s characteristics 0.144*** 0.154*** 0.178*** 0.093** 0.120* 0.139*** 0.137*** Selectivity corrected + control function 0.138** 0.157*** 0.182*** 0.112** 0.094 0.127*** 0.141***
Number of observations 306 459 411 483 313 597 595
Formal private sector
Ordinary least squares 0.112*** 0.143*** 0.104** 0.077*** 0.056 0.181*** 0.075** Selectivity corrected (Lee’s method) 0.108*** 0.138*** 0.111** 0.065*** 0.063 0.191*** 0.065* Selectivity corrected + father’s characteristics 0.107*** 0.115** 0.099** 0.063*** 0.064 0.195*** 0.069* Selectivity corrected + control function 0.116*** 0.184*** 0.124*** 0.089*** 0.050 0.182*** 0.114***
Number of observations 854 455 529 957 307 414 346
Informal sector
Ordinary least squares 0.030*** 0.035*** 0.054*** 0.062*** 0.035*** 0.034*** 0.067*** Selectivity corrected (Lee’s method) 0.033*** 0.034*** 0.057*** 0.061*** 0.037*** 0.035*** 0.066*** Selectivity corrected + father’s characteristics 0.034*** 0.030*** 0.052*** 0.059*** 0.033*** 0.032*** 0.061*** Selectivity corrected + control function 0.029* 0.050*** 0.081*** 0.090*** 0.060*** 0.059*** 0.093***
Number of observations 2,859 2,931 3,250 3,423 2,930 2,233 2,771
Sources: Based on Phase 1 of the 1-2-3 surveys of selected countries (see table 5.1 for details).
Note: Earnings functions include the set of characteristics reported in tables 5.3–5.5. Estimates are computed at the sample mean using the piecewise linear spline earnings function in tables 5.2–5.5.
* significant at the 10 percent level, ** significant at the 5 percent level, *** significant at the 1 percent level.
182 URBAN LABOR MARKETS IN SUB-SAHARAN AFRICA
Th e same picture emerges from the sectoral estimates, which also report only a few signifi cant selectivity terms (Abidjan and Lomé for the public sector, Cotonou and Abidjan for the informal sector; see tables 5.3–5.5).
Exogenous versus endogenous education. We use the father’s characteristics as instruments by means of the control function method. Using the fi rst-stage regressions, in which education is regressed on all exogenous variables, we test for the joint signifi cance of the coeffi cients of father’s characteristics, a necessary condition for consistency of the estimates. For all cities, we can safely reject the hypothesis that these coeffi cients are jointly zero.17 Several interesting patterns emerge from the control function estimates of the returns to schooling (see tables 5.2–5.5).
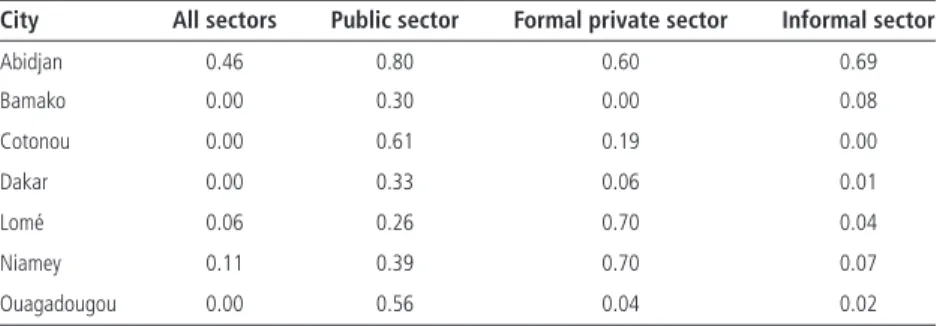
Using the control function approach, we can directly identify the correlation between the endogenous variable (education) and its unobserved determinants. A signifi cant parameter estimate of the control variable (residuals of the educa-tion regression) means that the unexplained variaeduca-tion in the educaeduca-tion variable also aff ects variation in earnings. An insignifi cant parameter means that we cannot accept the hypothesis of endogeneity. Table 5.7 presents the p-values for t-tests associated with each control variable in the diff erent specifi cations.
For all cities, we cannot reject the hypothesis of exogeneity of education in the public sector.18 By contrast, we reject exogeneity in the informal sector in all cities except Abidjan. In the formal private sector, we obtain mixed results, rejecting exogeneity in Bamako, Dakar, and Ouagadougou (instrumentation for the private sector in Bamako appeared dubious, however). In Abidjan, the unex-plained variation of schooling never signifi cantly aff ects variation in earnings. When exogeneity of education is rejected, we place more confi dence in the instrumental variables estimates, at least the ones based on the control function
Table 5.7 Endogeneity Tests of Education in the Earnings Functions in Seven Cities in West Africa, by Sector, 2001/02
City All sectors Public sector Formal private sector Informal sector
Abidjan 0.46 0.80 0.60 0.69 Bamako 0.00 0.30 0.00 0.08 Cotonou 0.00 0.61 0.19 0.00 Dakar 0.00 0.33 0.06 0.01 Lomé 0.06 0.26 0.70 0.04 Niamey 0.11 0.39 0.70 0.07 Ouagadougou 0.00 0.56 0.04 0.02
Sources: Based on Phase 1 of the 1-2-3 surveys of selected countries (see table 5.1 for details).
Note: The null hypothesis is that education is exogenous in the earnings function. Figures show p-values of the t-test.
EDUCATION AND LABOR MARKET OUTCOMES IN URBAN WEST AFRICA 183
approach. Motivations for this choice can be found in Kuépié, Nordman, and Roubaud (2009).
Cross-Country Comparison
Chow tests for the joint equality of coeffi cients across sectors show that the decomposition by institutional sector is justifi ed. Indeed, we fi nd highly con-trasting confi gurations. As expected, the models’ explanatory power declines as one moves from the public sector (pseudo R2 = 0.44 to the formal private sector [0.39] and the informal sector [0.23]). Th is hierarchy is consistent with the pre-dictions of the standard human capital model, which is better suited to account-ing for the heterogeneity of earnaccount-ings in the public sector, where wages are based on a set scale that takes education and experience explicitly into account. In the informal sector, apart from the probability of greater measurement errors, factors not taken into account in our equation, such as the amount of physical capital, are likely to have a signifi cant impact on earnings.
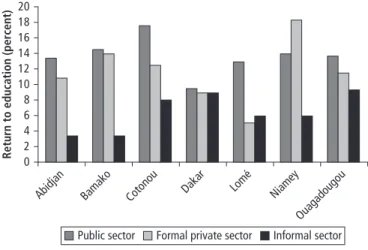
To synthesize the results for education, we present histograms of the mar-ginal returns to education by sector and city at the sample means of education (fi gure 5.1). In six out of seven cities, the return to education is highest in the public sector, with a marginal return ranging from 9.4 percent (in Dakar) to 17.5 percent (in Cotonou). Th is fi nding refl ects, to a great extent, the salary scales for civil servants, which are determined based on diploma and length
Sources: Based on Phase 1 of the 1-2-3 surveys of selected countries (see table 5.1 for details).
Note: Returns are calculated at the sample mean. Estimates are based on results reported in table 5.6. Returns are for the exogenous education variable for the public sector of all cities and for the private sectors of Abidjan and Bamako.
Figure 5.1 Marginal Returns to Education in Seven Cities in West Africa, by Sector, 2001/02
20 18 16 14 12 10 8 6 4 2 0 Ouagadougou Niamey Dakar Lomé
Return to education (percent)
Cotonou Abidjan Bamako
Formal private sector
184 URBAN LABOR MARKETS IN SUB-SAHARAN AFRICA
of service. Th e formal private sector comes next (except in Niamey, where it ranked fi rst), followed by the informal sector (except in Lomé, where returns to education are higher in the informal sector [6 percent] than in the formal pri-vate sector [5 percent], and in Dakar, where the marginal returns across sectors are roughly the same in the two sectors).
Convexity of returns. Th e results show strong evidence that earnings are non-linear in education, with a convex profi le. For all the regressions reported in tables 5.3–5.6, we can reject the linear model at the 10 percent level or lower.19 Convex marginal returns mean that education has a growing impact on remu-neration. In almost all cases, a completed year of lycée (10–13 years completed) provides a greater return than a year of collège (7–9 years), especially in the private sectors.
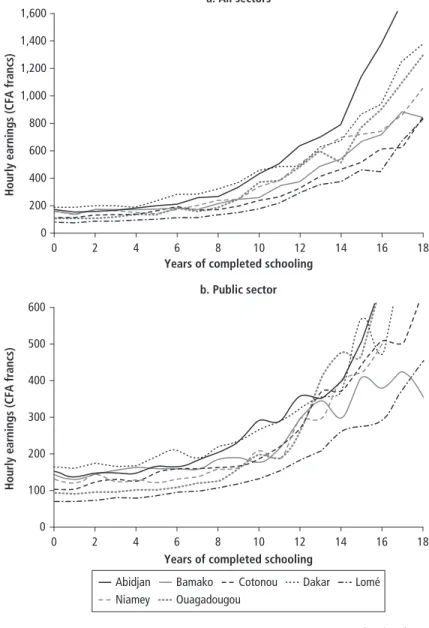
In fi gure 5.2, we present predicted earnings in each sector based on years of completed schooling. For all sectors, earnings are roughly constant until about the 8th year of education and sharply increase around the 11th year, with small diff erences across cities. Th is rise in earnings occurs slightly earlier for informal sector workers (about the eighth year of schooling). Th ese patterns indicate that, to a large extent, the convex profi le refl ects the surge in income observed when individuals make the transition from secondary to higher education in the for-mal sectors and the completion of collège in the informal sector.
Th ese results are inconsistent with the traditional model of human capital accumulation, in which the marginal return to education is assumed to be con-stant or decreasing. Schultz (2004) highlights this convexity, using household surveys for six African countries (Burkina Faso, Côte d’Ivoire, Ghana, Kenya, Nigeria, and South Africa); Söderbom and others (2006) observe it in samples of employees of manufacturing fi rms in Kenya and Tanzania. To our knowledge, this feature of Africa’s labor markets has not been documented before at the sectoral level using representative samples from urban Africa.
Th is result is important, because it has been advocated that not accounting for the high proportion of workers in the informal sector may lead to overes-timates of the returns to primary education and underesoveres-timates of the returns to higher education (Bennell 1996). Convexity is revealed here in all sectors, including the informal sector. In our estimates, the marginal return to pri-mary education is lower than the returns to secondary and higher education in all sectors, and the return to primary school is lower in the informal sector (6.6 percent) than in the formal private sector (7.2 percent). Similarly, the aver-age return to a year of lycée is higher in the informal sector (18.3 percent) than in the formal (public and private) sector (on average, 15.5 percent). Hence, not accounting for earnings in the informal sector indeed yields an overestimation of the returns to primary education, as Bennell (1996) predicted, as well as pos-sibly an underestimation of returns to higher levels of education.20
EDUCATION AND LABOR MARKET OUTCOMES IN URBAN WEST AFRICA 185
Figure 5.2 Estimated Hourly Earnings in Seven Cities in West Africa, by Sector, 2001/02
Hourly earnings (CFA francs)
a. All sectors 1,600 1,400 1,200 1,000 800 600 400 200 0 0 2 4 6 8 10 12 14 16 18
Years of completed schooling b. Public sector
Hourly earnings (CFA francs)
300 200 100 600 500 400 0 0 2 4 6 8 10 12 14 16 18
Years of completed schooling
Cotonou
Abidjan Bamako Dakar
Niamey
Lomé Ouagadougou
186 URBAN LABOR MARKETS IN SUB-SAHARAN AFRICA
Figure 5.2 (continued)
Hourly earnings (CFA francs)
d. Formal private sector
1,600 1,400 1,200 1,000 800 600 400 200 0 0 2 4 6 8 10 12 14 16 18
Years of completed schooling
Cotonou
Abidjan Bamako Dakar
Niamey
Lomé Ouagadougou
Hourly earnings (CFA francs)
c. Informal sector 1,600 1,400 1,200 1,000 800 600 400 200 0 0 2 4 6 8 10 12 14 16 18
Years of completed schooling
EDUCATION AND LABOR MARKET OUTCOMES IN URBAN WEST AFRICA 187
Observing increasing returns to education by levels is important, because the idea that primary education is an eff ective instrument for fi ghting poverty is based partly on the hypothesis of a concave earnings function—that is, the notion that investing in education is more profi table during the fi rst years of schooling. Recommendations for policies aimed at promoting primary educa-tion in Sub-Saharan Africa were drawn up on the basis of this premise, among others (Psacharopoulos and Patrinos 2004).
Various arguments have been posited to explain convexity in the returns to schooling (Bennell 1996, 2002; Schultz 2004). One is that primary education has been overexpanded, reducing the returns relative to higher levels. Another is that over time the quality of primary school has declined, reducing returns (Behrman, Ross, and Sabot 2008). Th e slowdown in formal sector growth, which may have reduced the demand for educated labor and perhaps aff ected less educated individuals more strongly, has also been mentioned.
Returns to Qualifi cations
Th e fact that the earnings function is convex prompted us to make more detailed analyses, measuring the returns to diff erent levels of qualifi cation and not just to average years. To do so, we estimated the marginal returns to holding a diploma, thus accounting for the quality of the school career. In the private sector, we controlled for the endogeneity of schooling using the control function method (except in Abidjan and Bamako).
Returns to qualifi cations can be studied in at least two ways. One way is to directly consider the regression model coeffi cients. In this case, the coeffi cient associated with each qualifi cation dummy is interpreted as the rate of increase in earnings between individuals with no qualifi cations (the reference) and indi-viduals with a particular qualifi cation. Another way is to calculate the marginal returns obtained by subtracting from the considered qualifi cation’s coeffi cient (qualifi cation d) the value of the coeffi cient for the qualifi cation immediately below it (qualifi cation d – 1). For example, the marginal return to a baccalauréat plus two years of higher education (BAC+2) is the diff erence between the coef-fi cient for the BAC+2 and the coefcoef-fi cient for the baccalauréat alone. Th e return to a primary certifi cate (Certifi cat d’études primaires [CEP]) is the diff erence in average earnings between someone with a CEP and someone with no diploma, the return to the middle school certifi cate (Brevet d’études du premier cycle du second degré [BEPC]) is the diff erence in average earnings between someone with a BEPC and someone with a CEP, and so forth. Marginal returns hence correspond to the increases in earnings generated by the acquisition of the next level of qualifi cations. In this study, we rely on marginal returns, because they measure the additional value of each qualifi cation rather than the value com-pared with “no qualifi cations” which is almost always positive.
188 URBAN LABOR MARKETS IN SUB-SAHARAN AFRICA
Kuépié, Nordman, and Roubaud (2009) report the results of this exercise using histograms of the marginal returns to various qualifi cations for each sec-tor. Not surprisingly, the eff ect of each qualifi cation on earnings is positive over-all, with a huge quantitative leap for secondary and higher education, as already shown using continuous variables for schooling. Th e most striking result is that, depending on the city, some diplomas (such as the baccalauréat) do not yield positive marginal returns. Th is situation refl ects either the inadequacy of the training considered with respect to the labor market or the fact that certain diplomas have no value in the labor market but are aimed solely at provid-ing access to higher levels of education. Th is hypothesis might explain the low marginal profi tability of some diplomas in the public sector. But the fact that for many diplomas, additional earnings are nil or negative in the formal private sector suggests that many training schemes do not correspond to the needs of the labor market in this sector.
Th is lack of connection between the level of training revealed by a diploma and the remuneration obtained in the formal private labor market is evident in all of the cities studied. Marginal earnings seem to correspond more closely to the level of training in the informal sector than in the formal private sector (but less than in the public sector). Th is result is inconsistent with the idea that the informal sector does not value educational capital. Th e profi tability of education in the informal sector is illustrated by the earnings premium received by indi-viduals with vocational diplomas (in particular the Brevetd’études profession-nelles [BEP]). In fact, returns to vocational training in the informal sector oft en exceed returns in the formal private sector. Vocational education qualifi cations are also oft en more profi table than general education qualifi cations, which take longer to obtain. For example, although it generally takes one year less to obtain a BEP (on average 11.6 years) than to obtain the baccalauréat (on average 13.0 years), the BEP is oft en more profi table than the baccalauréat, especially in the informal sector. Th e returns to the BEP are more than 40 percent higher than the returns to the baccalauréat in the formal private sector of Cotonou and in the informal sectors of Ouagadougou, Bamako, Niamey, and Lomé. Th e same result holds if we compare the premium for obtaining the CAP (a vocational certifi cate equivalent to completed primary school) versus the BEPC (a general certifi cate of completed primary education).
Conclusion
Using a series of comparable labor force surveys in urban West Africa, we esti-mate the impact of education on labor market outcomes among representative samples of workers in seven economic capitals. Th e data provide a unique cross-country comparison using the same variables and methodology for each city.
EDUCATION AND LABOR MARKET OUTCOMES IN URBAN WEST AFRICA 189
We tackle two recurrent econometric issues that arise in assessing the eff ect of education on individual earnings. First, we address the issue of endogenous sector allocation (public, formal private, and informal sectors) in the earn-ings functions estimates and provide evidence that correcting for this sample selectivity refi nes the returns to education in all cities and sectors. Second, for most cities, we reject the assumption of exogeneity of the education variable, except in the public sector. Using the workers’ family background as an instru-ment for education, we fi nd that the returns to schooling usually increase once endogeneity is accounted for. Th is eff ect is particularly strong in the informal sector.
Traditional theories assume constant or concave marginal returns to educa-tion, which ensure immediate, high profi tability from the fi rst years of school-ing. Th e data from the 1-2-3 surveysof West Africa reveal convex returns in all sectors, including the informal sector. Th is fi nding casts doubts on the suitability of estimating average marginal returns and calls for disaggregated estimates at each level of the educational path. We provide evidence that the convex profi le refl ects the surge in income observed when individuals make the transition from secondary to higher education in the formal sectors; for informal sector workers, it mainly refl ects completion of the fi rst secondary cycle. In Abidjan, Bamako, Dakar, and Lomé, the earnings-education profi le observed is particularly convex for young workers, especially in the informal sector.
Even at high levels, education substantially increases earnings in informal sector jobs in most of the cities studied.21 To our knowledge, these features of Africa’s labor markets have never before been documented at the sectoral level using representative samples of urban areas.
Convexity of the returns to schooling means that stimulating access to pri-mary education is eff ective in reducing poverty only if pripri-mary school graduates can continue their studies in order to take full advantage of the high marginal returns associated with many years of education. Management of the fl ows of students completing general secondary and higher education could benefi t from an in-depth review of the (too) general content of schooling programs, with an eye toward adapting it to the needs of the labor market. In the meantime, to increase the returns to low levels of schooling, improving primary school qual-ity should remain at the top of any agenda for education.
Th at said, unemployment is growing in West African cities, especially among educated workers. Th is mismatch between (increasing) investment in schooling and actual labor market opportunities represents a major challenge. Would an increase in education generate its own demand? Or would more educated people simply add to the pool of disenfranchised and disillusioned workers, whose only hope is to migrate and fi nd employment elsewhere?If our fi ndings provide insight into the question of where specifi c bottlenecks
190 URBAN LABOR MARKETS IN SUB-SAHARAN AFRICA
arise on the labor demand side, they also provide evidence of the existence of signifi cant returns to education in the informal sector that may counterbalance the incentive for job queuing.More specifi cally, if schooling helps workers in the informal sector be more productive (probably thanks to innovation and adaptability), then household and government investments in their education are not being made in vain. Given that the informal sector has created more than 80 percent of urban jobs in West Africa in recent years, concentrating public investments in employment in this sector with attractive policies for the most qualifi ed people could represent a serious alternative to the lack of employment observed in the formal sectors, at least in the short term. Coupled with continued support to primary school quality and postprimary education, such a policy could also pay off in the medium to long term by generating the human capital accumulation required for the modern economy to take off in African cities.
Notes
1. By way of comparison, analyses of the internal effi ciency of education systems con-cern school processes and the way the teaching establishments operate: generally speaking, they compare the schools’ activities and organizational methods with the results obtained by pupils while they are still in the system, looking for the most cost-eff ective situations (Mingat and Suchaut 2000).
2. See Kuépié, Nordman, and Roubaud (2009) for further development of this point and for additional or more complete analyses of the fi ndings presented in this chapter.
3. Th e cities are Abidjan, Côte d’Ivoire; Bamako, Mali; Cotonou, Benin; Dakar, Senegal; Lomé, Togo; Niamey, Niger; and Ouagadougou, Burkina Faso. Although Abidjan and Cotonou are not administrative capitals, we refer to them as capitals because they are the most important economic centers in their countries (Cotonou is also the seat of government).
4. For a description of the 1-2-3 surveys, see box O.1 in the overview.
5. For a presentation of descriptive statistics (education, earnings, and so forth), see chapter 1.
6. Based on Monte Carlo simulations, Bourguignon, Fournier, and Gurgand (2007) conclude that Lee’s method is adapted to small samples.
7. Bourguignon, Fournier, and Gurgand (2007, p. 192) argue that correcting for selec-tion bias based on the multinomial logit model is a “reasonable alternative to mul-tinomial normal models when the focus is on estimating an outcome over selected populations rather than on estimating the selection process itself. Th is seems true even when the IIA hypothesis is severely at odds.” As we are interested primarily in results in the second-stage regression, this argument allows us to be confi dent regarding the choice of a multinomial logit.
8. Th e results of the probits and multinomial logits are not reported, in order to save space. Th ey are available on request from the authors.
EDUCATION AND LABOR MARKET OUTCOMES IN URBAN WEST AFRICA 191
9. Th e exceptions were the formal private sectors in Niamey and Dakar, where the appropriateness of the excluding conditions in the second stage was rejected (at the 10 percent level in Niamey and the 1 percent level in Dakar). In these two cases, we then tried to restrict the number of exclusions, using as identifying variables only a dummy variable indicating whether the respondent was the household head (together with the dependency ratio). Th e test was satisfi ed, and the results in the second step did not diff er from the results obtained previously. We hence report the results including the full set of exclusions in order to ensure perfect comparability across countries. For all cities and sectors, Wald tests of joint signifi cance of the instruments in the fi rst stage never rejected the null hypothesis at the 1 percent level. Th e second-stage equation is still identifi ed without excluding conditions for the need of the tests, as identifi cation relies on the distributional assumption of Lee’s model (see Bourguignon, Fournier, and Gurgand 2007).
10. For example, Ashenfelter and Zimmerman (1997) use parental education, Butcher and Case (1994) exploit the presence of any sister within the family, and Card (1995) draws on proximity to a four-year college as instruments.
11. Th ese fi gures are slightly diff erent from the fi gures presented in chapter 1 because of changes in education brackets.
12. Th ese fi ndings are available from the authors upon request.
13. Th e same set of control variables used for the analysis of unemployment is used here. 14. We drop the tenure variable from the set of covariates in the sectoral estimates,
because seniority in the current job makes less sense in the informal sector. 15. Assuming that the marginal return to education varies across educational levels but
is constant within each cycle, the marginal return to education around the sample’s education mean is defi ned as follows:
R= I( ∈ =
∑
ak k k educ C 1 4), where αk is the estimated coeffi cients of the k education
variables corresponding to the four cycles, I(.) is the indicator function, educ is the average years of schooling, and C is the educational group.
16. Interested readers should see Kuépié, Nordman, and Roubaud (2009).
17. In 18 out of 21 cases, Sargan tests on overidentifying restrictions cannot reject at the 10 percent level the null hypothesis that the instruments are valid. Th e three cases where validity is not supported are the formal private and informal sectors of Bamako and the public sector of Niamey, suggesting that uncorrected education returns be considered in these cases. Th e results of these tests are available upon request.
18. Tests for exogeneity based on Hausman tests confi rm these fi ndings.
19. We investigated whether our fi ndings are sensitive to functional form by consider-ing the eff ects of modelconsider-ing the earnconsider-ings-education profi le as second- and third-order polynomials. Th e quadratic function systematically produced signifi cant squared edu-cation coeffi cients; the cubic form appeared less appropriate in the majority of cases. 20. Th ese cross-country averages mask some country specifi cities.
21. Th e heterogeneity of the informal sector in this respect, notably the possible coex-istence of diff erent employment segments with specifi c features, deserves consider-ation (see chapter 4).
192 URBAN LABOR MARKETS IN SUB-SAHARAN AFRICA
References
Ashenfelter, O., and D. Zimmerman. 1997. “Estimating of Return to Schooling from Sibling Data: Fathers, Sons, and Brothers.” Review of Economics and Statistics 79 (February): 1–9.
Behrman, J. R., D. Ross, and R. Sabot. 2008. “Improving Quality versus Increasing Quan-tity of Schooling: Estimates of Rates of Return from Rural Pakistan.” Journal of Devel-opment Economics 85 (1–2): 94–104.
Bennell, P. 1996. “Rates of Return on Education: Does the Conventional Pattern Prevail in Sub-Saharan Africa?” World Development 24 (1): 183–99.
———. 2002. “Hitting the Target: Doubling Primary School Enrolments in Sub-Saharan Africa by 2015.” World Development 30 (7): 1179–94.
Blackburn, M., and D. Neumark. 1995. “Are OLS Estimates of the Return to Schooling Biased Downward? Another Look.” Review of Economics and Statistics 77 (2): 217–29. Bourguignon, F., M. Fournier, and M. Gurgand. 2007. “Selection Bias Correction Based
on the Multinomial Logit Model: Monte-Carlo Comparisons.” Journal of Economic Surveys 21 (1): 174–205.
Butcher, K. F., and A. Case. 1994. “Th e Eff ects of Sibling Composition on Women’s Edu-cation and Earnings.” Quarterly Journal of Economics 109: 443–50.
Card, D. 1995. “Using Geographic Variation in College Proximity to Estimate the Return to Schooling.” In Aspects of Labour Market Behavior: Essays in Honor of John Vanderkamp, under the direction ofL. N. Christofi des, E. K. Grant , and R. Swidinsky, 201–22. Toronto: University of Toronto Press.
Dahl, G. B. 2002. “Mobility and the Return to Education: Testing a Roy Model with Mul-tiple Markets.” Econometrica 70 (6): 2367–420.
Dubin, J. A., and D. L. McFadden. 1984. “An Econometric Analysis of Residential Elec-tric Appliance Holdings, and Consumption.” Econometrica 52 (2): 345–62.
Garen, J. 1984. “Th e Returns to Schooling: A Selectivity Bias Approach with a Continu-ous Choice Variable.” Econometrica 52 (5): 1199–218.
Kuépié, M., C. J. Nordman, and F. Roubaud. 2009. “Education and Earnings in Urban West Africa.” Journal of Comparative Economics 37 (3): 491–515.
Lam, D., and R. F. Schoeni. 1993. “Eff ects of Family Background on Earnings and Returns to Schooling: Evidence from Brazil.” Journal of Political Economy 1001: 710–40. Mingat, A., and B. Suchaut. 2000. Les systemes éducatifs africains: Une analyse économique
comparative. Brussels: De Boeck University.
Psacharopoulos, G., and H. A. Patrinos. 2004. “Returns to Investment in Education: A Further Update.” Education Economics 12 (2): 111–34.
Sahn, D. E., and H. Alderman 1988. “Th e Eff ects of Human Capital on Wages, and the Determinants of Labor Supply in a Developing Country.” Journal of Development Eco-nomics 29 (2): 157–83.
Schultz, T. P. 2004. “Evidence of Returns to Schooling in Africa from Household Sur-veys: Monitoring, and Restructuring the Market for Education.” Journal of African Economies 13: ii95–148.
EDUCATION AND LABOR MARKET OUTCOMES IN URBAN WEST AFRICA 193
Söderbom, M., F. Teal, A. Wambugu, and G. Kahyarara. 2006. “Dynamics of Returns to Education in Kenyan and Tanzanian Manufacturing.” Oxford Bulletin of Economics, and Statistics 68 (3): 261–88.
Vijverberg, W. P. 1993. “Educational Investments and Returns for Women and Men in Côte d’Ivoire.” Journal of Human Resources 28 (4): 933–74.
Wooldridge, J. M. 2005. “Unobserved Heterogeneity and Estimation of Average Partial Eff ects.” In Identifi cation and Inference for Econometric Models, preparedunder the direction ofD. W. K. Andrews and J. H. Stock, 27–55. Cambridge U.K.: Cambridge University Press.