Concentrations and origin of polycyclic aromatic hydrocarbons
in sediments of the Middle Adriatic Sea
Jelena MANDIĆ
1,2*and Maja PAVELA VRANČIĆ
31Laboratory of Chemical Oceanography and Sedimentology,
Institute of Oceanography and Fisheries, Šetalište I. Meštrovića 63, 21000 Split, Croatia
2 Unite Biogéochimie et Ecotoxicologie, Laboratoire Biogéochimie des Contaminants Organiques, L’Institut Français de Recherche pour l’Exploitation de la Mer – Centre
Atlantique, Rue de l’Ile d’Yeu 21105, 44311 Nantes Cedex 03, France
3Department of Chemistry, Faculty of Natural Sciences, Mathematics and Education,
University of Split, N. Tesle 12, 21000 Split, Croatia
*Corresponding author, e-mail: mandic@izor.hr
A total of 208 polycyclic aromatic compounds and their substituted homologues were investigated on eight stations along Croatia-Italy transect in the Middle Adriatic. PAC concentrations were higher in the coastal area than in the open sea area. The highest PAC concentrations were measured in the vicinity of the industrial harbor of Split while the lowest concentrations were observed on stations located in the open sea area. Polycyclic aromatic hydrocarbons were dominant group of compounds on each investigated station with contributions in total PAC concentration of more than 85%. S-PAH concentrations were higher than O-PAH concentration in each sample and tend to decrease as the distance from the coast increased. Contributions of O-PAH in total PAC concentrations were higher in the open sea sediments while S-PAH contributions were higher in the coastal sediment, indicating a different origin of O-PAH. Grain size analysis of the investigated sediments shows the dominance of fine fraction in sediments in the coastal area whereas sandy particles were a dominant fraction in the open sea sediments. TOC concentrations were higher in the open sea area where lower PAH concentrations were observed, indicating a different origin of PAC and TOC. PAH origin was evaluated by application of diagnostic ratios. Pyrogenic origin was determined only on one station whereas dominance of petrogenic PAHs was observed on the most of the stations in the open sea area. Marine traffic was suspected to be the main source of pollution in the open sea area.
Key words: polycyclic aromatic compounds, PAH, sediments, diagnostic ratios, marine pollution, Adriatic Sea
INTRODUCTION
Polycyclic aromatic hydrocarbons (PAH) are a large group of organic compounds that consist of two or more fused aromatic rings in their structure (VOLHARDT, 1999; EHRENHAUSER, 2015). Along with heterocyclic aromatic
com-pounds, they form a large group of environ-mental pollutants of which many show potential toxicity to living organisms. PAHs are proved to have disruptive effects on the lymphatic system and hematopoietic activity (ATSDR, 1990b, SAN-TODONTO et al., 1981). Chronic exposure to PAHs
leads to mutagenesis, as they tend to incorporate in DNA structure causing mutagenesis and sub-sequent cancer formation.
Although some PAH compounds are formed naturally from biological precursors, most of the PAHs in the environment originate from anthropogenic activities such as transportation, power plants, industrial furnaces, coke and black carbon production, asphalt and petroleum cracking (NEFF, 1979). According to the origin,
PAHs are commonly divided in natural PAHs, which are released into the environment from a natural source such as biogenesis; and PAHs of anthropogenic origin that are produced in various industrial and urban activities. Anthro-pogenic PAHs are further divided in petrogenic PAH compounds, produced during the low-temperature conversion of organic-rich material into the fossil fuel components, and pyrogenic PAHs, produced during the incomplete com-bustion of organic materials in the various high-temperature process. PAH mixtures emit-ted from petrogenic sources contain significant amount of alkyl-substituted PAH and PAHs of lower molecular weight, while mixtures emit-ted from pyrogenic sources are enriched with unsubstituted PAH compounds with more than 3 rings in their structure (GRIMMER et al., 1981; GSCHWEND & HITES, 1981; GUO et al., 2007; SICRE
et al., 1987; BUDZINSKI et al., 1997; YUNKER et al., 2002; TOBISZEWSKI & NAMIESNIK, 2012).
PAH can enter into marine environment directly, via accidental spillage of petroleum products, or indirectly, by riverine inputs, urban and industrial runoffs, atmospheric deposition
etc. Being highly hydrophobic, they tend to adsorb on suspended organic matter and sink through the water column until they finally set-tle in the bottom sediment (TSAPAKIS et al., 2003; NEFF, 1979). Due to the high persistence toward
degradation, PAHs tend to accumulate in sedi-ments in high concentrations persisting toward degradation through long times.
PAHs have been subject of numerous research studies in the last three decades, since the U.S. Environmental Protection Agency (USEPA) included 16 PAH compounds on the list of priority pollutants in the environment, due to their high toxicity for living organisms
(USEPA, 1980). High PAH concentrations were
reported for the coastal sediments of highly industrialized and urbanized areas such as the big coastal cities and harbors (BENLACHEN et al.,
1997; BAUMARD et al., 1998). Considerably lower
concentrations were found in the open sea sedi-ments and other remote areas where anthropo-genic pressures are minimal or absent.
Many authors have studied PAH concen-trations in the sediment of the Adriatic Sea. Values reported for the western Adriatic were in range 31-527 (GUZZELLA & DE PAOLIS, 1994),
corresponding to the values determined in sedi-ments in coastal areas of Chioggia and Ancona
(MAGI et al., 2012). Somewhat higher PAH
con-centrations were reported for the Gulf of Trieste
(NOTAR et al., 2001; HEATH et al., 2006) whereas
very high PAH concentrations were reported for the Venice lagoon (FATTORE et al., 1997). While
these research studies were mainly focused on the northern Adriatic basin and western Adriatic coast, only a few research studies of PAH con-centration were conducted in the sediments of the eastern Adriatic Sea. The aim of the present study was to investigate distribution and sources of PAHs in sediment in the middle part of the eastern Adriatic Sea. Presented research pro-vides preliminary results on PAH concentrations and will serve as a basis for further monitoring and research projects. Except for the PAHs, the list of the target compounds also included heterocyclic aromatic compounds of Sulphur and oxygen, which are commonly emitted with PAHs and can serve as an indicator of PAH origin. In order to find the most reliable indices
of PAH origin, different diagnostic ratios have been examined and the most probable source of pollution was suggested for the each location.
MATERIAL AND METHODS
Research area
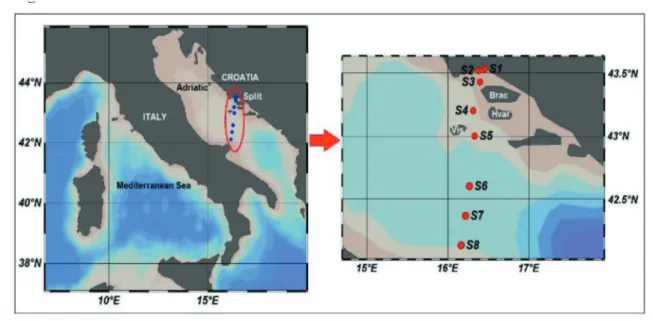
PAH concentrations were studied on eight stations situated along the transect Croatia-Italy in the Adriatic Sea, as shown in Fig. 1.
The Adriatic Sea is a semi-enclosed basin connected with the Eastern Mediterranean through Otranto Strait (GRILLI et al., 2013). It is
commonly divided into northern, middle and southern Adriatic with the northern part being the shallowest. The middle Adriatic is deeper than the northern, reaching its maximum depth of 270 m in the Jabuka Pit. Southern Adriatic is the deepest part with the maximum depth of 1250 m. Mean surface circulation consists of cyclonic gyre flowing northward along the east-ern side (Easteast-ern Adriatic Current - EAC) and southward return flow along the Western side (Western Adriatic Current) (GRILLI et al., 2013).
The Northern Adriatic is highly affected by a large amount of fresh water that is introduced in the Adriatic by the Po River (MARINI et al.,
2015). In the northern Adriatic, Dense Water
mass (Northern Adriatic Dense Water) is
gener-Fig. 1. Sediment sampling locations for determination of polycyclic aromatic compounds
ated during the colder part of the year (autumn and winter), causing a cold bottom current over the Western Adriatic shelf. Transect Croatia (Split) – Italy (Mt. Gargano) is situated in the middle Adriatic, in the vicinity of the borderline between the middle and southern Adriatic. It
encompasses the area of the Palagruža Sill and
it is influenced by the movement of the Middle Adriatic Dense Water that is generated in Mid-dle Adriatic and resides in the bottom layer of the Jabuka Pit. When a large amount of Middle Adriatic Dense Water is formed, it overflows the Jabuka Pit and joins Northern Adriatic Dense Water that flows toward the southeast (MARINI et al., 2015). Formation and circulation of Northern
Adriatic Dense Water and its overflowing of the Jabuka pit influences spreading and distribution
of pollutants over the Palagruža Sill and along
the Western Adriatic coast (MARINI et al., 2015; GRILLI et al., 2013; VILIBIĆ & ORLIĆ 2002; ARTEG -IANI, 1997).
Research area encompasses three stations (S1, S2 and S3) in the coastal area and 5 stations (S4, S5, S6, S7 and S8) located in the open sea area. Station S1 is located in the north-eastern part of Kaštela Bay and is considered an area that is under the great anthropological pressure due to the various industrial and urban activities. The most intensive pressures on this location are from the cement factory, shipyard, industrial
port and urban activities from the nearby cities. Station 2 is located in the middle of the bay and it is affected by anthropogenic activities. Inputs of freshwater by the Jadro River, in the north-eastern part of the bay, are responsible for the lower salinity in the bay if compared to the open sea sediments (ANĐELIĆ et al., 2015). Station S3
is located in the coastal area of Split, between
the islands Brač and Šolta. Stations S4, S5, S6
and S7 are the most distant from both eastern and western Adriatic coast, thus anthropogenic pressures are the least expressed. Marine trans-portation was recognized as the most important activity in this area. Station S8 is approximately 20 miles away from the western Adriatic coast and is also affected by marine transportation. Formation and circulation of Northern and Mid-dle Adriatic Dense Waters contribute to pol-lution state in this area, bringing additional pollutants that are introduced in the Adriatic by the Po River (GRILLI et al., 2013; MARINI et al.,
2015). Additional information for each location is
given in Table 1.
Sediment samples were taken from the research vessel “BIOS DVA” during the cam-paign in February 2013. Approximately 100 grams of the top sediment layer was obtained from each station by the means of a grab sam-pler. Samples were wrapped in pre-cleaned aluminum foil and subsequently stored at the temperature of -20 °C. Frozen samples were transferred to a laboratory and lyophilised. Dry sediment samples were sieved through 0,2 mm screen and transferred to IFREMER laborato-ries where overall analyses were done. In order
to minimize contamination, during the whole procedure, plastic was strictly forbidden and all used laboratory equipment was thoroughly cleaned and heated on 450 ºC before use.
PAC analyses
Polycyclic aromatic compounds were deter-mined according to the method developed by IFREMER laboratories (TRONCZYNSKI et al.,
2004). Ten grams of each sediment sample was
weighed directly into the extraction cell and
spiked with 150 μl of an internal standard solu
-tion containing two deuterated PAH compounds (Phenanthrene-d10 and Benzo[e]pyrene-d12).
Extraction was performed in ASE (Acceler-ated solvent extractor) with dichloromethane (DCM) as a solvent under 100°C and 138 Bar. Each sample was washed 5 times with DCM for two minutes. Sediment extracts were collected in two separate containers and joined upon the extraction. Samples were evaporated in a rotary evaporator and further concentrated under gen-tle nitrogen steam up to the volume of 1 ml. Concentrated extracts were spiked with small portions of isooctane and additionally evaporat-ed until the final volume of 0,5 ml was reachevaporat-ed. Column chromatography with SiO2 and
Al2O3 as sorbents was employed for
clean-ing and fractionation. In order to control the
cleaning process, 300 μL of standard solution
was added in a separate column and afterward treated as the samples extracts. After addition of the samples, columns were washed with 36 ml of hexane for F1 fraction; 30 ml of hexane/DCM
STATION SAMPLING DATE BOTTOMDEPTH
(m) LATITUDE LONGITUDE S1 20.02.2013 18 43,5300N 16,4533E S2 20.02.2013 38 43,5183N 16,3816E S3 18.02.2013 52 43,4266N 16,3983E S4 18.02.2013 78 43,2000N 16,3166E S5 19.02.2013 105 43,0000N 16,3333E S6 18.02.2013 175 42,6000N 16,2683E S7 18.02.2013. 102 42,3666N 16,2200E S8 18.02.2013 116 42,1333N 16,1666E
mixture containing 10% of DCM for F2 and 20 ml of hexane/DCM containing 25% of DCM for F3 fraction. These three fractions were col-lected in the same flask, evaporated in the rotary evaporator and concentrated under nitrogen steam. Upon the concentration, residues were dissolved in isooctane up to the volume of 0,5 mL. Elementary sulphur was removed by addi-tion of activated copper.
Sediment extracts were analyzed with an Agilent 6890 gas chromatograph (GC) using DB-5 MS capillary column (60 m long, 0,25 mm
of internal diameter, phase thickness of 0,25 μm)
in On column injection mode.
1 μL of sample was injected with
COMBI-PAL CTC autosampler. The oven was pro-grammed as follows: holding on 50°C for 1 minute, from 50°C to 100°C at 15°C /min, from 100°C to 300°C at 4°C /min, holding at 300°C for 20 minutes. Helium with a flow rate of 0,8 ml/min was used as a carrier gas.
Identification of compounds was done with an Agilent 5973 N mass spectrometer operating in EI mode (70Ev, T=230°C) by the acquisition of the total mass spectra from 40-400 AMU and total ionic current (TIC) and addition-ally verified according to GC retention times. Quantitative analysis was done in selected ion monitoring (SIM) mode in relation to predeu-terated compounds (Acenaphthalene-d10,
Flu-orene-d10, Pyrene-d10, Benzo[a]anthracene-d12
and Indeno[1,2,3-cd]pyrene-d12) added to the
samples by an auto-sampler prior injection. Set of ten standard solutions with parent compounds
concentration ranging from 0,005 to 8 ng μL-1
were used for calibration. A separate calibration curve was used for very low concentrations of
PAHs in extracts (0,005 – 0,250 ng μl-1).
QA/QC procedure followed an internal protocol developed by IFREMER laboratories. Laboratory and field blanks were analyzed along with each batch of sediment samples. Overall, the analytical protocol was controlled by use of a surrogate standard solution containing phen-anthrene-d10 and benzo[e]pyrene-d12 added to
each sample before extraction, which enable to verify losses of analytes of interests during the entire procedure. Samples with recoveries below 70% were rejected and reanalyzed.
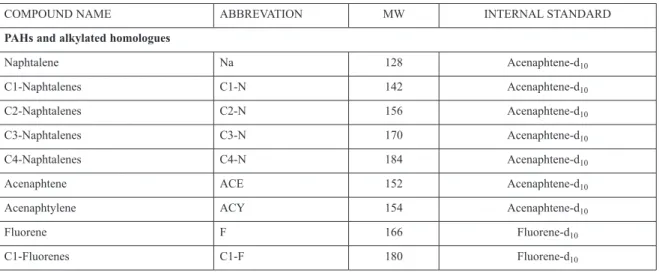
Standard reference materials (SRM 1491 and SRM 2977) from the National Institute of Stand-ards and Technology-NIST were incorporated within a batch of sediment samples. The method detection limits were individually calculated for each sample. Laboratory proficiency for PAH analysis is also evaluated through regular par-ticipation in the QUASIMEME (Quality assur-ance of Information for Marine Environmental Monitoring in Europe) exercises. List of target polycyclic aromatic compounds, abbreviations and internal standards used for quantification are shown in Table 2.
Table 2. List of parent and alkyl-substituted PAHs, sulphur heterocyclic aromatic compounds and oxygen heterocyclic aromatic compounds determined in sediment samples; abbreviation, molecular weight and internal standard used as a reference
COMPOUND NAME ABBREVATION MW INTERNAL STANDARD
PAHs and alkylated homologues
Naphtalene Na 128 Acenaphtene-d10
C1-Naphtalenes C1-N 142 Acenaphtene-d10
C2-Naphtalenes C2-N 156 Acenaphtene-d10
C3-Naphtalenes C3-N 170 Acenaphtene-d10
C4-Naphtalenes C4-N 184 Acenaphtene-d10
Acenaphtene ACE 152 Acenaphtene-d10
Acenaphtylene ACY 154 Acenaphtene-d10
Fluorene F 166 Fluorene-d10
(Cont’d Table 2)
C2-Fluorenes C2-F 194 Fluorene-d10
Anhtracene ANT 178 Fluorene-d10
Phenanthrene PHE 178 Fluorene-d10
C1- Phenanthrene C1-PHE 192 Fluorene-d10
C2- Phenanthrene C2-PHE 206 Fluorene-d10
C3- Phenanthrene C3-PHE 220 Fluorene-d10
Fluoranthene FLA 202 Pyrene-d10
Pyrene PY 202 Pyrene-d10
C1-Pyrenes C1-PY 216 Pyrene-d10
C2-Pyrenes C2-PY 230 Pyrene-d10
Retene RET 219 Pyrene-d10
Perylene PER 252 Benzo[a]anthracene-d12
Benzo[a]anthracene BaA 228 Benzo[a]anthracene-d12
Chrysene CHR 228 Benzo[a]anthracene-d12
C1-Chrysene C1-CHR 242 Benzo[a]anthracene-d12
C2-Chrysene C2-CHR 256 Benzo[a]anthracene-d12
C3-Chrysene C3-CHR 270 Benzo[a]anthracene-d12
Benzo[a]pyrene BaP 252 Benzo[a]anthracene-d12
Benzo[e]pyrene BeP 252 Benzo[a]anthracene-d12
Dibenzo[a,e]pyrene DBP 302 Benzo[a]anthracene-d12
Benzo[b+j+k]fluoranthene BFL 252 Benzo[a]anthracene-d12
C1-Benzofluoranthenes C1-BFL 266 Benzo[a]anthracene-d12
Naphto[1,2-k]fluoranthene NaphtoFL 302 Indeno[1,2,3-cd]pyren-d10
Benzo[ghi]perylene BPER 276 Indeno[1,2,3-cd]pyren-d10
Dibenzo[a,h]anthracene DBA 278 Indeno[1,2,3-cd]pyren-d10
Indeno[1,2,3-cd]pyrene IP 276 Indeno[1,2,3-cd]pyren-d10
Coronene COR 300 Indeno[1,2,3-cd]pyren-d10
C-302 C-302 302 Indeno[1,2,3-cd]pyren-d10
S-PAH and alkylated homologues
Dibenzothiophenes DBT 184 Fluorene-d10
C1-Dibenzothiophenes C1-DBT 198 Fluorene-d10
C2-Dibenzothiophenes, C2-DBT 212 Fluorene-d10
Benzo[b]naphtothiophenes BNTs 234 Pyrene-d10
C1- Benzo[b]naphtothiophenes C1-BNTs 248 Pyrene-d10
O-PAH and alkylated homologues
Dibenzo[b,d]furan DBF 168 Fluorene-d10
C1 - Dibenzo[b,d]furan C1-DBF 182 Fluorene-d10
Grain-size distribution and total organic carbon (TOC) of the sediment
Grain-size distribution of the sediment was determined by the combined method of sieving and aerometric measurements as described by Casagrande (CASAGRANDE, 1948). Sediment was
classified according to the Wentworth scale and presented as the amount of gravel (>0,2 mm), sand (0,125-0,2 mm ) and mud (<0,125mm)
(WENTWORTH, 1922; FOLK, 1954). Mud was
cal-culated as a sum of silt (0,063-0,125 mm) and clay (<0,063). TOC in the sediment was deter-mined by the combined method of chemical and thermal oxidation. Samples were treated with hydrochloric acid for one hour in order to remove carbonate fraction. Afterward, sediment samples were thermally oxidized in the furnace at 375 °C with an airflow rate of 200 ml/min. TOC was finally determined upon the concen-tration of combustion-derived CO2.
Assessment of PAHs origin
PAHs origin was evaluated by calculation of concentration ratios between various PAH compounds. These ratios are often referred to as diagnostic ratios or diagnostic indices as their value is used to differentiate between various PAH sources. In order to accurately ascribe cer-tain ratio value with a possible source of pollu-tion, it is necessary to know the structure of PAH mixtures emitted from different sources. For this purposes, PAH mixtures generated during the combustion of different organic materials under different conditions were extensively studied which isolated PAH molecules that can be used as an indicator of origin. Concentration ratios of isomers with same molecular weight have been widely used in order to differentiate between petrogenic and pyrogenic PAH pollution (GRIM-MER et al., 1981; GSCHWEND & HITES, 1981; GUO et al., 2007; SICRE et al., 1987; BUDZINSKI et al., 1997;
YUNKER et al., 2002). These ratios are temperature
dependent since PAH isomers formed during the low temperature process (< 200 ºC) are more stable than the isomers formed during the high-temperature combustion. Therefore, prevalence of less stable isomer in PAH mixture indicates high-temperature process as the most probable source. Following isomer pairs of the same molecular weight were used: PHE/ANT, FLA/ PY, BaA/CHR and IP/BghiPer.
Other indicators for addressing PAH pollu-tion sources are concentrapollu-tion ratios between par-ent PAHs and their alkylated counterparts (LEH-NDORF & SCHWARK, 2009; GSCHWEND & HITES 1981; KIM et al., 2008; LUO et al., 2008; ELMQUIST et al., 2007). Unburned petroleum and other fossil
fuels contain a significant amount of alkylated PAH, thus, their dominance over unsubstituted homologues is a potential indicator of petro-genic origin of pollution. In this study, the rela-tion between phenanthrene, pyrene, chrysenes and their alkylated homologues were studied in order to distinguish between different PAH source. Concentration ratio between total parent PAHs and total alkylated homologues had also been applied.
Finally, PAH origin was evaluated by appli-cation of pyrogenic index (PI) and fossil fuel pollution index (FFPI). Pyrogenic index (PI) is the ratio of the sum of the concentrations of unsubstituted 3-6 rings PAH, enlisted on EPA 16 priority list, to the sum of the concentration of the five alkylated homologues: naphthalenes, fluorenes, dibenzotiophenes, phenanthrenes and chrysenes (WANG et al., 1999b). PI values are
higher for pyrogenic sources whereas for low PI values petrogenic sources are more likely.
Fossil fuel pollution index (FFPI) evaluates the contribution of fossil fuels to the PAH sedi-ment concentrations using the ratio between the sum of characteristic petrogenic PAHs and total PAH concentration. Following mathematical expression was used for FFPI calculations:
Index values close to zero correspond with the most pyrogenic PAH mixtures while for the unburned fossil fuel this value is close to one
(IQBAL et al., 2008; STOUT et al., 2001b). Petrogenic
sources contribution to overall PAH concentra-tion increases as the index value increases.
RESULTS AND DISCUSSION
PAC concentrations and composition of PAC mixtures in sediments
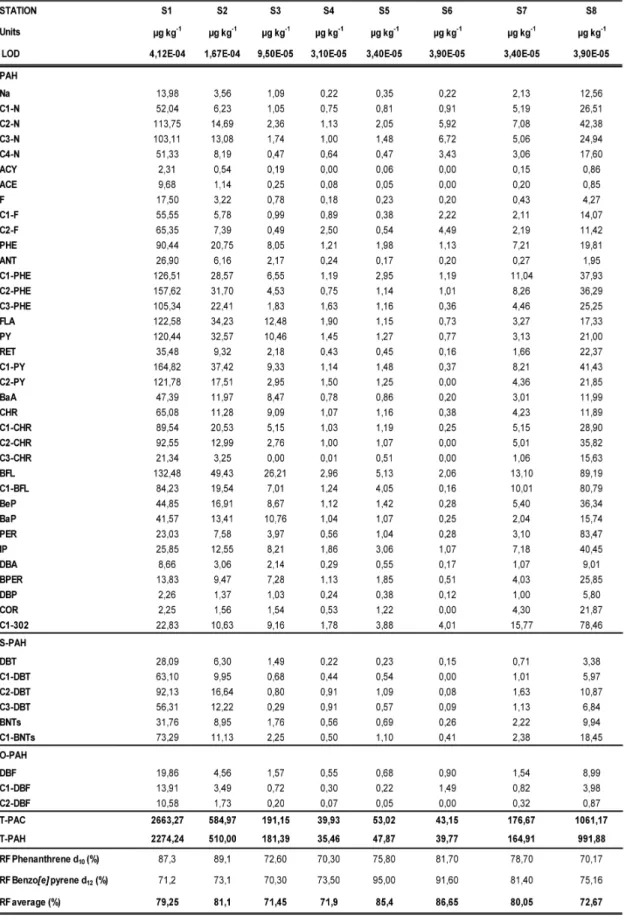
Concentrations of polycyclic aromatic hydrocarbons (PAH), sulfur containing het-erocyclic aromatic compounds (S-PAH) and oxygen-containing heterocyclic compounds (O-PAH) determined on investigated stations are shown in Table 3. PAH concentrations ranged from 35,46 µg kg-1 (S4) to 2274,24 µg kg-1 (S1)
whereas total concentration of polycyclic aro-matic compounds (PAC) ranged from 39,93 µg kg-1 (S4) – 2663,27 µg kg-1 (S1). Composition of
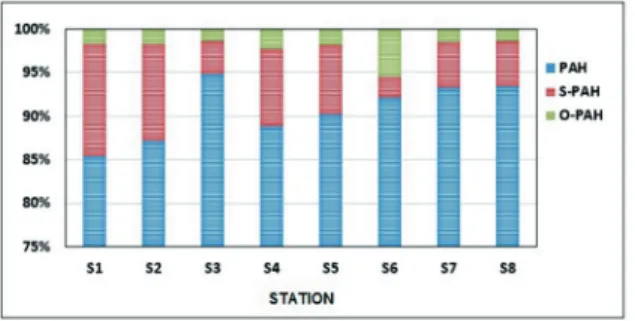
PAC mixture with contributions of PAH, O-PAH and S-PAHs in the sediment of each station area shown in Fig. 2.
Highest PAC concentrations were measured on S1 station, situated in Kaštela Bay, where PAH accounted for 85,39% of total PAC con-centrations in sediment (Fig. 2). High concentra-tions of PAC were also observed on S8 station, located approximately 20 miles from the Monte Gargano (Italian coast). PAH concentrations on this stations were 991,88 µg kg-1 contributing to
total PAC concentrations with 93,43%. PAHs were a dominant group on each station, con-tributing to total PAC concentration with more than 85%. The highest PAH contribution were determined on S3 station where PAHs accounted for 94,89% of total PAC concentrations (Fig. 2).
Concentrations of total S-PAH in the investi-gated sediments ranged from 0,99 µg kg-1 (S6) to
344,68 µg kg-1 (S1). Higher concentrations were
determined in sediments that are more close to the coastal zone where higher concentrations of total PAC were also measured (Table 3). In the
most of the samples, C1-BNTs were dominant S-PAH compound, except for the two stations in Kaštela Bay where the dominance of C2-DBT with concentrations of 92,13 µg kg-1 (S1) and
16,64 µg kg-1 (S2) was observed. Methylated
DBT were dominant compounds on S4 station where C2-DBT concentrations were equal to C3-DBT concentration (0,91 µg kg-1 ).
If S-PAH contributions to total PAC con-centration in sediments were observed (Fig. 2), it is evident that highest contributions of this fraction were found in coastal sediments where the highest absolute concentrations of S-PAH were also determined. On S1 station S-PAH attributed for 12,98% of total PAC concentra-tion whereas on S2 staconcentra-tion, this contribuconcentra-tion was somewhat lower, 11,16% respectively. On S6 station, S-PAH contribution was the lowest (2,31%) while on the rest of the stations, S-PAH contribution were within range 3,81 – 8,88%. In general, concentrations and relative amounts of sulfur-containing PAC tended to decrease as the distance from the coast increased.
Concentrations of non-substituted DBF were higher than the concentrations of its methyl-ated counterparts on the majority of the stations (Table 3). Concentration range for parent DBF was within 0,55 (S4) – 19,86 µg kg-1 (S1) while
sum of the methyl and dimethyl DBF ranged from 0,27 (S5) - 24,49 µg kg-1 (S1). C1-DBF
were found to be dominant O-PAH compounds only on S6 station. Similar to PAH and S-PAH, concentrations of O-PAH were higher on the stations that are closer to the coastal zone. On S1 station, 44,35 µg kg-1 of total O-PAH were
measured, whereas on the S2 station O-PAH concentrations were 9,79 µg kg-1. Somewhat
higher O-PAH concentrations were also found in the sediment of the S8 station (13,84 µg kg-1) while in the open sea stations (S4 and S5),
O-PAH concentrations were below 1 µg kg-1.
Although the highest absolute concentra-tions of O-PAH were measured on S1 station, contributions of this fraction increased as the distance from the coast increased (Fig. 2). The highest contribution was observed on S6 sta-tions where O-PAH accounted for 5,54% of total PAC concentrations. Open sea sediments
Fig. 2. Relative contributions of PAH, S-PAH and O-PAH to total PAC concentration in the investigated samples
Table 3. Concentrations of polycyclic aromatic hydrocarbons, heterocyclic aromatic compounds of sulphur and oxygen (µg kg-1) with detection limits and recovery factors for two deuterated internal standards
displayed higher contributions of O-PAH than stations near the coastal area, which was prob-ably due to the different properties and different environmental behavior of O-PAH if compared with PAH. O-PAH are the most soluble group of polycyclic aromatic compounds; hence, their transport through sediment is enhanced if com-pared to other investigated groups. Furthermore, O-PAH are intermediate products of PAHs bio-degradation, thus enhanced biodegradation rates in the open sea sediment could be another reason for higher O-PAH contributions. If bottom mor-phology of the investigated area was taken into account, former explanation is more likely as it was shown that sea depth gradually increases towards the open sea but in the vicinity of the S3 station depth suddenly decreases forming a barrier for sediment exchange between coastal and open sea area (BOGNER & MATIJEVIĆ, 2016).
Results show that absolute concentrations of heterocyclic compounds decreased when approaching open sea regions, which is due to the lower anthropogenic pressures on these sta-tions if compared to the coastal ones. If, howev-er, contributions of these groups to the total PAC concentration were observed, enrichment of the sediment with O-PAH in open sea regions is noticed whereas S-PAH contributions decreased as the distance from the coast increased. The probable explanation is that S-PAHs are released from the same sources as PAH, thus, areas with higher PAH concentration would also contain higher S-PAH concentrations.
Contrary to the S-PAH, O-PAHs show dif-ferent environmental behavior than PAH com-pounds. The oxygen atom in O-PAH structure is responsible for the enhanced polarity of these compounds allowing more efficient transport through the water bodies. Furthermore, these substances are also formed by PAH degradation, thus, their concentration cannot be predicted upon PAH since O-PAHs are formed while PAHs are being degraded causing O-PAH con-centrations to increase as PAH concentration decrease. (LUNDSTEADT et al., 2007).
The highest PAH concentrations were ob-served on S1 station, situated in the northeast-ern part of Kaštela Bay (Table 3). This station is
nearest to the coast and is under intense anthro-pogenic pressures, mostly derived from trans-portation, industry and urban activities of the city of Split. Concentrations of PAH decreased as the distance from the Eastern coast increased, reaching minimal value on S4 station (35,38 µg kg-1). Afterward, total PAH levels gradually
increased by approaching the western Adriatic coast. Low PAH concentrations were measured on S4, S5, and S6 stations, located in the open sea area and most distant from both, Eastern and Western coast (Table 3).
Obtained results are in good accordance with earlier research of PAHs in the Adriatic. Similar PAH values were reported for the sedi-ments along the western Adriatic coast (GUZEL-LA & DE PAOLIS, 1994), for the Gulf of Trieste (NOTAR et al., 2001; HEATH et al., 2006) and for the
coastal area of Chioggia and Ancona (MAGI et al., 2002.). Considerably higher PAH concentrations
were reported for the areas under greater anthro-pogenic pressure such as Venice lagoon, with PAH concentration ranging from 184 to 201678 µg kg-1 (FATTORE et al., 1997) and Bay of Rijeka
where PAH concentrations were from 52 to 12532 µg kg-1. (ALEBIĆ-JURETIĆ, 2011) Although
a lot of research of PAHs in northern and west-ern Adriatic was performed, there is a lack of recent data on PAHs in sediments of the eastern Adriatic. This is especially true for the middle and south part of the eastern Adriatic where only one research on PAHs was conducted in the last three decades. Back then, maximum PAH concentration was 2000 µg kg-1 (DUJMOV et al., 1994) which was the total PAH concentration in
the sediment of Kaštela Bay, measured by fluo-rimeter and expressed as Chrysene equivalents. Even though this method is less accurate and less sensitive when compared to mass spectrom-etry, obtained results were in good accordance with results provided by the current study. If compared with other parts of Mediterranean Sea, these results show that the most of the sedi-ment PAH concentrations correspond with those reported for the Black Sea (WAKEHAM et al., 1996)
and Eastern Mediterranean (TSAPAKIS et al., 2003).
Obtained data are also in good accordance with PAH values reported for the world sea
sedi-ments: low (<100 µg kg-1 ) or moderate (100-500
µg kg-1) concentrations were found in the open
sea sediments (SAVINOV et al., 2003; BAUMARD et al., 1998; GOGOU et al., 2000) whereas higher PAH
concentration were typical for coastal regions. High PAH concentrations measured on S1 sta-tion, were still below the values reported for the areas of big coastal cities and harbors such as Barcelona harbor (BAUMARD et al., 1998) and
Toulon harbor (BENLAHCEN et al., 1997).
Composition of PAH mixture
Concentrations of 20 parent PAH com-pounds and 16 groups of alkylated PAH isomers on three stations in the coastal zone are shown in Fig. 3.
tion of 49,32 µg kg-1 (Fig. 3). Similar to the S1,
PAH mixture on this station was also enriched on alkyl-PAH especially on C1-PY (37,42 µg kg-1) and methyl-substituted phenanthrenes.
PAH fingerprint pattern for S2 station is similar to the pattern for S1 station although dominance of alkylated PAHs was less expressed. S3 sta-tion was the only stasta-tion in the investigated area with the total concentration of parent PAH compounds being higher than the concentration of their methylated homologues. On this station, dominant compounds in PAH mixture were BFL (26,61 µg kg-1) while C1-PY and C1-302 were
dominant methyl-substituted PAH. PAH finger-print pattern on this station differs from those on S1 and S2 station containing mostly heavier PAH compounds with five and six rings in the structure such as Bep, BaP, IP and BPER. The differences in PAH fingerprint pattern between S3 and other coastal station suggest there are different kind of activities on S3 station, and consequently, different composition of PAH mixtures. Most intense activities on this station are marine transport and inland activities from the nearby islands. The other suspected sources of PAH are assumed to be the fire forests that often occur on the nearby island during the sum-mer seasons. Bottom morphology of this area shows that there is a natural submarine barrier on this site, restricting the normal sea circulation resulting in pollutants accumulation in this area
(BOGNER & MATIJEVIĆ, 2016).
Fig. 4 shows PAH fingerprint patterns deter-mined on stations located in the open sea area. PAH concentrations in the open sea sediments were considerably lower than those in the coastal sediments. On S4 station, BFL were compounds with the highest concentrations in the mixture (2,96 µg kg-1). Sediment was also enriched with
C2-F (2,5 µg kg-1) , C1-PHE (1,19 µg kg-1) and
C1-302 (1,78 µg kg-1). BFL with concentration
of 5,13 µg kg-1 and their methylated homologues
(C1-BFL), with a concentration of 4,05 µg kg-1,
were found to be dominant compounds in the sediment of S5 station (Fig. 4). On this station, PAH mixture was also enriched with C1-302 (3,88 µg kg-1) and IP (3,06 µg kg-1).
Methyl-naphthalenes were dominant PAH compounds on S6 station where 6,72 µg kg-1 of
Fig. 3. Fingerprint pattern of polycyclic aromatic hydro-carbons determined for the three stations in the coastal zone
On S1 station, high concentrations of both, non-substituted PAH and methyl-PAH were determined with the dominance of methyl-PAH. The highest concentration was measured for C1-PY (164,82 µg kg-1) while C2-PHE
con-centration was slightly lower (157,62 µg kg-1).
Among parent PAH, dominant compounds were BFL (132 µg kg-1 ), FL (127,58 µg kg-1) and
PY (120,44 µg kg-1). The dominance of
methyl-substituted PAH, observed on S1 station, is in contrast with the data usually obtained for the coastal sediments and is probably caused by the greater amount of methyl-substituted PAH released during the accidental spills of petro-chemical products from nearby shipyard and port. On S2 stations BFLs were dominant PAH compounds in the mixture with the
concentra-C3-N accounted for 16,91% of total PAH con-centration. The concentration of C2-N was 5,92 µg kg-1 which was equal to the concentration of
C2-F, contributing to total PAH concentration with 14,88% each. Naphthalene and its alkylated homologues, as the smallest PAH molecules, are the least stable among all PAH compounds. The half-life of naphthalene in marine sediments is 0,3 days - 129 days whereas for the more com-plex PAH compounds this time is much longer; e.g. half-life of benzo[a]pyrene is 3-58 years depending on environmental conditions such as temperature, oxygen amount and microbial populations (PAGE et al., 1993). Due to the low
persistence toward degradation, high naphtha-lene concentrations could indicate pollution of more recent dates, although caution is advised when interpreting naphthalenes concentration, as these compounds are the most common labo-ratory contaminant. Dominant PAH compounds in sediment of S7 station were C1-302 (15,77 µg kg-1), followed by BFL (13,10 µg kg-1), C1-PHE
(1,19 µg kg-1) and C1-BFL (10,01 µg kg-1).
BFL, with a concentration of 89,19 µg kg-1,
were dominant PAH on S8 station, followed by C1-BFL with a concentration of 80,77 µg kg-1. High concentrations were also observed
for a C1-302 fraction (78,46 µg kg-1). Perylene
concentration on S8 station was 83,47 µg kg-1
contributing to total PAH concentration with
8,42% which can be a potential indicator of bio-genesis on this location as perylene is naturally produced by bacterial activity (PAGE et al., 1996; TOLOSA et al., 2004; LIMA et al., 2005).
When summarized, obtained results show that BFL were dominant PAH compounds on the majority of the investigated station. These compounds are emitted in high extent from auto-mobile exhaust and coke combustion process and are typically used as an indicator of pyro-genic origin (LEHNDORF & SCHWARK, 2009; KIM
et al., 2008; LUO et al., 2008; ELMQUIST et al., 2007).
However, BFL can also originate from natural sources such as vascular land plants production or termite activity (TOBISZEWSKI & NAMIESNIK, 2012). It is assumed, however, that BFL are of
anthropogenic origin as their dominance in the open sea sediments can be hardly linked to terrestrial activities. Contributions of C1-302 were also high in all sediment samples. Abso-lute concentrations of this fraction decreased as the distance from the coast increased, while on the contrary, relative amounts of C1-302 frac-tion increased as the distance from the eastern coast increased. The highest contribution was observed on S6 station where C1-302 accounted for 10,09% of total PAH. C1-302 contributions were also high on S5 (8,11%) and S7 (9,57%). The lowest contribution was observed on S1 station, where this fraction accounted for only 1,01% of total PAH concentrations. C1-302 fraction contains methylated isomers of PAH with six rings in their structure. This is the heav-iest crude oil fraction typically contained in fuel oil and bituminous resins (STOUT & WANG, 2007).
Because the higher contributions of this fraction were observed in open sea sediments, it could be assumed that C1-302 originate from ship fuel since marine transport is the most intense anthropogenic activity in the open sea regions. Increased relative amount of this fraction in the open sea sediments could be also explained by its high persistence. Degradation rates of PAH decrease with increased molecular weight of the compound, causing enrichment of sediment with heavier PAH fraction (NEFF, 1978; NRCC, 1983). In vitro tests of PAH behavior in
sedi-ments under different environmental conditions
Fig. 4. Fingerprint pattern of polycyclic aromatic hydro-carbons determined for the stations in open sea area
demonstrated that high salinity values (above 37‰ or equal) negatively affect degradation rates of PAH compounds (MARINI & FRAPACINI, 2013). Molecules with higher molecular weight
were more influenced by salinity fluctuations, although persistence of all PAH compounds toward degradation was enhanced at higher salinity values. Enhanced persistence of PAH toward degradation in the areas with higher salinity could be the reason for sediment enrich-ment with heavier PAH compounds in the open sea regions since the coastal zone is more influ-enced by the riverine inputs resulting in lower salinity in this area (MEANS, 1995; MARINI & FRAPACINI, 2013).
Perylene is considered as PAH of natural origin that is formed from biogenic precursors, although a considerable amount of perylene is also produced during the combustion (LIMA et al., 2005). If perylene contribution to the total
concentration of 5-rings PAH is greater than 10%, it can be considered of natural origin. PAH mixtures emitted during the combustion typi-cally contain a small amount of perylene when compared to other PAH with 5 rings in their structure (PAGE at al., 1996; TOLOSA et al., 2004).
Perylene contribution in total 5-ring PAH con-centration was smaller than 10% at each station except for S8 station, where perylene accounted for more than 40% of total 5-rings PAH con-centration, indicating the natural origin of this compound. This result also suggests strong bio-genic/diagenetic activity on this station as these two processes are considered the main natural perylene sources.
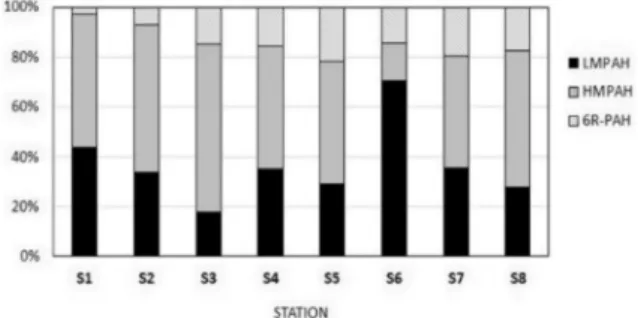
The relative amount of low molecular weight PAHs - LMPAH (2 and 3 ring PAH), high molec-ular weight PAH – HMPAH (4 and 5 ring PAH) and 6-ring PAH in the investigated samples are shown in Fig. 5. High LMPAH contributions to total PAH concentration in sediments were determined on S6 station, where this fraction accounted for 70,41% of total PAH concentra-tion; and S1 station, where LMPAH accounted for 43,59%. The lowest contribution of this frac-tion was observed on S3 stafrac-tion where LMPAH accounted for 17,94% of total PAH concentra-tions. On the rest of the investigated stations, LMPAH contributions to total PAH concen-tration in sediments were higher than 20%. This light PAH fraction is a typical component of unburned fossil fuels and other petroleum-derived products and usually indicates PAH mixtures of petrogenic origin (PAGE et al., 1996; STOUT & WANG, 2007). If compared to HMPAH,
this fraction is more susceptible to both, bio-degradation and photobio-degradation, which is the reason for the enrichment of the sediments with heavier PAH fraction during the time (NEFF, 1979; SICRE et al., 1987). If this was taken into account,
it can be assumed that PAH pollution on S1 and S6 station was either of petrogenic origin or pol-lution of more recent dates. The highest contri-bution of HMPAH fraction was observed on S3 station (67,1%) and S2 station (59%) whereas the lowest HMPAH contribution was observed on S6 station. (15,2%) On other investigated sta-tion, HMPAH were dominant PAH compounds in the mixture contributing to total PAH con-centration with more than 40%. PAH fingerprint pattern with the dominance of HMPAH is typi-cal for the industrialized and urbanized coastal areas where intense anthropogenic pressures are present (WAKEHAM et al., 1996; BENLACHEN et al.,
1997; STORELLI & MARCOTRIGIANO, 2000). The
dominance of this fraction in the open sea sedi-ments is more likely caused by greater persist-ence of HMPAH to degradation, causing sedi-ment enrichsedi-ment with heavier PAH compounds during the time. Relative contributions of 6-ring PAH fractions were higher in the open sea sedi-ments with the maximum value determined on S5 station, where 21,7% of total PAH
concen-Fig. 5. Relative amounts of PAHs with low molecular weight (LMPAH), PAHs with high molecular weight (HMPAH) and PAHs with 6 rings (6R-PAH) in the structure
tration were ascribed to 6-ring PAH. Relatively high contributions of this fraction were also observed on S7 (19,6%) and S8 station (17,4%). In Kaštela Bay, contributions of 6-rings fraction was the lowest: only 2,9% of total PAH concen-tration were ascribed to this fraction on S1 sta-tion and 7% on S2 stasta-tion. Six-rings PAH are the heaviest PAH fraction investigated in this study and is typically formed during the high-temper-ature combustion (GSCHWEND & HITES, 1981; KIM
et al., 2008; LUO et al., 2008, ELMQUIST et al., 2007; LEHNDORF & SCHWARK, 2009). During the crude
oil distillation, 6-ring PAH will be present in the heavier fractions such as diesel fuel, heating oil and distillation resins that are typically used for ship fuels, therefore this fraction was suspected to originate from a fuel combustion in ship engines or from accidental fuel spillage on the sea surface (STOUT & WANG, 2007).
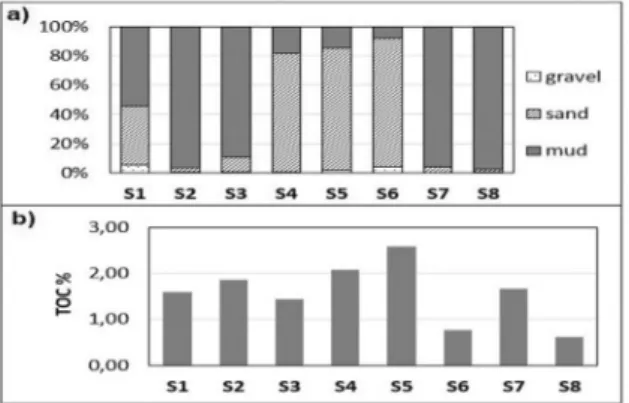
tion while on the other investigated stations dominant sediment fraction was mud. Coastal stations typically contain a higher amount of fine fraction, mainly due to the Jadro River inputs of fine grain material originating from the land. Anthropogenic activities also contribute to increased level of fine particles in sediments. These results are in good accordance with previ-ous research studies conducted in Kaštela Bay
(BOGNER & MATIJEVIĆ, 2016) and other regions of
the Adriatic Sea, where higher amounts of mud particles were usually observed in the coastal region. The high amount of muddy particles in the sediments of S7 (95,97%) and S8 stations (97,72%) is probably due to riverine inputs of fine grain materials. These two stations are near-est to the wnear-estern Adriatic coast and nearnear-est to the Po River delta. Rivers of the Po valley are known for introducing high amounts of land-based material, which is further spread, by the sea currents. This material is enriched with the fine size particles and consequently influences grain size distribution and sediment properties in the western Adriatic (RAVIAOLI et al., 2008;
BOGNER & MATIJEVIĆ, 2016). The sand fraction
was dominant on S4 (81,10%), S5(83,74%) and S6 (87,92%) which are the most remote stations from the coast. Open-sea sediments contain smaller amount of fine grain particles due to the greater distance from riverine inputs and anthro-pogenic pressures. Sediment in the open-sea regions was enriched with sandy fraction, which is partly a natural state of the open sea sediments and the erosion of the nearby islands further contributed to it (RAVIAOLI et al., 2008; BOGNER &
MATIJEVIĆ, 2016).
TOC values were higher in the open sea sediments (Fig. 6b) than in the coastal zone. Maximum TOC value was observed on S5 sta-tion (2,59%) whereas the lowest PAH values were measured on S8 station. TOC values were not correlated with determined PAH concentra-tion since higher TOC values were observed in the open sea sediments where PAH concentra-tions were the lowest. If low TOC value on the S8 station was observed along with the perylene concentration, it can be assumed that enhanced biological activity in the sediment results in
Fig. 6. Grain-size distribution and total organic carbon (TOC) in the sediments of the investigated stations
Polycyclic aromatic hydrocarbons in relation to sediment particle size and total organic
carbon
Grain-size distribution of sediment and total organic carbon (TOC) of investigated sediments are shown in Fig. 6.
Gravel content, ranging from 0% (S7) to 5,6% (S1), was the least abundant size frac-tion in sediments. Somewhat higher amounts of gravel were found on S5 (1,68) and S6 (3,91) while on the other stations, gravel amount was lower than 1% (Fig. 6a). Sand particles were dominant in sediments of S4, S5 and S6
sta-greater biological uptake of organic carbon for the biosynthesis causing lower TOC content of the sediment (PAGE et al., 1996; TOLOSA et al., 2004).
Absent correlation between PAH concentrations and TOC in sediments could be ascribed to their different origin since TOC is a natural compo-nent of the sediment, whereas most of the PAHs are of anthropogenic origin.
Assessment of PAH origin by application of diagnostic ratios
Concentration ratios of PHE/ANT, FLY/PY, BaA/CHR, IP/BPER, calculated for the investi-gated samples are shown in the form of double concentration plots in Fig. 7.
3,71 (S3) corresponded with pyrogenic sources whereas on the S4 and S6 station ratio values indicated equal contributions of both, petrogenic and pyrogenic sources. Stations S1, S2 and S3 being situated in the coastal area are more influenced by industrial and urban activities than other investigated stations, thus, sediment enrichment with anthracene can be ascribed to the combustion process. On the rest of the investigated stations, contribution of petrogenic sources was greater, especially on the S7 sta-tion where ratio value of 26,72 strongly suggest petrogenic pollution.
FLA/PY ratio is also thermodynamically derived ratio commonly applied to distinguish between different PAH sources. Fluoranthene, as a less stable isomer, is preferably formed dur-ing the high-temperature process while on the contrary, pyrene is suspected to be the product of petrogenesis (SICRE et al., 1987; BUDZINSKI et al., 1997). Therefore, low FLA/PY ratio (<1) are
commonly attributed to pyrogenic sources and ratios higher than 1 to the petrogenic sources. When applied, these criteria suggest petrogenic source of pollution in sediments on S5 (0,91), S6 (0,94) and S8 (0,86) station whereas on the other investigated stations, FLA/PY ratio indicates the pyrogenic origin of PAH. If these results are compared to those obtained by application of PHE/ANT ratio it is seen that result for S1, S2, S3, S4, S5 and S8 stations overlap with the result of PHE/ANT ratios while on the rest of the investigated stations slightly different results are observed.
BaA/CHR ratio values were within the 0,41 (S6) and 1,06 (S2) range. During the combustion process, BaA is preferentially produced over chrysene, which enables differentiation between petrogenic and pyrogenic sources (YUNKER et al., 2002; DE LUCA et al., 2004). Criteria adopted in
this study were as follows: BaA/CHR<0,25 indi-cated petrogenic sources, 0,25<BaA/CHR<0,5 is for petroleum combustion and BaA/CHR > 0,5 indicated other combustion processes (YUN-KER et al., 2002). According to this, PAH mixtures
in all samples originate from pyrogenic sources. De Luca proposed higher transition point from petrogenesis to pyrogenesis, suggesting that
Fig. 7. Concentration ratios PHE/ANT, FLY/PY, BaA/CHR, IP/BPER presented as a double plots of a) PHE/ANT vs FLA/PY, b) BaA/CHR vs IP/BPER
Phenanthrene, as the most stable 3-rings PAH, is produced during the conversion of organic matter in petroleum components and its prevalence over anthracene is commonly considered as an indicator of petrogenic pollu-tion (GOGOU et al., 2000; DE LUCA et al., 2004: LIMA
et al., 2005). Therefore, low values of PHE/ANT
ratio are more likely for the combustion process, whereas high ratio values indicate petrogenic pollution. Ratio values calculated for the sedi-ments of S5 (11,44), S7 (26,72) and S8 (10,18) station indicated the dominance of petrogenic sources. In sediments on S1, S2 and S3 stations, low PHE/ANT ratios of 3,36 (S1), 3,37 (S2) and
BaA/CHR ratio <1 indicate petrogenesis while ratios >1 indicate pyrogenesis (DE LUCA et al.,
2004). When this suggestion was taken into
consideration it can be concluded that PAH mixtures in sediment at the majority of inves-tigated stations are petroleum derived, except for S2 and S8 station, where ratio values of 1,06 and 1,01 indicated the pyrogenic origin of PAH. Results derived by application of BaA/ CHR ratio differ from the previously obtained results. These differences can be ascribed to the different behavior of PAH compounds during the weathering. BaA is more suspected to the process of photolysis and shows different envi-ronmental behavior than CHR (YUNKER et al.,
2002; TOBISZEWSKI & NAMIESNIK, 2012). As a less
stable isomer, BaA converts to Chrysene during degradation, reducing the ratio value; therefore, caution has to be applied when using this ratio for weathered pollution (SOCLO et al., 2000; YUN-KER et al., 2002; STOUT et al., 2003).
IP/BPER ratio indicated pyrogenic sources of PAH in sediment samples of each investigat-ed station. Inconsistency of the result obtaininvestigat-ed by application of this ratio with three previously applied criteria is probably due to the different behavior of these two PAHs in the atmosphere. Atmospheric degradation of these isomers is highly influenced by the particle association: degradation rates are the same for both isomers when attached on black particles whereas IP degrades faster than BPER when attached to gray particles and much slower when attached to white particles (BEHYMER & HITES, 1998).
Concentration ratios between following pairs of compounds: C1-PHE and PHE; C1-PY and PY; CHR and C2-CHR and C-PAH/PAH, are shown in Fig. 8. Phenanthrene will dominate over its methyl-homologues in PAH mixture formed during the combustion (LEHNDORF & SCHWARK, 2009); although, combustion at low
temperature also preserves petrogenic alkylation pattern. Some petrogenic sources, such as petro-leum oil shales and their refined products may also obtain C1-PHE/PHE ratio values higher the two (GSCHWEND & HITES, 1981; KIM et al., 2008; LUO et al., 2008). When C1-PHE/PHE value is
smaller than one, pyrogenic sources are more likely (ELMQUIST et al., 2007). Heavy petroleum
fractions, such as creosote and coal tar also show low C1-PHE/PHE ratio (< 0,2) while ratios values 1-2 correspond to both, petrogenic and pyrogenic sources, and can be ascribed to coal, automobile exhaust, motor oils and used lubricants (ELMQUIST et al., 2007). In this study,
C1-PHE/PHE ratios <0,2 are ascribed to coal tar and creosote; values in the range 0,2-1 to pyro-genic sources; values 1-1,5 to mixed sources while ratios higher than 1,5 were ascribed to unburned petroleum (Fig. 8a). According to this ratio, combustion was the dominant source of PAH in sediments at S3 (0,82) station while unburned petroleum was dominant PAH source on following stations: S5 (1,53), S6 (1,65), S7 (1,77) and S8 (2,66). Mixed sources were identi-fied on S1, S2 and S4 station.
Fig. 8. Concentration ratios of: a) C1-PHE and PHE b) C1-PY and PY, c) CHR and C2-CHR d) total alkyl-substituted total PAHs and PAHs; in the investigated samples
Low C1-PY/PY ratio values indicate pyro-genic source while higher values indicate petro-genic source of pollution. Higher the ratio, contribution of the petrogenic sources is higher
(BUCHELI et al., 2004). When applied, this ratio
values showed the greatest contribution of pyro-genic sources on the S6 station (Fig. 8b) while unburned petroleum is the most likely source of pollution on S7 station. Ratio values correspond-ing with petrogenic sources were also observed on the S8 (1,98) and S1 (1,37) station while on the rest of the investigated stations pyrogenic sources were the main source of PAH pollution.
PAH mixtures emitted from pyrogenic sourc-es typically show CHR/C2-CHR ratios higher than one whereas low ratio values (<1) indicate petrogenic pollution (STOUT et al., 2004).
Accord-ing to this ratio, petrogenic sources are dominant on the most of the investigated station (Fig. 8c), except for S3 and S6 station where high ratio values (>3) strongly suggest the dominance of pyrogenic sources. Another indicator based on chrysene and alkyl-chrysene concentrations is a relation between concentrations of chrysene and its alkyl-isomers. In mixtures formed dur-ing the combustion, chrysene concentrations are higher than C1-chrysene and tend to decrease as the degree of alkylation increase. Thus, in case CHR>C1-CHR>C2-CHR>C3-CHR>C4-CHR, PAH are considered to be of pyrogenic origin while on the contrary, if the concentration of any methylated chrysene group is higher than a concentration of parent chrysene, the domi-nance of petrogenic sources is indicated (WANG
et al., 1999b). These criteria confirmed results
provided by CHR/C2-CHR ratio: PAH mixtures on S3 and S6 stations are mainly from pyrogenic sources while on the other station domination of petrogenic sources is observed (Table 3).
C-PAH/PAH ratio was successfully applied in order to discriminate between petrogenic and pyrogenic sources of PAH pollution over large geographic areas and during the long timespans
(YAN et al., 2006). It was shown that pyrogenic
sources produce PAH mixtures with low ratio values, lower than one, respectively. Petroleum combustion yields the highest ratio value of 1.1 and it is an upper limit for the pyrogenic sources, whereas coal combustion produces mixtures with a ratio value of 0,35 (YAN et al., 2007). PAH
compounds taken into account for this ratio were PAH with molecular masses of 128, 178, 202 and 228, respectively. Ratio values for the investigated sediments indicated the dominance of pyrogenic sources only on S3 station (Fig. 8d). The petrogenic source of pollution were the most important PAH sources on S1,S5,S6, S7 and S8 station while on the S2 and S4 station equal contribution of petrogenic and pyrogenic sources was determined (Fig. 8d).
The pyrogenic index is the ratio of the sum of the concentrations of unsubstituted 3-6 PAHs,
enlisted on EPA 16 priority list, to the sum of the concentration of the five alkylated homologues: naphthalenes, fluorenes, dibenzotiphenes, phen-anthrenes and chrysenes (WANG et al., 1999b). PI
values are higher for pyrogenic sources whereas low PI values indicate petrogenic pollution. According to this ratio (Fig. 9.), PAH mixtures on S3 were of pyrogenic origin while on the other investigated station, prevalence of petro-genic sources was observed, especially on S1, S6 and S7 station where index values were as follows: 0,28 (S1), 0,18 (S6) and 0,54 (S7).
Fig. 9. Pyrogenic index (PI) and fossil fuel pollution index (FFPI) determined in the investigated samples
FFPI was the last index used for PAH source apportionments. Index values close to zero cor-respond with the most pyrogenic PAH mixtures while for the unburned fossil fuel this value is close to one (IQBAL et al., 2008). Petrogenic
sources contribution to overall PAH concentra-tion increase as the index value increases. FFPI index indicated the dominance of pyrogenic sources only on S3 station. High petrogenic PAH contributions were observed on S1 and S6 station while on the other investigated station index values showed a slightly higher contribu-tion of petrogenic sources over pyrogenic ones.
CONCLUSIONS
Total PAC concentrations in the investigated area ranged from 39,93 (S4) to 2663,27 (S1). PAHs were a dominant group on each station contributing to the total PAC concentration with
more than 85%. Parent PAH compounds were found to be dominant PAH fraction only on S3 station. Total concentrations of both, PAC and PAH, decreased as the distance from the coast increased, reaching minimum value on S4 sta-tion. Absolute concentrations of heterocyclic aromatic compounds also decreased as the dis-tance from the coast increased, but contribu-tions of O-PAHs in total PAC concentracontribu-tions increased with the distance, being highest in the open sea sediments. This was mainly ascribed to the biologically mediated conversion of PAH into O-PAH during the degradation and it was probably further contributed by transportation of O-PAH from coastal zone. In the most of investigated stations, BFL and C1-302 were dominant PAH compounds, although dominance of methyl-PAH was observed at all station except for S3. Marine traffic was suspected to be the most likely reason for BFL dominance in the open sea sediments since BFL are emitted in large amounts during the fuel combustion in engines. The C1-302 fraction is also suspected to be transportation-derived as this fraction is the heaviest product of petroleum distillation commonly used as ship fuel. Due to the high molecular weight, C1-302 fraction is the least degradable one implying that sediments will be enriched with this fraction since the concentra-tions of the lighter PAH compounds tend to decrease due to degradation. The high amount of perylene measured on S8 station suggests enhanced biological activity at this location. Grain-size analyses showed that fine, muddy particles were dominant sediment fraction in coastal areas whereas in the open sea area sedi-ments were enriched in sandy fraction. These findings are in good accordance with other research in which coastal sediments contain an elevated amount of muddy particles due to the
riverine input of land-based materials. Sediment grain-size distribution determined in this study is also in good accordance with results of previ-ous research studies on sediments of the Adriatic Sea. Although PAH concentrations were higher in the sediments with enhanced amount of fine particles, this cannot be ascribed to differences in mud content as the intense activities in the coastal zone are more likely responsible for elevated PAH concentrations. Diagnostic ratios strongly suggest petrogenic origin on S1, S5, S7, and S8 station where the petrogenic origin was indicated by six or more applied criteria. Pyro-genic origin was determined only on S3 station where 10 out of 11 applied criteria corresponded to pyrogenic sources. Equal contribution of both, petrogenic and pyrogenic sources was determined on S2, S4 and S6 station. Data pre-sented here are preliminary results of more com-plex research of polycyclic aromatic compounds in the Adriatic Sea. Additional investigations on PAH origin, sediment properties, toxicity and seasonal changes in PAH concentrations will be presented in the future papers.
ACKNOWLEDGEMENTS
This study was financially supported by grants funded by French national agency for the promotion of higher education, interna-tional student services, and internainterna-tional mobil-ity “Campus France”. Jelena MANDIĆ wishes to
express her gratitude to Jacek TRONCZYNSKI and
Nadege BELY for their assistance and support
during the scientific visit at IFREMER institute. Authors would also like to thank the crew of the research vessel R/V “BIOS DVA” for their help during the fieldwork.
REFERENCES
ALEBIĆ-JURETIĆ, A. 2011. Polycyclic aromatic
hydrocarbons in marine sediments from the Rijeka Bay area, Northern Adriatic, Croatia, 1998-2006. Mar. Pollut. Bull., 62: 863–869.
ANĐELIĆ, I., S. MATIJEVIĆ & I. UJEVIĆ. 2015.
Pre-liminary investigations of bisphenol A in sediment and suspended matter in Kaštela Bay (Adriatic Sea, Croatia). Acta Adriat., 56(2): 259-268.
ARIAS, A.H., A. VASQUEZ- BOTELLO, N. TOMBESI, G. PONCE-VALEZ, H. FREIJE & J. MARCOVEC-CHIO. 2010. Presence, distribution, and
ori-gins of polycyclic aromatic hydrocarbons (PAHs) in sediments from Bahia Blanca estuary, Argentina. Environ. Monit. Assess., 160: 301-314.
ARTEGIANI, D., E. BREGANT, N. PASCHINI, N. PINARDI, F. RAICICH, & A. RUSSO. 1997. The
Adriatic Sea general circulation. Part I: Air– sea interactions and water mass structure. J. Phys. Oceanogr., 27: 1492–1514.
ATSDR. 1990b. Toxicological Profile for
Poly-cyclic Aromatic Hydrocarbons. ATSDR/ TP-90/20.
BAUMARD, P., H. BUDZINSKI & P. GARRIGUES. 1998B. PAHs in Arcachon bay, France.
Ori-gin and biomonitoring with caged organ-isms. Mar. Pollut. Bull., 36: 577–586.
BEHYMER, T.D. & R.A. HITES. 1985. Photolysis of
polycyclic aromatic hydrocarbons adsorbed on simulated atmospheric particulates. Envi-ron. Sci. Technol., 19: 1004–1006.
BENTLAHCEN, K.T., A. CHAOUI, H. BUDZINSKI, J. BELLOCQO & P.H. GARRIGUES. 1997.
Distri-bution and suorces of polycyclic aromatic hydrocarbons in some Mediterranean coast-al sediments. Mar. Pollut. Bull., 34: 298-305.
BOGNER D. & A. MATIJEVIĆ. 2016. Variety of
phys-ical-chemical characteristics of Holocene sediment from the middle Adriatic Sea (Croatia). Acta Adriat., 57(1): 3-16.
BUCHELI, T.D., F. BLUM, A. DESAULES & O. GUS-TAFSSON. 2004. Polycyclic aromatic
hydro-carbons, black carbon, and molecular mark-ers in soils of Switzerland. Chemosphere, 56: 1061– 1076.
BUDZINSKI, H., I. JONES, J. BELLOCQ, C. PIERARD & P. GARRIGUES. 1997. Evaluation of
sedi-ment contamination by polycyclic aromatic hydrocarbons in the Gironde estuary. Mar. Chem., 58: 85-97.
CASAGRANDE, A. 1948. Classification and
iden-tification of soils. Am. Soc. Civil Engineers Trans., 113: 901-930.
DE LUCA, G., A. FURESI, R. LEARDI, G. MICERA, A. PANZANELLI, P.C. PIU & G. SANNA. 2004.
Poly-cyclic aromatic hydrocarbons assessment in the sediments of the Porto Tores Harbor (Northern Sardinia, Italy). Mar. Chem., 86: 15-32.
DUJMOV, J., P. SUČEVIĆ & M. TONKOVIĆ. 1994.
Ratio between PAH content in fish-striped mullet and sediments in the Eastern Adriatic Sea. Toxicol. Environ. Chem., 46: 73-80.
EHRENHAUSER, F.S. 2015. PAH and IUPAC
Nomenclature. Polycyclic Aromatic Com-pounds, 3: 161-176.
ELMQUIST M, Z. ZENCAK & O. GUSTAFSSON. 2007.
A 700 year sediment record of black car-bon and Polycyclic Aromatic Hydrocarcar-bons near the EMEP Air Monitoring Station in Aspvreten, Sweden. Environ. Sci. Technol., 41:6926–6932.
FATTORE, E., E. BENFENATI, G. MARIANI, E. COOLS, G. VEZZOLI & R. FANELLI. 1997. Analysis of
organic micropollutants in sediment samples of the Venice Lagoon, Italy. Water. Air. Soil. Pollut., 99: 237-244.
FOLK, R. L. 1954. The distinction between grain
size and mineral composition in sedimentary rocks. J. Geol., 62: 344-356.
GOGOU, A., I. BOULOUBASSI & E.G. STEPHANOU. 2000. Marine organic geochemistry of the
Eastern Mediterranean: 1. Aliphatic and pol-yaromatic hydrocarbons in Cretan Sea surfi-cial sediments. Mar. Chem., 68: 265-282.
GSCHWEND, P.M. & R.A. HITES. 1981. Fluxes of
polycyclic aromatic hydrocarbons to marine and lacustrine sediments in the northeastern United States. Geochim. Cosmochim. Acta, 45: 2359-2367.
GRILLI, F., M. MARINI, J.W. BOOK, A. CAMPAN-ELLI, E. PASCHINI & A. RUSSO. 2013. Flux of