Please cite this paper as:
Gandullia, L., N. Iacobone and A. Thomas (2012),
“Modelling the Tax Burden on Labour Income in Brazil,
China, India, Indonesia and South Africa”, OECD Taxation
Working Papers, No. 14, OECD Publishing.
http://dx.doi.org/10.1787/5k8x9b1sw437-en
OECD Taxation Working Papers
No. 14
Modelling the Tax Burden
on Labour Income in Brazil,
China, India, Indonesia and
South Africa
Luca Gandullia, Nicola Iacobone,
Alastair Thomas
OECD CENTRE FOR TAX POLICY AND ADMINISTRATION
OECD TAXATION WORKING PAPERS SERIES
This series is designed to make available to a wider readership selected studies drawing on the work of the OECD Centre for Tax Policy and Administration. Authorship is usually collective, but principal writers are named. The papers are generally available only in their original language (English or French) with a short summary available in the other.
The opinions expressed and arguments employed in these papers are the sole responsibility of the author(s) and do not necessarily reflect those of the OECD or of the governments of its member countries.
Comments on the series are welcome, and should be sent to either [email protected] or the Centre for Tax Policy and Administration, 2, rue André Pascal, 75775 PARIS CEDEX 16, France.
Applications for permission to reproduce or translate all, or part of, this material should be sent to OECD Publishing, [email protected] or by fax 33 1 45 24 99 30.
ABSTRACT/ RÉSUMÉ
Modelling the tax burden on labour income in Brazil, China, India, Indonesia and South Africa
This paper examines the taxation of labour income in five key emerging economies: Brazil, China, India,
Indonesia and South Africa (the “BIICS” countries). The paper highlights the key features of the taxation
of labour income in these countries, and then uses this information to model the tax burdens on labour income in each country following the OECD's Taxing Wages methodology. Average and marginal tax wedges in Brazil and China (Shanghai) are found to be similar in size in 2010 to those of many OECD countries. In contrast, India, Indonesia and South Africa (as well as rural China) impose very low average and marginal tax wedges compared to the vast majority of OECD countries. These relatively low tax wedge results are not altogether surprising given that these countries also currently have lower tax-to-GDP ratios than the OECD average. However, the results suggest that, in the long-term, reforms will be necessary in most of the BIICS countries if the labour income base is to significantly contribute to funding the substantial increases in public expenditure, particularly on infrastructure and social insurance, that will inevitably come as these countries continue to grow.
JEL classification: H24, H55
Keywords: tax wedge, labour income, personal income tax, social security contributions.
********
Modéliser la charge fiscale pesant sur les revenus du travail en Afrique du Sud, au Brésil, en Chine, en Inde et en Indonésie
Ce document propose un examen de la taxation des revenus du travail dans cinq grandes économies
émergentes, à savoir l’Afrique du Sud, le Brésil, la Chine, l’Inde et l’Indonésie. Il met l’accent sur les principales caractéristiques des régimes d’imposition en vigueur dans ces pays, les informations correspondantes étant ensuite utilisées pour modéliser la charge fiscale pesant sur les revenus du travail
dans chaque pays à l’aide de la même méthodologie que celle suivie par l’OCDE pour sa publication
intitulée Les impôts sur les salaires. Il apparaît qu’au Brésil et en Chine (Shanghai), les coins fiscaux
moyens et marginaux sont du même ordre que ceux d’un grand nombre de pays de l’OCDE en 2010. En
Afrique du Sud, en Inde et en Indonésie (ainsi qu’en Chine rurale) en revanche, les coins fiscaux moyens et
marginaux sont très faibles en comparaison de ceux de la grande majorité des pays de l’OCDE. Le niveau relativement bas de ces chiffres n’est pas vraiment surprenant étant donné que ces pays affichent
actuellement des rapports impôt/PIB inférieurs à la moyenne de l’OCDE. Il donne cependant à penser que, sur le long terme, des réformes seront nécessaires dans la plupart de ces économies si la taxation des revenus du travail doit apporter une contribution notable au financement des hausses considérables des
dépenses publiques, en particulier dans les domaines des infrastructures et de la sécurité sociale, qu’elles
devront inévitablement assumer à mesure qu’elles continueront à croître.
Classification JEL : H24, H55
MODELLING THE TAX BURDEN ON LABOUR INCOME IN BRAZIL, CHINA, INDIA, INDONESIA AND SOUTH AFRICA*
Luca Gandullia1, Nicola Iacobone1 and Alastair Thomas2
1. Introduction
This paper examines the taxation of labour income in five key emerging economies: Brazil, China, India,
Indonesia and South Africa (the “BIICS” countries). The paper highlights the key features of the taxation of labour income in the BIICS countries as of 2010 (2009 for Indonesia), and then uses this information to model the tax burdens on labour income in each country.
In order to produce internationally comparable results, the modelling follows the OECD Taxing Wages
methodology (OECD, 2012a). This approach uses the parameters of tax systems to calculate average and marginal tax rates and tax wedges for eight hypothetical representative family types defined in terms of wage income, marital status, and number of children. Earnings levels are specified as a percentage of the average wage in the particular country. The key indicators calculated for each family type are the average and marginal tax wedge. The average tax wedge measures the wedge between the total labour cost faced by an employer and the take home pay received by the employee (as a proportion of the total labour cost). This measure accounts for the effect, at both central and sub-central levels, of personal income taxes, employee and employer social contributions, payroll taxes, and income- and/or family-based tax credits and cash transfers. The marginal tax wedge makes the same calculation but in relation to a small increase in total labour costs.
The modelling results show significant variation in the tax burdens imposed on labour income in the BIICS countries. Average and marginal tax wedges in Brazil and China (for which the modelling focuses on Shanghai) are found to be similar in size to those of many OECD countries. In contrast, India, Indonesia and South Africa impose very low average and marginal tax wedges compared to the vast majority of OECD countries. Indeed, in the latter three countries only relatively high income workers face any substantial tax burden on labour income. The mix of labour taxes also varies across the BIICS countries with social security contributions making up the bulk of the tax wedges in all countries except South Africa. Nevertheless, in India and Indonesia (as well as South Africa), SSC still contributes less to the tax wedge than on average in OECD countries. In China, while Shanghai – on which the modelling is based – does impose substantial social security contributions, several other urban areas impose lower SSC burdens, and in rural areas there is no SSC levied.
* The authors thank Jens Arnold, Bert Brys, Orsetta Causa, Renata Fontana, Richard Herd, Hanning Hu, Yaseen Jhaveri, Maurice Nettley, Marle Van Niekerk, Peter Perkins, Alain De Serres, Renata Teixeira and Chiara Trinchero for their comments, suggestions and assistance. The authors are responsible for any remaining errors in the paper. 1
University of Genoa. 2
The relatively low tax wedge results in the BIICS countries are not altogether surprising given that these countries also currently have lower tax-to-GDP ratios than the OECD average.3 However, the results suggest that, in the long-term, reforms will be necessary in most of the BIICS countries if the labour income base is to significantly contribute to funding the substantial increases in public expenditure, particularly on infrastructure and social insurance, which will inevitably come as these countries continue to grow. Furthermore, the ability to use labour income taxes – particularly personal income taxes – for redistributive purposes will increase as coverage and the overall tax level increases. That said, personal income tax revenue will increase to some extent over time if allowances and thresholds are not increased in line with increases in incomes (as a greater proportion of the population will become subject to progressive personal income taxes). However, if the BIICS countries are to use social security contributions as the main source of finance for their social security systems, contribution rates and/or their coverage will need to increase in the long term if these systems are to develop in the same way as has occurred in most OECD countries.
The paper proceeds as follows. Section 2 discusses the main characteristics of the taxation of labour income in the BIICS countries. Section 3 discusses the modelling methodology, before section 4 presents the average and marginal tax wedge results. Finally, section 5 provides some concluding comments.
2. Labour income taxation in the BIICS countries
Each of the BIICS countries imposes both personal income taxes and (employee and employer) social security contributions on labour income. The main features of these taxes, as of 2010 (2009 for Indonesia), are highlighted below. Two of the five countries also provide cash transfers that effectively reduce the overall tax burden imposed on labour, and these are also discussed below.
2.1. Personal income tax
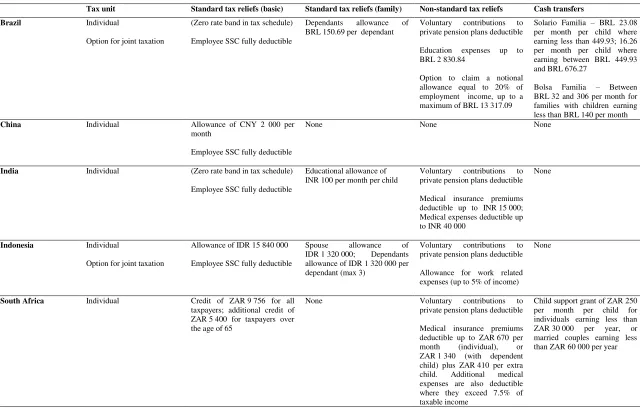
The fundamental structure of the personal income tax (PIT), as it applies to labour income, is relatively similar across the BIICS countries. PIT is generally imposed on an individual basis, with a progressive tax rate schedule applied to income, but with a number of tax reliefs being provided, either as allowances, deductions or tax credits, to lower the final tax due. PIT is calculated on an annual basis in four of the five countries, the exception being China where it is calculated on a monthly basis. Key design features are discussed below and summarized in Tables 1 and 2.
2.1.1. Tax unit
In China and India each individual is considered to be a separate taxable person. This is also the case in South Africa, with minor exceptions, for example to prevent income being channeled from one spouse to the other with the sole or main purpose of reducing the tax due. Meanwhile, in Brazil and Indonesia spouses may opt to file a joint tax return for the household. However, the same tax schedule applies equally for individuals and joint filers – so there is no tax advantage from opting to file jointly.
3
Even where the tax unit is the individual, family status is, with the exception of China, taken into account in other ways: by providing tax credits or allowances related to marital status and the presence of dependent children (as in Brazil, India and Indonesia); or by supplying cash transfers or benefit outside the tax system (as in Brazil and South Africa). These are discussed in more detail below.
2.1.2. Tax reliefs
The BIICS countries provide a number of tax reliefs in the form of deductions, allowances, and credits. These reliefs can be categorised as either “standard tax reliefs” that depend only on income and family characteristics, or “non-standard” tax reliefs that depend in some way on voluntary expenditure.
Looking first at standard reliefs, three countries provide “basic” reliefs that do not depend on family characteristics: China allows a basic monthly deduction of CNY 2 000 – 6.7% of the average wage (AW)4
– in calculating taxable income. The deduction is doubled for individuals who are resident in China and obtain wages and salaries from employment outside China, and for other persons determined by the Ministry of Finance. Indonesia provides a basic allowance (IDR 15 840 000 – 113.8% of the AW), while South Africa provides a basic tax credit (ZAR 9 756 – 84.2% of the AW) to all taxpayers, and an additional tax credit (ZAR 5 400 – 46.6% of the AW) to persons over the age of 65. Meanwhile, Brazil and India have zero rate brackets in their progressive PIT schedule, which have the same effect as a basic allowance (see Section 2.1.3). Additionally, in all countries except South Africa, employee SSC is deductible against personal income tax.
Brazil, India and Indonesia also provide family-based standard reliefs. Brazil allows a standard family allowance (BRL 150.69 per month – 10.5% of the AW) for each qualifying dependent. India provides an educational allowance (INR 100 per child per month – 0.16% of the AW) for up to a maximum of two children. Finally, Indonesia provides a deduction for a dependent spouse and for up to three dependants (IDR 1 320 000 per person – 9.5% of the AW). Note also that Brazil and South Africa have cash transfers that provide similar financial support to families with children as is provided by these family-based standard tax reliefs. These are noted in Table 1, and are discussed in more detail in Section 3.3.
Turning to non-standard tax reliefs, Brazil, India, Indonesia and South Africa all allow voluntary contributions made to approved private pension funds and insurance plans to be deducted, subject to certain limits. Brazil, India and South Africa also allow deductions for medical or educational expenses incurred by the taxpayer and his or her dependants (subject to maximum thresholds).5 Indonesia also allows a deduction for occupational expenses (i.e. expenses incurred by a permanent employee to earn, collect and maintain income received from the employer) of up to five percent of gross income received.
In Brazil, individuals deriving only employment income may choose to claim a single allowance for notional expenses equal to 20 percent of their income (up to a maximum amount of BRL 13 317.09 – 77.6% of the AW), instead of claiming the standard and non-standard tax reliefs discussed above.
4
For each country, the average wage figure is calculated for a full-time worker in the private sector in 2010 (2009 for Indonesia). See Annex 2 for detail on the average wage figures used for each of the BIICS countries.
5
Table 1: Main characteristics of personal income taxation of labour income in BIICS countries, 20101
Tax unit Standard tax reliefs (basic) Standard tax reliefs (family) Non-standard tax reliefs Cash transfers Brazil Individual families with children earning less than BRL 140 per month China Individual Allowance of CNY 2 000 per
month
Employee SSC fully deductible
None None None
India Individual (Zero rate band in tax schedule)
Employee SSC fully deductible allowance of IDR 1 320 000 per dependant (max 3) taxpayers; additional credit of ZAR 5 400 for taxpayers over the age of 65
None Voluntary contributions to
private pension plans deductible expenses are also deductible where they exceed 7.5% of taxable income
Child support grant of ZAR 250 per month per child for individuals earning less than ZAR 30 000 per year, or married couples earning less than ZAR 60 000 per year
1
2009 for Indonesia.
2.1.3. Tax schedule
The tax schedules applied to taxable income vary considerably amongst the BIICS countries. In each case a progressive schedule is applied, but with varying tax rates and numbers of brackets (see Table 2). India and Indonesia have the fewest tax brackets (four), while China has the greatest number (nine). Income in the first bracket is taxed at a very low rate (five percent) in China and Indonesia, while South Africa applies a higher rate (18 percent). Meanwhile, top marginal tax rates range from 27.5 percent in Brazil to 45 percent in China. Note that India applies different income tax schedules for men, women, and for people aged over 65, while China applies a different schedule for certain types of income.6 The other countries apply a single schedule to all taxpayers.
Table 2: Personal Income Tax Schedules in BIICS countries, 20101 Average
See Annex 2 for more detail regarding the definition and calculation of the average wage.
Sources: see Annex 1.
Table 2 also highlights the income levels at which the lowest (non-zero) and the highest marginal tax rates are applied, measured as a percentage of the average wage in each country. At the level of the average wage, we see that only two countries, China and South Africa, impose any PIT on labour income. In Brazil and India, the zero rate bands drive this result, while in Indonesia, the standard deductions discussed above prevent any PIT liability. In India, a worker must earn 261 percent of the average wage before any PIT is due, while in Indonesia deductions will prevent any tax due up until 113 percent of average earnings (for a single individual). Even before undertaking any modelling, it is therefore possible to conclude that PIT in the BIICS countries is predominantly a tax on workers with relatively high incomes.7 This is perhaps unsurprising given the relatively low absolute income levels in the BIICS countries, as imposing substantial tax burdens on low-income workers is unlikely to meet the revenue generation and redistributional goals of an income tax.
The income level at which the top PIT rate is applied varies substantially across countries. It is imposed on workers in Brazil earning around 2.6 times the average wage and in South Africa on workers earning around 3.9 times the average wage. In contrast, a worker in Indonesia must earn almost 36 times the average wage before they start paying the top PIT rate, while in China they must earn more than 40 times the average wage.
6
For example, remuneration for personal services is taxed separately from other sources of employment income. 7
2.1.4. Local taxes
In Brazil, China, Indonesia and South Africa income tax is imposed only at the level of the central government. However, in India workers can also be subject to tax at the sub-central (state) level. States impose a “professional” tax on higher income workers, with rates and tax bases varying across states. For example, in New Delhi, the professional tax is imposed at a rate of 10 percent on income above INR 145 000 (237% of the AW), rising to 30 percent on income above INR 250 000 (408% of the AW).
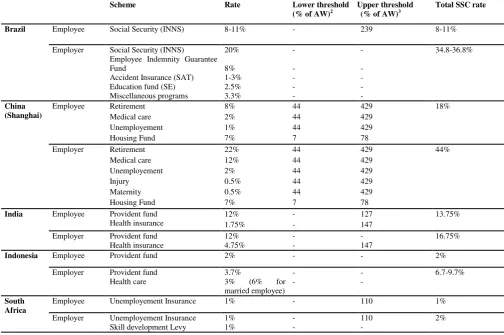
2.2. Social security contributions
In all BIICS countries employees and employers are obliged to contribute to one or more social security schemes. These schemes generally cover workers in the formal sector (public or private), although only urban employees are covered in China. Schemes generally impose contributions at a flat rate from the first currency unit of income earned up to a fixed income threshold, though a number of schemes have no upper threshold. China also sets a minimum income amount on which contributions are due, while Brazil imposes contributions at progressive rates rather than a flat rate. The highest total SSC rates are found in Brazil and China while the lowest rates are imposed in South Africa. The main features of the different schemes in each country are detailed below and in Table 3.
Brazil imposes employee and employer contributions for the INNS scheme that provides pension, sickness and maternity benefits. Employer contributions are also due for accident insurance, an employee indemnity fund and an educational fund. Employee contributions to the INNS scheme are imposed at between 8 and 11 percent depending on the level of income earned, with no contributions due on income above BRL 3 416.54 per month (239% of the AW).8 Employer INNS contributions are due at 20 percent on all income. Employer contributions for accident insurance range from 1-3 percent depending on industry, while contributions for the Employee Indemnity Guarantee Fund and Education Fund are 8 percent and 2.5 percent, respectively. An additional 3.3 percent employer contribution is also charged in relation to a number of miscellaneous programs.
China requires employee and employer contributions for pensions, medical insurance, unemployment insurance, and a housing fund. In general, only employer contributions are required for workplace injury and maternity insurance. However, as noted above, these schemes only apply in urban areas. The applicable rates and thresholds vary between cities, and in some cases between districts within cities. While employee pension contributions are 8 percent in all major cities, employer pension contributions range from 10 percent in Zhongshan, to 22 percent in central Shanghai. Employee medical insurance contributions are generally 2 percent in major cities, but employer contributions range from 2 percent to 12 percent. Employee and employer unemployment insurance contributions range from 0.1 percent to 1 percent, and from 0.2 percent to 2 percent, respectively. Employer injury insurance contributions range from 0.25 percent to 2 percent, while employer maternity insurance contributions range from 0 to 1 percent. The housing fund often has a more complicated rate structure with employee and employer rates ranging from 5 percent up to 25 percent. China applies both lower and upper income thresholds. These are generally calculated as 60 and 300 percent, respectively, of the social average wage in the particular city.
8
The lower threshold operates as a minimum amount on which contributions must be paid, even if actual income is below this amount. Note that Table 3 presents the applicable rates and thresholds for central Shanghai.
Table 3: Social Security Contribution Schemes in BIICS countries, 20101
Scheme Rate Lower threshold
(Shanghai) Employee Retirement Medical care Unemployement
India Employee Provident fund Health insurance
The “lower threshold”, in China, is a minimum income level on which contributions are due (even if actual income is below this level).
3
The “upper threshold”, for all countries, is the maximum amount of income on which the relevant contributions can be due (even if actual income is above this level).
Sources: see Annex 1.
India requires employee and employer contributions to both a pension scheme (the Employees’ Provident Fund) and a health insurance scheme. However, as with China, the coverage of both schemes is narrow. Employees working in a firm that employs more than 20 workers and earning less than INR 6 500 per month (127% of the AW) must join the Employees’ Provident Scheme. Those earning more than INR 6 500 are not compelled to join the scheme, but may opt to do so. Additionally, employees in firms with less than 20 employees may join the scheme with the approval of their employer. Employee and employer health insurance contributions are similarly only required in relation to employees in firms with more than 20 workers. Employee and employer contributions to the Employees’ Provident Fund are both set at 12 percent, while employee and employer health insurance contributions are 1.75 and 4.75 percent,
threshold of INR 78 000 (127% of the AW), and both employee and employer health insurance contributions are subject to an upper threshold of INR 90 000 (147% of the AW).
Indonesia imposes employee and employer contributions to a pension fund (the workers' old-age compensation fund), as well as employer contributions for health insurance. Contributions to the old-age compensation fund are 2 percent for employees and 3.7 percent for employers. Employer health insurance contributions are 3 percent for unmarried workers and 6 percent for married workers. These contributions are due on all income.
South Africa requires employee and employer contributions to the Unemployment Insurance Fund as well as imposing a Skills Development Levy on employers to fund education and training. All three contribution rates are 1 percent, with employee and employer contributions to the Unemployment Insurance Fund subject to an upper income threshold of ZAR 149 736 (110% of the AW).
2.3. Cash transfers
Brazil and South Africa both provide cash transfers dependant on income and family characteristics. In Brazil a cash benefit for families with children (Salário Família) is paid to most insured private sector workers. Domestic workers, casual workers, elected civil servants, and self-employed persons are not eligible to receive the benefit. The benefit amounts to: BRL 23.08 per month (1.6% of the AW) for each child if the insured's earnings do not exceed BRL 449.93 (31.5% of the AW); and BRL 16.26 (1.1% of the AW) per month if earnings are between BRL 449.93 and BRL 676.27 (31.5% and 47.3% of the AW). Employers pay the benefit directly to the worker and the total cost is reimbursed by the government.
For very low-income families Brazil also operates another conditional cash transfer program (Bolsa Familia). Payment is conditional on children being enrolled in school, and is only paid to families earning less than BRL 140 per month (9.8% of the AW). For eligible families, payments range from BRL 32 to BRL 306 per month (2.2% to 21.4% of the AW).
3. Modelling the tax burden on labour income
3.1. Methodology
This paper follows the OECD Taxing Wages methodology to model the taxes paid on (wage and salary) labour income in the BIICS countries.9 This approach uses the parameters of tax systems (and certain benefit schemes) to calculate average and marginal tax rates and tax wedges for eight hypothetical representative family types. These family types are defined in terms of wage income, marital status, and number of children. In order to best enable the international comparability of results, income levels are specified as a percentage of the average wage in the particular country.10 The eight family types are as
follows:
1. Single individual with no children earning 67% of the average wage;
2. Single individual with no children earning 100% of the average wage;
3. Single individual with no children earning 167% of the average wage;
4. Single parent with two children earning 67% of the average wage;
5. One-earner married couple with two children earning 100% of the average wage.
6. Two-earner married couple with two children, one earning 100% of the average wage and the other earning 33% of the average wage;
7. Two-earner married couple with two children, one earning 100% of the average wage and the other earning 67% of the average wage;
8. Two-earner married couple with no children, one earning 100% of the average wage and the other earning 33% of the average wage.
Workers in each family type are assumed to work full-time. PIT, employee SSC, employer SSC, payroll taxes, and cash transfers are modeled for each family type, subject to the requirement that they are generally applicable to at least one of the family types. Both central and sub-central level taxes are modeled.
In the calculation of PIT, standard tax reliefs are modelled, but non-standard reliefs that depend on actual expenditure, such as deductions for medical expenses or voluntary contributions to private pension plans, are not. As such, none of the reliefs in the 5th column of Table 1 are included in the calculations.
SSC are included in the calculations where they meet the OECD definition of a tax: a “compulsory unrequited payment to general government” (OECD, 2012c). In practice, “unrequited” is taken to mean that there is at least some element of redistribution associated with the contributions made. This includes
9
Note that the taxation of labour income earned by the self-employed is beyond the scope of the Taxing Wages models and of this paper.
10
all the schemes noted in Table 3 with the exception of the housing fund in China and both the provident fund and health insurance scheme in India. These omissions are discussed in more detail below in section 3.2.4. The inclusion of SSC in labour tax burden calculations acknowledges their similar impact on labour costs, welfare and work incentives as “pure taxes”.11 Payroll taxes are treated as employer SSC in the calculations.
Cash transfers included in the modelling are those paid by general government that are dependent on income, marital status and/or the presence/number of children, and, again, that are generally applicable to at least one of the representative family types. This includes the three schemes noted in the last column of Table 1. However, it excludes any out-of-work benefits (e.g. unemployment benefits) and other benefits with limited applicability (e.g. age or disability related benefits).
The key indicators calculated for each family type are the average and marginal tax wedges. The average tax wedge measures the wedge between the total labour cost faced by an employer and the take home pay received by the employee (as a proportion of the total labour cost). More precisely, it is calculated as follows:
personal income tax + employee SSC + employer SSC + payroll taxes – income/family-based cash transfers
gross wage income + employer SSC + payroll taxes
The marginal tax wedge makes the same calculation, but in relation to a one currency unit increase in gross wage income.12 The one exception is for a non-working second earner, in which case the marginal increase is assumed to be a move to part-time work earning 33 percent of the average wage.
3.2. Assumptions and limitations
The modelling is based on a number of assumptions and faces several limitations (largely due to data availability). These are discussed below.
3.2.1. Data sources
While this paper has followed the Taxing Wages modelling approach, the data collection process has been somewhat different to that used in developing and updating the OECD country models for the Taxing
11
It is important to note that the inclusion of SSC in a measure of the tax wedge is not without debate. Where there is no connection between the SSC paid and the expected future return to the worker then SSC are equivalent to a “pure” tax. However, if there is a fully actuarial link between SSC paid and the expected future return then they are more in the nature of compulsory savings or insurance (and hence not considered a tax under the Taxing Wages approach). As such, they may create very different behavioural responses than a “pure” tax. In practice, most SSC are likely to be somewhere between the two polar cases. SSC tend to have some link between payment and return, but will also likely have a substantive redistributive element to them as well – making them closer in nature to a “pure” tax. An alternative to the Taxing Wages approach would be to attempt to separate out the tax and compulsory savings components. Disney (2004), for example, attempts to do this for pension contributions. It is also arguable that certain non-tax compulsory payments (NTCPs) – for example, compulsory payments to private sector pension schemes – should be included in a measure of the tax wedge as these may also generate similar behavioural responses as taxes. OECD (2010a) discusses NTCPs in more detail and presents compulsory payment indicators that include both taxes and NTCPs.
12
Wages publication. For the latter, the underlying tax information is provided, and modelling results are confirmed, by official member country delegates to the Working Party on Tax Policy Analysis and Tax Statistics of the OECD’s Committee on Fiscal Affairs. In contrast, we have used various publically available data sources to gather the necessary information on tax systems in the BIICS countries (see Annex 1 for more detail). Furthermore, the BIICS country results have not been checked or approved by officials from the respective countries. As such, some caution must be taken regarding the absolute accuracy of the modelling results. In some cases, the absence of information has required assumptions to be made regarding certain tax rules. These assumptions are outlined below.
3.2.2. Calculation of the average wage
Ideally, to aid cross-country comparison of results, the average wage for each of the BIICS countries would be calculated in a consistent manor and follow the approach taken in the OECD Taxing Wages
publication. In Taxing Wages, the average wage is calculated for adult full-time manual and non-manual workers in industry sectors B-N as defined in the International Standard Industrial Classification of All Economic Activities (ISIC), revision 4 (or the roughly equivalent sectors C-K of ISIC rev 3.1). This information was not available for the BIICS countries. Instead, the closest average wage figures available have been used. Annex 2 details the calculation of the average wage in each of the BIICS countries and the relevant data sources. In general, average wage figures are based on either all industry sectors or just the manufacturing sector, rather than on sectors B-N of ISIC rev. 4. These differences should be borne in mind when comparing results across the BIICS countries, and particularly when comparing results with OECD countries.
3.2.3. State and local taxes
As noted earlier, some taxes in India and China vary at the sub-central level. As a result, we have selected a representative city/region on which to base the tax calculations.13 In India, the only tax that varies at a sub-central level is the State Professional Tax. While this varies considerably across states, it generally only applies at relatively high income levels, and, given the low average wage in India, it has no actual impact on the results for the eight family types presented in this paper. Nevertheless, the State Provincial Tax is still modeled, with New Delhi as the representative state.
In China, social security contributions vary considerably across the country. Furthermore, while they are payable in all cities, they are not generally payable in rural areas. For the purposes of the modelling, we assume the worker lives in a city rather than a rural area, with central Shanghai chosen as the representative city.
3.2.4. SSC
Information limitations require several assumptions to be made in order to model SSC in China and India. In China, employee and employer housing fund contributions accrue directly to an individual account (Livermore, 2010). On this basis we make the assumption that housing contributions are fully requited, and hence do not constitute taxes and as a result are not modeled. This is not an insignificant assumption as
13
employee and employer contribution rates are seven percent in Shanghai (and even higher in some other cities). Furthermore, while not a tax according to the OECD definition, these payments still amount to an additional cost of labour to employers, and may still create some disincentive for employees to work despite the actuarial return. Additionally, we have assumed that the upper and lower contribution thresholds for all social security schemes are the same as that applied for the pension scheme.
In contrast to the housing fund, we have assumed that contributions to the pension scheme in China are not fully requited on the basis that there is a tier one component to the pension where payment is not related to contributions – i.e. it is redistributive (OECD, 2010b).
As was noted earlier, liability to health insurance and Employee Provident Fund contributions in India is restricted to employees in firms that have 20 or more employees. As most firms in India appear to have less than 20 workers,14 we exclude these contributions from the modelling on the basis that they are not representative of the contributions paid by the majority of workers. This has a significant impact on the results for India as these contributions are relatively substantial and the PIT burden for all eight family types is zero. As such, we also present results for India for a worker that is liable to these contributions.
3.2.5 Age of children
The “Salário Familia” child benefit in Brazil is paid to working parents who have a child under 14 years of age. For the purpose of the modelling, we assume that any children are under 14 years of age and hence the family is eligible for the child benefit if its income is below the relevant threshold.
3.2.6 Additional modelling assumptions
In Brazil, where individuals deriving only employment income may choose between claiming deductions individually, or instead claiming a single “notional” allowance, we model both options and assume the worker will chose the option giving the greater tax benefit.
Finally, in Indonesia, we assume that the worker does incur work related expenses equal to at least five percent of income, and therefore we model the maximum available deduction for work related expenses.
4. Results
The tax wedge results for the BIICS countries are presented in two parts. First, we consider the makeup of the tax wedge, focusing on the single individual case. We then present the overall tax wedge results for all eight family types. Comparison with the results for OECD countries is also provided. While presentation of the modelling results focuses on the tax wedge, more detailed numerical results are also presented for each country in Annex 3.
Table 4 presents the average and marginal tax wedges for a single individual earning the average wage in each of the BIICS countries, as well as their breakdowns into personal income tax, employee SSC and employer SSC. In addition to presenting the standard modelling results for India, we also present results for the minority scenario where a worker is employed by a business with more than 20 employees and is therefore liable to SSC (denoted “India (SSC)” in Table 4).
14
Table 4: Components of the tax wedge, 2010
Single individual with no children earning 100% of the average wage
Average Marginal
Income
tax Employee SSC Employer SSC wedge Tax Income tax Employee SSC Employer SSC wedge Tax
Brazil 0 6.6 27.0 33.6 0 6.6 27.0 33.6
China 0.3 8.0 27.0 35.4 3.2 8.0 27.0 38.3
India 0 0 0 0 0 0 0 0
India (SSC)1 0 11.8 14.3 26.1 0 11.8 14.3 26.1
Indonesia2 0 1.9 6.3 8.2 0 1.9 6.3 8.2
South Africa 10.8 1.0 2.0 13.7 24.5 1.0 2.0 27.5
BIICS3
2.2 3.5 12.5 18.2 5.5 3.5 12.5 21.5
OECD 12.2 8.5 14.2 34.9 21.5 8.0 14.1 43.5
1
Results apply only for the minority case where the employee works in a firm with more than 20 employees.
2
Results for Indonesia are for 2009.
3
The BIICS average is calculated using the standard “India” results, not “India (SSC)”.
Looking first at the average tax wedge, China (recall that calculations are based on central Shanghai) and then Brazil impose the largest tax burdens, followed by South Africa and Indonesia, while India imposes no tax on a single individual earning the average wage. However, for the minority of Indian workers that are subject to SSC, the average tax wedge falls in the middle of the results for the other BIICS countries.
Looking at the components of the average tax wedges, the striking result is that most countries impose little or no income tax burden on a single individual earning the average wage. Only South Africa imposes a significant PIT burden (10.8 percent of total labour costs), with China (at 0.3 percent of total labour costs) the only other country to impose any PIT at that earnings level. In contrast, all countries except India impose employee and employer SSC – with employer contributions generally making up the vast majority of the total tax wedge. Only in South Africa is PIT a larger component of the total tax wedge than employer SSC. For the minority case in India, employer contributions are also greater than employee contributions, but the difference is relatively smaller than in the other countries.
Turning to the marginal tax wedge, this is greatest in China (Shanghai), followed by Brazil and South Africa, with Indonesia relatively low and India again zero. Looking at the components, the marginal and average PIT, employee SSC, and employer SSC wedges are identical in Brazil, Indonesia and India (minority case). This is due to the absence of any PIT liability, the flat-rate nature of the SSC schedules, and the absence of any upper or lower SSC thresholds. In contrast, the marginal PIT wedges in China and South Africa are higher than the corresponding average wedges due to the presence of tax credits (South Africa), allowances (China) and progressive PIT schedules (both). The overall marginal tax wedges in these two countries are consequently also higher than the respective average tax wedges.
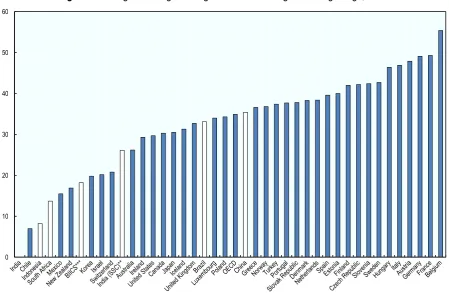
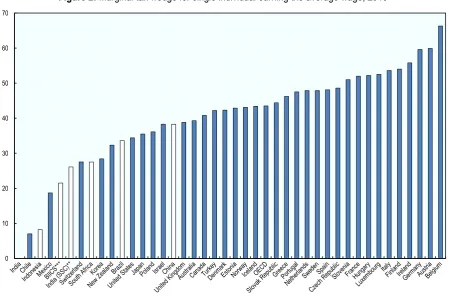
burdens being significantly below the OECD average. Similarly, with the possible exception of China, overall marginal tax burdens are also significantly below the OECD average. This is illustrated in more detail in Figures 1 and 2 below which present the average and marginal tax wedges, respectively, for both BIICS and OECD countries, ranked from lowest to highest.
Figures 1 and 2 show the large variation in tax burdens across OECD and BIICS countries, with average wedges ranging from zero (India) to 55 percent (Belgium), and marginal wedges ranging from zero to 66 percent (again, in India and Belgium). In terms of average tax wedges, Brazil and China (Shanghai) stand out from the other BIICS countries, sitting around the middle of the overall range of countries. Meanwhile, their marginal tax wedges place them slightly lower. In contrast, India, Indonesia and South Africa make up three of the bottom four countries in terms of average tax wedges, and three of the bottom six in terms of marginal tax wedges. Recall also, that as rural workers in China pay no SSC, their tax wedge would also fall at the bottom end of Figures 1 and 2.
Figure 1: Average tax wedge for single individual earning the average wage, 2010*
* 2009 for Indonesia.
** Results apply only for the minority case where the employee works in a firm with more than 20 employees. *** The BIICS average is calculated using the standard “India” results, not “India (SSC)”.
Figure 2: Marginal tax wedge for single individual earning the average wage, 2010*
* 2009 for Indonesia.
** Results apply only for the minority case where the employee works in a firm with more than 20 employees. *** The BIICS average is calculated using the standard “India” results, not “India (SSC)”.
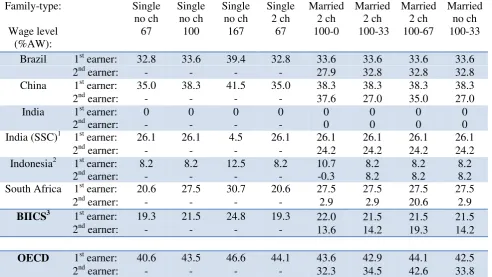
The overall average tax wedge results for all eight hypothetical family types for the BIICS countries are shown in Table 5. The composition of these tax wedges is generally similar to that for the single individual.
Table 5: Average tax wedge for 8 family types, 2010
Family-type:
Results apply only for the minority case where the employee works in a firm with more than 20 employees.
2
Results for Indonesia are for 2009.
Table 5 shows that average tax wedges generally increase as the income level increases. This is clearly illustrated by comparing the results for the first three family types (single individual with no children earning 67, 100, and 167 percent of the average wage), and is not unexpected given the progressive nature of PIT schedules in all countries. That said, in Brazil and Indonesia it is only the highest income taxpayers (earning 167 percent of the average wage) that face any income tax liability. The two-rate employee SSC schedule also contributes to the progressivity in Brazil. India is the clear exception, where income tax is not due even at earnings of 167 percent of the average wage. Additionally, in the minority case in India
(“India (SSC)”) the average tax wedge is actually lower for a high-income worker (earning 167 percent of the average wage) than for a low- or middle-income worker (earning 67 or 100 percent of the average wage). This regressivity is due to the design of the Employee Provident Fund for which membership is voluntary for workers that earn more than INR 78 000. As such, the modelling assumes that no contributions are made by these workers.
The results also show that, in general, the presence of children does not lower the average tax wedge in the BIICS countries. For example, in all five countries a single individual without children (earning 67 percent of the average wage) faces the same tax wedge as a single parent with two children (earning the same level of income). Similarly, a two-earner family without children (earning 100 and 33 percent of the average wage) faces the same tax wedge as a two-earner family with 2 children (again, earning the same income) in four of the five countries. The exception is Brazil, where the second earner (earning 33 percent of the average wage) receives the “Salário Familia” child benefit, which reduces the tax wedge slightly. As this benefit is targeted at low income levels, none of the other family types with children are eligible for this benefit. As discussed earlier, Brazil also provides another conditional cash transfer (the “Bolsa Familia”) and a dependent child income tax allowance. However, neither affects the results in Table 5: the Bolsa Familia is targeted at even lower income families than the Salário Familia; while, there is no income tax due on any of the family types with children against which to use the dependent child income tax allowance. Similarly, Indonesia’s dependants allowance does not affect the results as no income tax is due at the relevant income levels.
Additionally, average tax wedges are also generally the same when comparing a single individual without children (earning 100 percent of the average wage) and a one-earner family with children (earning the same level of income), despite both the difference in marital status and the presence of children. The one exception is Indonesia, where the one-earner family in fact faces a higher tax wedge than the single individual without children. This inequitable result is unrelated to the presence of children. Instead it occurs because the sole earner is liable to employer SSC at the married rate of six percent on all their income, whereas a single individual (or each earner in a two-earner family) pays at the individual rate of three percent.
received by these single parents as well as the value of any applicable non-wastable tax credits exceed the sum of the tax and the total SSC due.
Turning now to the marginal tax wedge results, these are presented in Table 6. Results are provided for both primary and second earners where relevant. The marginal tax wedge results follow a similar pattern to the average tax wedge results in the BIICS countries. They increase with income, with the exception, again, of the minority case in India (“India (SSC)”) due to the design of the Employee Provident Fund; and marginal wedges are also generally the same with and without children. Second earner marginal wedges are generally lower than primary earner marginal wedges due to the lower income levels earned by the second earners. This is particularly the case in South Africa, where the lower level of income of the second earner eliminates any income tax liability.
Table 6: Marginal tax wedge for 8 family types, 2010
Family-type:
Results apply only for the minority case where the employee works in a firm with more than 20 employees.
2
Results for Indonesia are for 2009.
3The BIICS average is calculated using the standard “India” results, not “India (SSC)”.
As with the average tax wedge, the primary earner marginal tax wedge for a one-earner family with two children in Indonesia is higher than that faced by a single individual earning the same income. Meanwhile, the second earner marginal wedge for the same family type is negative. This is once again due to the different SSC rates applicable to single and married workers. The negative second earner marginal wedge means the family will actually face a lower tax burden if the second earner moves into employment earning 33 percent of the average wage. This is because entering employment will reduce the SSC due on the
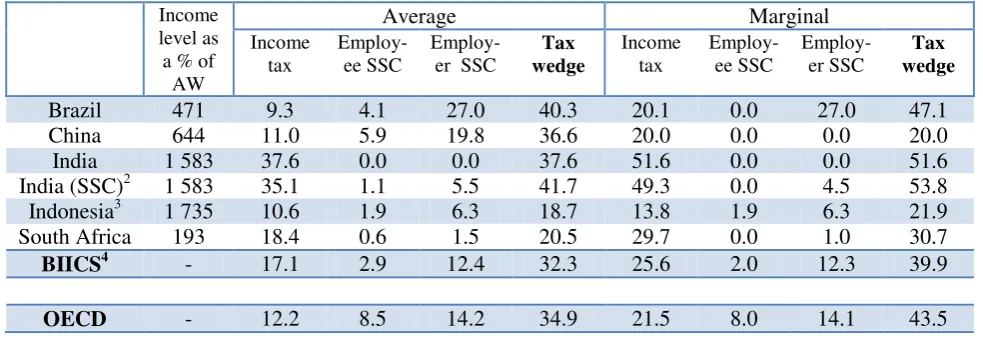
Compared to the OECD averages, the marginal tax wedges in China (Shanghai) and Brazil are generally slightly lower, whereas they are generally far lower in India, Indonesia and South Africa. Furthermore, marginal tax wedges tend to be higher for single parents than single individuals in OECD countries. This is largely due to the income-based withdrawal of cash transfers and tax credits in many OECD countries. In contrast, there is no difference in marginal tax wedges between single parents and single individuals in those seen in OECD countries. To illustrate this, Table 7 shows the average and marginal tax wedge for a single individual in the BIICS countries calculated at a fixed income level equal to the average wage in the US in 2010 (USD 45 688). To account for differences in purchasing power between the countries, this income level is converted into national currencies using PPP conversion rates. The new income levels range from 193 percent of the actual average wage in South Africa, to 1 735 percent of the actual average wage in Indonesia. Table 7 also presents a breakdown of the wedges into their components. For comparison, the OECD averages for a single individual earning the average wage are also presented.
Table 7: Components of the tax wedge at earnings equal to (PPP adjusted) US average wage, 2010. Single individual with no children1
Income currencies using PPP conversion rates. PPP conversion rates measure the number of units of a country's currency that are needed to buy the same bundle of goods in the domestic market as could be bought with one US dollar in the United States. PPP
conversion rates are taken from the World Bank’s International Comparison Programme (see
http://data.worldbank.org/indicator/PA.NUS.PRVT.PP). World Bank (2005) discusses the methodology for calculating the PPP conversion rates.
2
Results apply only for the minority case where the employee works in a firm with more than 20 employees.
3
Results for Indonesia are for 2009.
4The BIICS average is calculated using the standard “India” results, not “India (SSC)”.
Looking first at the average tax wedge results, we see these are higher than those previously calculated at
above the OECD average. In contrast, the average tax wedges in Indonesia and South Africa, while higher than before, remain well below the OECD average. Looking at the components of the average wedge, we see that SSC are very substantial in Brazil and China, but considerably lower in the remaining countries. In contrast, PIT tends to be higher in India and South Africa than the other countries.
Turning to the marginal tax wedge results, these are now also higher than those calculated at the countries’ actual average wages in Brazil, India and Indonesia, but lower in China (Shanghai) and South Africa. The marginal wedges for Brazil and India are now higher than the OECD average. In contrast, marginal wedges are far lower than the OECD average in China, Indonesia and South Africa. The marginal wedge has fallen substantially in China from that calculated at the actual average wage because the income level is now above the contribution ceiling for employee and employer SSC. In South Africa, the marginal wedge has fallen slightly because income is now above the ceiling for unemployment insurance contributions, but has not yet reached the threshold for a higher marginal PIT rate.
5. Conclusions
This paper has examined the taxation of labour income in five emerging economies: Brazil, China, India, Indonesia and South Africa. Following the OECD Taxing Wages methodology, we have modeled the tax burden on labour income in each country, presenting both average and marginal tax wedges for eight different representative family types that vary by income level, marital status and number of children.
For a single individual earning the average wage, average tax wedges range from zero percent in India to 35.4 percent in China (Shanghai), while marginal wedges range from zero percent, again in India, to 38.3 percent in China. Results for other family types show, as would be expected, that tax wedges increase with the level of income. Surprisingly though, the presence of children does not generally reduce average tax wedges – due to either the absence of child-related tax reliefs and cash transfers, or the ineffectiveness of such (wasteable) tax reliefs when no income tax is due.
When compared to OECD countries, we see that average and marginal tax wedges in Brazil and China (Shanghai) are similar in size to those of many OECD countries (although rates in rural China are vastly lower than in cities such as Shanghai). In contrast, India, Indonesia and South Africa impose very low average and marginal tax wedges compared to the vast majority of OECD countries. Indeed, in these latter three countries only higher income workers face any substantial tax burden on labour income. Additional tax wedge results at a fixed higher income level suggest that the low tax wedges in India are predominantly
driven by India’s very low wage levels; whereas the low tax wedges in Indonesia and South Africa are also
partially driven by the underlying tax structure.
The tax mix also varies across the BIICS countries with SSC making up the bulk of the tax wedges in all countries except South Africa. Nevertheless, in India (excluding the very small part of the workforce that work for large employers), Indonesia and South Africa, SSC still contributes less to the tax wedge than on average in OECD countries. In China, while Shanghai – on which the modelling is based – does impose an SSC burden that is above the OECD average, several other urban areas impose lower SSC burdens, and in rural areas there is no SSC levied.
thereby weakening the international comparability of the results. Additionally, some limited availability of information on tax parameters has meant that a number of assumptions were necessary in the modelling which, along with the general reliance on publically available data sources, creates the risk of some error in the modelling results.
Nevertheless, the results suggest that, in the long-term, reforms will be necessary in most of the BIICS countries if their labour income bases are to significantly contribute to funding the substantial increases in public expenditure, particularly on infrastructure and social insurance, which will inevitably come as these countries continue to grow. In particular, even though PIT burdens will increase to an extent automatically as wages increase (as long as allowances and thresholds are not indexed), the PIT schedules in Indonesia and South Africa will most likely need to be reformed if these countries wish to impose tax burdens similar to the OECD average at comparable income levels. Furthermore, the ability to use PIT for redistributive purposes will increase as its coverage and overall level increases. Of course, the appropriate balance between PIT and other tax bases would need to be considered when determining the extent of such PIT increases. Additionally, if social security contributions are to be used as the main source of funding for social security systems, SSC rates and/or coverage will likely need to increase in all the BIICS countries in the long-term, with the possible exception of Brazil, if social insurance systems are to develop in the same way as has occurred in most OECD countries.
REFERENCES
Badan Pusat Statistik Republik Indonesia (2012) www.bps.go.id/
Brazilian Institute of Geography and Statistics (2011) www.ibge.gov.br/english/
Deloitte (2010) “International Tax and Business Guide”, Deloitte Touche Tohmatsu
Directorate-General of Budget, Accounting and Statistics, Peoples’ Republic of China (2011) “Statistical Yearbook of the Republic of China 2010”, The Chinese Statistical Association.
Disney, R. (2004), “Are Contributions to Public Pension Programmes a Tax on Employment?”, Economic
Policy, Vol. 19, No. 39, pp. 269-311.
International Bureau of Fiscal Documentation (2010a) “Global Corporate Tax Handbook – 2010”, International Bureau of Fiscal Documentation, Amsterdam.
International Bureau of Fiscal Documentation (2010b) “Global Individual Tax Handbook – 2010”, International Bureau of Fiscal Documentation, Amsterdam.
International Labour Organisation (2010) “World Social Security Report 2010/11. Providing coverage in times of crisis and beyond”, International Labour Office, Geneva.
International Labour Organisation (2012) LABORSTA database, http://laborsta.ilo.org/default.html
Income Tax Department of India (2008) “Taxation of Salaried Employees, Pensioners and Senior Citizens”, Tax Payers Information Series 31, New Delhi.
International Social Security Association (2010) “Social Security Programs Throughout the World”, US Social Security Administration in collaboration with the International Social Security Association (ISSA), Washington.
KPMG (2010) “Individual Income Tax and Social Security Rate Survey 2010”, KPMG International.
Lin, S. (2009) “The Rise and fall of China government revenue”, EAI Working Paper No. 150.
Livermore, A. (2010) “Employment Overheads in China’s Social Security System”, China Briefing,
Volume 11 (7). Dezan Shira and Associates.
Ministry of Finance of India (2011) “Indian Public Finance Statistics 2010-2011”, Government of India.
National Bureau of Statistics of the Peoples’ Republic of China (2011) “Statistical Yearbook of China, 1991-2008”, China Statistical Publishing House, Beijing, China.
National Treasury and the South African Revenue Service (2009) “2009 Tax Statistics”, National Treasury and SARS.
National Treasury and the South African Revenue Service (2011) “2011 Tax Statistics”, National Treasury and SARS.
OECD (2007) “OECD Economic Surveys: India 2007”, OECD, Paris.
OECD (2009) “OECD Economic Surveys: Brazil 2009”, OECD, Paris.
OECD (2010a) “Taxing Wages 2009”, OECD, Paris.
OECD (2010b) “OECD Economic Survey of China”, OECD, Paris.
OECD (2012a) “Taxing Wages 2011”, OECD, Paris.
OECD (2012b) “OECD Economic Surveys: Indonesia 2012”, OECD, Paris.
OECD (2012c) “Revenue Statistics 1965-2011”, OECD, Paris.
OECD (2012) OECD.stat database, www.stats.oecd.org
OECD/ECLAC/CIAT (2011) “Revenue Statistics in Latin America”, OECD, Paris.
PFK (2010) “Worldwide Tax Guide 2010”, PFK International Limited, April.
Piketty, T. and N. Qian (2009) “Income Inequality and Progressive Income Taxation in China and India, 1986-2015”, American Economic Journal: Applied Economics, 1(2): 53–63.
PricewaterhouseCoopers (2010) “Indonesian Pocket Tax Book 2010”, PWC Indonesia.
South African Revenue Service (2009) “Taxation in South Africa 2009/2010”, South African Revenue Service, www.sars.gov.za
Statistics South Africa (2010) “Quarterly Employment Statistics 2010”, www.statssa.gov.za
World Bank (2005) “Global Purchasing Power Parities and Real Expenditures: 2005 International Comparison Program”, World Bank, Washington, D.C.
Annex 1: Data sources
The tax rules and parameters presented in this paper (and on which the modelling results presented in the paper are based) were obtained from the following publically available data sources: Deloitte (2010), International Bureau of Fiscal Documentation (2010a, 2010b), International Labour Organisation (2010); Income Tax Department of India (2008); KPMG (2010); Ministry of Finance of Brazil (2008); OECD (2010b, 2009); PFK (2010); PricewaterhouseCoopers (2010); South African Revenue Service (2009); and International Social Security Association (2010).
Annex 2: Calculation of the average wage
The average wage (AW) estimates used in the paper for the five BIICS countries depart from the definition used in the OECD Taxing Wages publication. In Taxing Wages, the average wage is calculated as the average annual gross earnings for male and female adult full-time manual and non-manual workers in industry sectors B-N as defined in the International Standard Industrial Classification of All Economic Activities (ISIC), revision 4 (or the roughly equivalent sectors C-K of ISIC rev 3.1). This information was not available for the BIICS countries. Instead, the closest average wage figures available have been used:
Brazil: the Brazilian Institute of Geography and Statistics (2011) reports for 2010 a monthly AW of BRL 1 430.40. This corresponds to an annual AW of BRL 17 164.80. The data covers all economic sectors, and both men and women.
China: the National Bureau of Statistics of China (2009) reports for 2008 a monthly AW of CNY 2 435.75. This corresponds to an inflation-adjusted annual AW of CNY 29 924 for 2010. The data covers all economic sectors, and both men and women.
India: the International Labor Organization (2012) reports for 2006 a monthly AW of INR 3 525.90. This corresponds to an inflation-adjusted annual AW of INR 61 263 for 2010. The data covers only the manufacturing sector, and covers both men and women.
Indonesia: the Badan Pusat Statistik Republik Indonesia (2012) estimates for 2009 a monthly AW of IDR 1 160 100. This corresponds to an annual AW of IDR 13 921 200. The data covers only the manufacturing sector, and covers both men and women.
Annex 3: The tax/benefit position of workers in the BIICS countries – detailed numerical results
Brazil 2010
The tax/benefit position of single persons
Wage level (per cent of AW) 67 100 167 67 Number of children none none none 2
1. Gross w age earnings 11443 17165 28608 11443
2. Standard tax allow ances
Basic allow ance 2289 3433 5722 4532
Married or head of family Dependent children
Deduction for social security contributions and income taxes
Work-related expenses 0 0 0 0
Other
Total 2289 3433 5722 4532
3. Tax credits or cash transfers included in taxable incom e 0 0 0 0
4. Central governm ent taxable incom e (1 - 2 + 3) 9155 13732 22886 6911
5. Central governm ent incom e tax liability (exclusive of tax credits) 0 0 367 0
6. Tax credits
Basic credit
Married or head of family
Children 0 0 0 0
Other
Total 0 0 0 0
7. Central governm ent incom e tax finally paid (5-6) 0 0 367 0
8. State and local taxes 0 0 0 0
9. Em ployees' com pulsory social security contributions
Gross earnings 915 1545 3147 915
Taxable income
Total 915 1545 3147 915
10. Total paym ents to general governm ent (7 + 8 + 9) 915 1545 3514 915
11. Cash transfers from general governm ent For head of family
For tw o children 0 0 0 0
Total 0 0 0 0
12. Take-hom e pay (1-10+11) 10528 15620 25094 10528
13. Em ployer's com pulsory social security contributions 4234 6351 10585 4234
14. Average rates
Income tax 0.0% 0.0% 1.3% 0.0%
Employees' social security contributions 8.0% 9.0% 11.0% 8.0%
Total payments less cash transfers 8.0% 9.0% 12.3% 8.0%
Total tax w edge including employer's social security contributions 32.8% 33.6% 36.0% 32.8%
15. Marginal rates
Total payments less cash transfers: Principal earner 8.0% 9.0% 17.0% 8.0%
Total payments less cash transfers: Spouse n.a. n.a. n.a. n.a.
Total tax w edge: Principal earner 32.8% 33.6% 39.4% 32.8%
Brazil
2010
The tax/benefit position of married couples
Wage level (per cent of AW) 100-0 100-33 100-67 100-33
Number of children 2 2 2 none
1. Gross w age earnings 17165 22886 28608 22886
2. Standard tax allow ances
Basic allow ance 6970 6306 7450 4577
Married or head of family Dependent children
Deduction for social security contributions and income taxes
Work-related expenses 0 0 0 0
Other
Total 6970 6306 7450 4577
3. Tax credits or cash transfers included in taxable incom e 0 0 0 0
4. Central governm ent taxable incom e (1 - 2 + 3) 10195 16581 21158 18309
5. Central governm ent incom e tax liability (exclusive of tax credits) 0 0 0 0
6. Tax credits
Basic credit
Married or head of family
Children 0 0 0 0
Other
Total 0 0 0 0
7. Central governm ent incom e tax finally paid (5-6) 0 0 0 0
8. State and local taxes 0 0 0 0
9. Em ployees' com pulsory social security contributions
Gross earnings 1545 2003 2460 2003
Taxable income
Total 1545 2003 2460 2003
10. Total paym ents to general governm ent (7 + 8 + 9) 1545 2003 2460 2003
11. Cash transfers from general governm ent For head of family
For tw o children 0 390 0 0
Total 0 390 0 0
12. Take-hom e pay (1-10+11) 15620 21274 26148 20884
13. Em ployer's com pulsory social security contributions 6351 8468 10585 8468
14. Average rates
Income tax 0.0% 0.0% 0.0% 0.0%
Employees' social security contributions 9.0% 8.8% 8.6% 8.8%
Total payments less cash transfers 9.0% 7.0% 8.6% 8.8%
Total tax w edge including employer's social security contributions 33.6% 32.1% 33.3% 33.4%
15. Marginal rates
Total payments less cash transfers: Principal earner 9.0% 9.0% 9.0% 9.0%
Total payments less cash transfers: Spouse 1.2% 8.0% 8.0% 8.0%
Total tax w edge: Principal earner 33.6% 33.6% 33.6% 33.6%
China
2010
The tax/benefit position of single persons
Wage level (per cent of AW) 67 100 167 67 Number of children none none none 2
1. Gross w age earnings 19949 29924 49874 19949
2. Standard tax allow ances
Basic allow ance 26194 27292 29486 26194
Married or head of family Dependent children
Deduction for social security contributions and income taxes
Work-related expenses 0 0 0 0
Other
Total 26194 27292 29486 26194
3. Tax credits or cash transfers included in taxable incom e 0 0 0 0
4. Central governm ent taxable incom e (1 - 2 + 3) 0 2633 20388 0
5. Central governm ent incom e tax liability (exclusive of tax credits) 0 132 1739 0
6. Tax credits
Basic credit
Married or head of family
Children 0 0 0 0
Other
Total 0 0 0 0
7. Central governm ent incom e tax finally paid (5-6) 0 132 1739 0
8. State and local taxes 0 0 0 0
9. Em ployees' com pulsory social security contributions
Gross earnings 2194 3292 5486 2194
Taxable income
Total 2194 3292 5486 2194
10. Total paym ents to general governm ent (7 + 8 + 9) 2194 3423 7225 2194
11. Cash transfers from general governm ent
For head of family
For tw o children 0 0 0 0
Total 0 0 0 0
12. Take-hom e pay (1-10+11) 17755 26501 42649 17755
13. Em ployer's com pulsory social security contributions 7381 11072 18453 7381
14. Average rates
Income tax 0.0% 0.4% 3.5% 0.0%
Employees' social security contributions 11.0% 11.0% 11.0% 11.0%
Total payments less cash transfers 11.0% 11.4% 14.5% 11.0%
Total tax w edge including employer's social security contributions 35.0% 35.4% 37.6% 35.0%
15. Marginal rates
Total payments less cash transfers: Principal earner 11.0% 15.4% 19.9% 11.0%
Total payments less cash transfers: Spouse n.a. n.a. n.a. n.a.
Total tax w edge: Principal earner 35.0% 38.3% 41.5% 35.0%