101
DEVELOPMENT OF TUNA FISHERIES MANAGEMENT STRATEGIES
FOR THE SOUTHERN COAST OF JAVA: AN APPLICATION OF
INTERPRETATIVE STRUCTURAL MODELING
Tri Wiji Nurani1), John Haluan1), Ernani Lubis1), Sudirman Saad2), and Ririn Irnawati3) 1) Lecturer in Faculty of Fisheries and Marine Science, Bogor Agricultural University, Bogor
2) Secretary of the Directorate General of Coastal and Small Island, Ministry of Marine Affairs and Fisheries 3) Graduate Student on System and Modeling of the Marine Fisheries, Bogor Agricultural University, Bogor
Received November 30-2009; Received in revised form August 12-2010; Accepted December 2-2010
ABSTRACT
Territorial waters of South Java is part of fisheries management zone of Indian Ocean Fisheries, has a potential tuna fish resources. The purpose of this research was to formulate strategy for the efficacy of model implementation of tuna fisheries development in South Coast of Java. Interpretative structural modeling technique was used the study. The method was considered a technique of strategic planning of which describes comprehensively condition of the system. Result showed that there were seven element of system require for succeeding implementation of model. The seven element of system and their key element are affected society sector, tuna entrepreneur, required factor, the availability of tuna resources and the availability of data and information, the main constraint of program development, high gasoline price, limited of financial capital and low priority of development fund, the main purpose of program: exploiting optimization of tuna resources; the indicator of the efficacy program: increasing the earn of tuna fishery and improvement of labor absorption; the activity needed to execute the program: making plan work activity; and institution in concerned for the efficacy program: Ministry of Marine Affairs and Fisheries.
KEYWORDS: fisheries management, interpretative structural modeling, tuna, South Coast of Java
Development of Tuna Fisheries ….. of Interpretative Structural Modeling (Nurani, T.W., et al.)
__________________ Corresponding author:
Jl. Agatis, Kampus Institut Pertanian Bogor Darmaga, Bogor-16680 INTRODUCTION
South Java territorial waters is part of fisheries management zone of Indian Ocean with potential tuna
resources potency, especially bigeye tuna (Thunnus
obesus) and yellowfin tuna (Thunnus albacares). The
potency of tuna resources in this territorial is not yet determined. The Indian Ocean Tuna Commission Working Party on Tropical Tuna (2009) described that catch rate big eye tuna in Indian Ocean continuously decreased from around 9,0 in 1960 to 3,2 in 2002 when it has increased to about 4,4; about the same level as that in the late 1990s, decreased to 2,3 in 2003 and increased to 3,0 in 2004. Meanwhile catch per unit of effort yellowfin tuna continuously decreased from around 28,7 in 1960 to 10,5 in 1972, and was kept at approximately the same level until 1988, thereafter it declined to about 4,5 in 1994 and has remained at his low level with fluctuations between 3,3 and 4,6 until 2006, was much lower 3,0 in 2007
(http://www. Iotc.org/files/proceedings/2009/wptt/IOTC). It seems that tuna fisheries in Indian Ocean is on fully exploited. Because of that, development of tuna fisheries in South Coast of Java should be more
emphasize to management of tuna fisheries according to sustainability.
Nurani et al. (2008) developed a SIMPENA model
ol.17 No. 2 December 201
1 :
BUSINESS Submodel
Tuna fisheries business Unit: long line
Scale of business: industry
Potency of tuna resources JTB: 80% x potency
Business technique aspect Availability of input production Optimality of production Handling: % export quality Market: export
Financial aspect
Profit business: NPV, B/C, IRR
System dynamic model input: technical aspect business financial aspect
output: profit retribution require of labor
require input production
INSTITUTION Submodel
Policy: Institution: Legal structure Performance of Legal mandate policy, social, Legal enforcement economic,
egal and, technology
Regulation: Effectiveness institution:
international planning national organization local controlling
evaluation
Management Management
To require To require
To support To support
Contribute according to
Increase profit business
Increase income and fisherman prosperity Increase opportunity for labor
Increase foreign earning Development economic region
Management: Central Government
Strategic policy: strength, weakness, opportunities, threats Model implementation: interpretative structural modeling
PORT Submodel
Location of f ishing port:
connection withfishing ground technical aspect
connection with market
Fishing port to support tuna f isheries business:
International standard
Supported to f acility and service Availability of tuna landing center Availability of input production
Figure 1. Tuna fisheries development model in South Coast of Java (Nurani et al., 2008).
101-1
1
103 Development of Tuna Fisheries ….. of Interpretative Structural Modeling (Nurani, T.W., et al.)
As previously mentioned, Simpena model was
designed for development of tuna fisheries in South Java territorial water. The benefit of model will be realized in the real system. Many factors including system will affect to the efficacy of applying model. Suitable strategy is required to formulate by studying comprehensive factor that will effect to the efficacy of applying model. One of the techniques to describe the complex things of system is interpretative structural modeling technique.
Interpretative structural modeling is a descriptive effective modeling for strategic long range planning. Strategic planning includes system totality which can’t be analyzed partly, but should comprehensively. Interpretative structural modeling technique analyzed the element of system, and describe in graph form direct relation between element and hierarchy. Data and information which available in strategic planning, usually predominated by data and information which qualitative and normative characters (Eriyatno, 2003; Marimin, 2004).
Interpretative structural modeling technique was a group learning process where the structural models are result for describing the complex things of system. Model is designed through pattern which is carefully designed use graph and sentence. The method gives perfect environment to enrich and enlarge description on complex system construction. (Eriyatno, 2003; Marimin, 2004; Gorvett & Liu, 2007).
Interpretative structural modeling technique has used in many study. Some studied are the study of
crumb rubber repaired agro industry (Utomo et al.,
2008), the decision making study of forest ecosystem
management (Liu et al., 2009), the study of vendor
selection (Mandal & Deshmukh, 1994), group decision
making (Balanos et al., 2005), and study of food
standard accomplishment condition (Sagheer et al.,
2009).
The objective of the research is to formulate suitable strategy in applying development model of tuna fisheries in South Coast of Java using interpretative structural modeling technique.
MATERIALS AND METHODS
This paper was a part of research result for development of fisheries in South Java territorial waters. The research of fisheries activity was conducted during July 2005 until July 2007 in Sukabumi, Garut, Cilacap, Kebumen, Gunung Kidul, Pacitan, Trenggalek, and Malang sub province.
Data Collection
Implementation strategy of applying this model was conducted using the focus group discussion, with various type of stakeholders. The stakeholders include tuna entrepreneur, fishermen, fishing port organizer, processing industry entrepreneur, exporter, consumers, fisheries agency, local government, village cooperation organizer, elite figure, self supporting society institute, and expert in fisheries field.
Data Analysis
Interpretative structural modeling technique was divided into two part composing of hierarchy and sub element classification. First phase was generating tool, passing gathering information from stakeholders. Second phase was choosing relevant relationship, so the elements can be formulation (Eriyatno, 2003).
Analysis step with interpretative structural modeling technique were:
1. System element identification.
2. Develop contextual relation among element which adapted with the model purpose.
3. Making structural self interaction matrix. Matrix made base to responder perception through focus group discussion. Four symbols for representing existing relation type among two element of the considered system are:
V : relation from Ei to Ej, not on the contrary.
A : relation from Ej to Ei, not on the contrary.
X : relation among Ei and Ej (on the contrary).
O : indicating that Ei and Ej is not interconnected.
4. Making reach ability matrix: a reach ability matrix which is prepared later changed structural self interaction matrix symbols to a binary matrix. Converting rule applying:
a. If relation Ei to Ej=V in structural self interaction
matrix, so element Eij=1 and Eji=0 in reach
ability matrix.
b. If relation Ei to Ej=A in structural self interaction
matrix, so element Eij=0 and Eji=1 in reach
ability matrix.
c. If relation Ei to Ej=O in structural self interaction
matrix, so element Eij=0 and Eji=0 in reach
ability matrix.
Early reach ability matrix modified to show all direct and indirect reach ability, that is if Eij=1 and Ejk=1, so Eik=1.
5. Participation level conducted to classify element in different level of interpretative structural modeling technique. For this purpose, two tools associated with every element Ei of the system reach ability
set (Ri), is a set from all element which is reached
from all element where Ei element can be reached.
At first iteration of all element, where Ri=Ri∩Ai,
are first level elements. At the next iteration, elements identified like level elements in eliminated previous iteration, and new elements is selected for next levels by the same rule. Then, all system elements grouped to different levels.
6. Making canonical matrix: elements grouping to the same level develop this matrix. Resultant matrix has most of higher triangular elements is 0 and lowest 1. This matrix then used to prepare digraph. 7. Making digraph: a concept coming from directional graph, a graph from elements which direct relation, and hierarchy level. Early digraph is prepared in canonical matrix basis. That early digraph then is cutting by removing all transitive components for making final graph.
8. The evocation of interpretative structural modeling: interpretative structural modeling awakened by removing all elements by describing actual element. For that, interpretative structural modeling gives clearly depicting the system elements and relation path.
The outputs of interpretative structural modeling technique are each sub element ranking and sub element plot in four sectors with their quadrants. The sectors are:
1. Sector I: weak driver weak dependent variables. Sub element which enter this sector commonly is not relation with the system or few relation. Sub element in sector I, if driver power value <0,5X and dependence value if <0,05X; where X was the number of sub element.
2. Sector II: weak driver strongly dependent variables. Commonly the sub element which entered this sector is un free sub element. Sub element in sector II, if driver power value <0,5X and dependence value >0,5X.
3. Sector III: strong driver strongly dependent variables. Sub element which enter in this sector should carefully study, because of unstable relation between sub element. Every action at sub element will impact to other sub element and feed back effect can enlarge the impact. Sub element in sector III, if driver power value >0,5X and dependence value >0,5X.
4. Sector IV: strong driver weak dependent variables (independent). Sub element which enter this sector was a remains part of system and called independent variable. Sub element in sector IV, if driver power value >0,5X and dependence value <0,5X.
RESULTS AND DISCUSSIONS
From the application of the model for tuna fisheries in south coast of Java, it has been realized that there are seven system elements requiring consideration. The efficacy of development program require priority and emphasize at sub element becoming key sub elements. Key sub element will drive other sub elements in the system, for succeeding program.
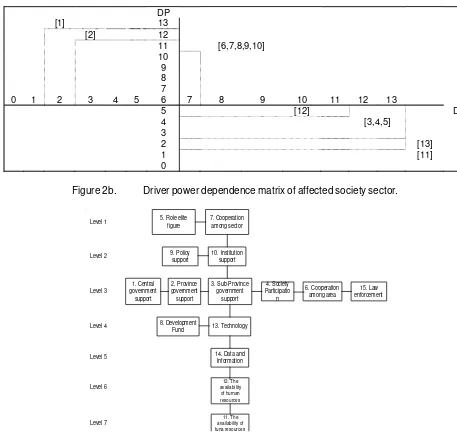
In the driver power dependence matrix, represent sub element which strong depended to other sub element in the system. In this condition sub element is labile, or easy change by change influence from other sub element. Sub element of system also have drive power that strong or weak to drive the efficacy of program (Eriyatno, 2003; Marimin, 2004).
Development program of tuna fisheries in south coast of Java to be success, with priority for sub element in sector III, are sub element which strongly depended with other sub element in the system and strongly driver to system efficacy. Attention also required to sub element in sector IV, with sub element consideration in this sector was independent variable which effect to other sub element, and also strongly drive for succeeding development program.
The result of gathering information from stakeholder, obtained seven elements which is need considered in applying model of tuna fisheries development in south coast of Java. The seven element are affected society sector; required factor; main constraint; main purpose; indicator of the efficacy; require activity; and institute concerned for success the program.
Affected Society Sector
The structural model diagram of affected society sector in developing tuna fisheries in South Coast of Java was presented in Figure 2a. Tuna fisheries business is key sub element to drive sub element in the level above for succeeding program. It can be comprehend because in tuna fisheries, capital released for operational cost is very high. Disability of entrepreneur to conduct operation trip, like increasing gasoline, will resist other sub elements, for example unemployment of ship worker, lacking raw material supply for tuna processing industry, lacking tuna product for exporter and others.
105 Development of Tuna Fisheries ….. of Interpretative Structural Modeling (Nurani, T.W., et al.)
element in this sector have high depended to another sub element. The lack of attention to this sub element will resist the successful program of tuna fisheries development (Figure 2b).
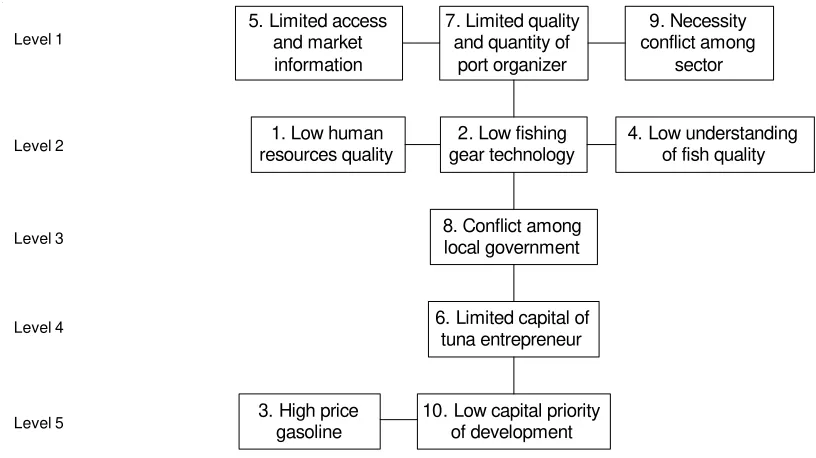
Required Factor for Succeeding Program
Structural model diagram of required factor for succeeding program on development of tuna fisheries express that the availability of tuna resources and the availability of data and information were key element. Sub elements in next level are the availability of human resources, the availability of technology, and also law enforcement (Figure 3). Information about stock availability is basic for sustainable resources utilization effort. Several sustainable efforts require for management the stock availability of tuna fisheries, for better management.
11. Transportation Service Entrepreneur
1. Tuna Fishery Entrepreneur 2. Fisherman
9. Bait Capture Fisherman 8.
Exporter 7. Collected
Merchant 6. Tuna Processing
Industry
13. Society around the port
4. Fishing
Figure 2a. Structural model of affected society
sector.
Figure 2b. Driver power dependence matrix of affected society sector.
5. Role elite figure
14. Data and Information 8. Development
Fund
4. Society Participatio
n 3. Sub-Province
government support 2. Province
government
7. Cooperation among sector
10. Institution support
Result of sub element plot at driver power dependence matrix, distribution sub element most in sector III. This Matter shows most sub element from required factor for the efficacy of program have strongly depended with other sub element in system. The availability of tuna resources and the availability of human resources were in sector IV.
Main Constraint of Development Program
Structural diagram model for the element of main constraint of program development, high gasoline price, development fund priority which still lower and
the ability of limited capital from businessmen were key element from the main constraint of program (Figure 4). The main constraints have to handle, before overcoming the other problems. Not supporting gasoline price in fisheries effort is important factor became constraint for fisheries development. At industrial fisheries like tuna fisheries, gasoline cost reach 30% from overall operational cost requirement. Existence of increasing gasoline at October 2005, have increased gasoline cost become 50% from overall effort requirement. Increasing gasoline cost caused entrepreneur face heavily problem and difficult to conduct operation (Nalendra, 2007).
5. Limited access and market information
10. Low capital priority of development 6. Limited capital of
tuna entrepreneur
3. High price gasoline
8. Conflict among local government
4. Low understanding of fish quality 1. Low human
resources quality
7. Limited quality and quantity of
port organizer
2. Low fishing gear technology
Level 1
Level 5 Level 4 Level 3 Level 2
9. Necessity conflict among
sector
Figure 4. Structural model of the main constraint of development program.
Result of element plot in driver power dependence matrix, sub element most distributed at sector III, except high gasoline price, the ability of limited capital from entrepreneur and low development fund priority which reside in sector IV. This matter indicate that most sub element have depended and high drive to system. Unhandled one of the sub element will effect to unhandled problems of other system sub element, and also will give feed back to unsuccessful of applying model.
The Main Purpose of Program
Sub element of the main target of program structured in four levels. Optimization of fish resources utilization, increasing income and fisherman prosperity and also increasing of labor absorption were key element from the main purpose of program (Figure 5). Reaching the objective from that sub elements, will
drive to reach other purposes of development tuna fisheries program in South Coast of Java. This match with Dahuri Statement (2003) that policy and related program with optimization of fish resources availability with utilization level in every area is important to guarantee profitable and sustainable fishery effort.
107 Development of Tuna Fisheries ….. of Interpretative Structural Modeling (Nurani, T.W., et al.)
2. Conducted development
program
3. Optimization fish resources utilization 6. Increasing profit
effort
7. Increasing labor absorption
4. Cost efficiency
program
8. Increasing Local income Level 1
Level 4 Level 3 Level 2
5. Balance benefit value
among area
9. Increasing local economic 1. Formed cooperate
management
Figure 6. Structural model of indicator for the efficacy of program.
The Indicator for the Efficacy of Program
The indicator for the efficacy of program placed optimization of fish resources utilization, increasing income of fishery effort, and also increasing labor absorption were key element (Figure 6). The reaching of sub element from indicator of program efficacy will push to reach the other measuring rod sub element.
Driver power dependence matrix from the measuring rod element efficacy of program plot most of sub element into sector III, except optimization of fish resources utilization, increasing income of fishery effort, and also increasing labor absorption in sector IV. This express that most of sub element from
indicator of program efficacy depended and high drive as the measuring rod efficacy of development tuna fishery.
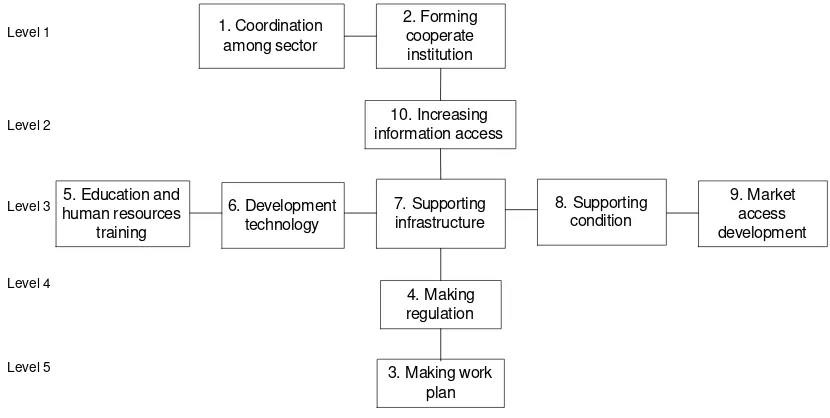
Required Activity for Successful Program
Activity of making work plan for managing tuna resources was key element, which must there before other activity which side in the level above (Figure 7). Next activity is making law regulation to careful manage tuna resources. Education and human training, technological development, the availability of infrastructures, supporting condition, and development of market access was one level above.
1. Coordination among sector
3. Making work plan 4. Making regulation
8. Supporting condition 7. Supporting
infrastructure 6. Development
technology 5. Education and
human resources training
2. Forming cooperate institution
10. Increasing information access Level 1
Level 5 Level 4 Level 3 Level 2
9. Market access development
Education and human training, development of technology, the availability of infrastructure, supporting condition, development of market access, and increasing information access were in sector III. Making work plan for managing fish resources and making regulation were in sector IV. That sub element can influence other sub elements and also have strong drive to successful of development program. Labor has important role for succeeding tuna catch operation. Labor at long line vessel is expected have international seaman license according to SCTW standard 1978
(standard of training certification watch keeping for seafarers).
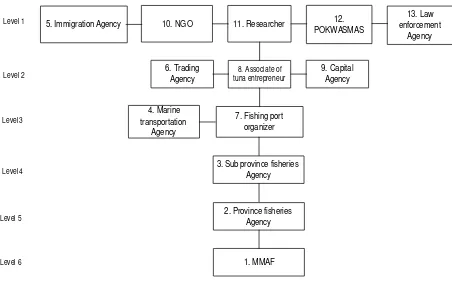
Institution Concerned for the Efficacy of Program
The Ministry of Marine Affairs and Fishery was key sub element from concerned institution element at development tuna fisheries program. Other Institution which has important involvement are the Province Fisheries Agency, the sub Province Fisheries Agency, marine transportation Agency, and fishing port organizer (Figure 8).
10. NGO
3. Sub province fisheries Agency 4. Marine
transportation Agency
7. Fishing port organizer 11. Researcher
8. Associate of tuna entrepreneur Level 1
Level 4 Level 3 Level 2
12. POKWASMAS
13. Law enforcement
Agency 5. Immigration Agency
6. Trading Agency
9. Capital Agency
1. MMAF 2. Province fisheries
Agency
Level 6 Level 5
Figure 8. Structural model of institution concerned for the efficacy of program.
Fisherman group, tuna entrepreneur association, capital institution, POKWASMAS, and law enforcement institution were in sector III. The Institutes have strong relation and high drive to the efficacy of system. Ministry of Marine Affairs and Fishery and Province Fisheries Agency were in sector IV, represent that institutions have low relation with other sub system, but influence sub element from other related institution, and also have strong drive to the efficacy of system.
Development of tuna fisheries can’t be conducted spatial every province or sub province, but integrated for entire South Java territorial waters. Coordination should be centrally conducted, in this case the role
of Ministry of Marine Affairs and Fishery is very important. Previously, model recommended for developing tuna fisheries in South Coast o Java require integrated institution. Institution meant as resources management executor, while management authority is Ministry of Marine Affairs and Fishery. The institution is expected can accommodate the necessity between province or sub province and also between stakeholders. Institution is functioned to manage the utilization of tuna resources optimally, sustainability and in justice. Involvement of stakeholders require in planning, composing policy, conducting, monitoring, and evaluating the management of fish resources
109 Development of Tuna Fisheries ….. of Interpretative Structural Modeling (Nurani, T.W., et al.)
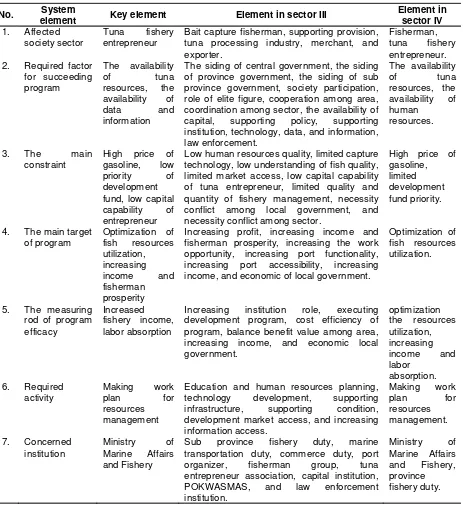
Key sub element lock and sub element plot which including into sector III and IV as a whole from seven
element which required attention for the efficacy of development tuna fisheries program in south coast of Java presented in Table 1.
Table 1. Key element and element in sector III and IV for applying strategy of tuna fisheries development
model in south coast of Java
No. System
element Key element Element in sector III
Element in sector IV 1. Affected
society sector
Tuna fishery entrepreneur
Bait capture fisherman, supporting provision, tuna processing industry, merchant, and exporter.
Fisherman,
tuna fishery entrepreneur.
2. Required factor
for succeeding program
The availability
of tuna resources, the availability of data and information
The siding of central government, the siding of province government, the siding of sub province government, society participation, role of elite figure, cooperation among area, coordination among sector, the availability of capital, supporting policy, supporting institution, technology, data, and information, law enforcement.
The availability
of tuna resources, the availability of human
resources.
3. The main
constraint
High price of gasoline, low priority of development
fund, low capital capability of entrepreneur
Low human resources quality, limited capture technology, low understanding of fish quality, limited market access, low capital capability of tuna entrepreneur, limited quality and quantity of fishery management, necessity conflict among local government, and necessity conflict among sector.
High price of gasoline,
limited development fund priority.
4. The main target
of program
Optimization of fish resources utilization,
increasing
income and fisherman
prosperity
Increasing profit, increasing income and fisherman prosperity, increasing the work opportunity, increasing port functionality, increasing port accessibility, increasing income, and economic of local government.
Optimization of fish resources utilization.
5. The measuring
rod of program efficacy
Increased
fishery income, labor absorption
Increasing institution role, executing development program, cost efficiency of program, balance benefit value among area, increasing income, and economic local government.
optimization the resources utilization, increasing
income and labor
absorption. 6. Required
activity
Making work plan for resources
management
Education and human resources planning, technology development, supporting infrastructure, supporting condition, development market access, and increasing information access.
Making work plan for resources
management.
7. Concerned institution
Ministry of Marine Affairs and Fishery
Sub province fishery duty, marine transportation duty, commerce duty, port organizer, fisherman group, tuna entrepreneur association, capital institution, POKWASMAS, and law enforcement institution.
Ministry of Marine Affairs and Fishery, province
fishery duty.
CONCLUSION
1. There are seven elements require to consider strategy in applying development model of tuna
2. Key sub element as factor which important role for efficacy of applying model from each element, are tuna entrepreneur, the availability of tuna resources, the availability of data and information, high price of gasoline, limited capital of entrepreneur, low development capital priority, optimization of tuna resources utilization, increasing income and labor absorption, making work plan activity, and Ministry of Marine Affairs and Fishery.
ACKNOWLEDGEMENTS
This study is regional fisheries development focusing on specific local potency in 2004-2006 funded by BPPS/DEPDIKNAS.
REFERENCE
Balanos, R., F. Emilio, N. Alfredo, & P. Pablo. 2005. Using interpretative structural modeling in strategic
decision making groups. Management Decision.
43 (19): 877-895.
Dahuri, R. 2003. Paradigma baru pembangunan
Indonesia berbasis kelautan. Orasi Ilmiah Guru
Besar. Institut Pertanian Bogor. Bogor. 233 pp.
Eriyatno. 2003. Ilmu Sistem, Meningkatkan Mutu, dan
Efektivitas Manajemen. Institut Pertanian Bogor.
Press Bogor. 147 pp.
Gorvett, R. & N. Liu. 2007. Using Interpretative
Structural Modeling to Identify and Quantify
Interactive Risks. ASTIN Colloquium. Orlando. FL.
http://www. Io
tc.org/files/proceedings/2009/wptt/IOTC-2009-WPTT-REJ.pdf.
Liu, S., X. Gao, Q. Zen, Y. Zhou, Y. Huang, W. Han, L. Li, J. Li, & Y. Pu. 2009. Studies on interpretative
structural model for forest ecosystem management decision making. complex science.
First International Conference. Complex 2009.
Shanghai. China. 23-25 Februari 2009.
Mandal, A. & S. G. Deshmukh. 1994. Vendor selection using interpretative structural modeling. International Journal of Operations and Production
Management. 14 (6): 52-59.
Marimin. 2004. Teknik dan Aplikasi Pengambilan
Keputusan, Kriteria Majemuk. Grasindo. Jakarta.
197 pp.
Nalendra, H. 2007. Perkembangan industri perikanan
Indonesia kini dan mendatang. Makalah Temu
Bisnis Perikanan Tangkap: Membangun Keberlanjutan Usaha Perikanan melalui Sinergi
antara Akademisi, Industri, dan Pemerintah.
Bogor. Tanggal 29 Nopember 2007.
Nurani, T. W., J. Haluan, S. Sudirman, & E. Lubis. 2008. Rekayasa sistem pengembangan perikanan
tuna di perairan selatan Jawa. Forum
Pascasarjana. 31 (2): 79-92.
Sagheer, S., S. Surendra, Yadav, & S. G. Deshmukh. 2009. An application on interpretative structural modeling of the compliance to food standards. International Journal of Productivity and
Performance Management. 58 (2): 136-159.
Utomo, T. P., A. M. Fauzi, T. Tedja, M. Romli, A. Aman, & S. Honggokusumo. 2008. Kajian perbaikan agroindustri karet remah menggunakan
interpretative structural modeling. Prosiding