Evaluating TransJogja Service Quality based on User Perceptions and
Expectations
Aleksander PURBA a, Fumihiko NAKAMURA b, Shinji TANAKA c,
Peamsook SANITd, Ryo ARIYOSHI e
a
Graduate School of Urban Innovation, Yokohama National University, Kanagawa 240-8501, Japan/The University of Lampung, Bandar Lampung, 35145, Indonesia b, c, d, e
Graduate School of Urban Innovation, Yokohama National University, Kanagawa 240-8501, Japan
a
E-mail: [email protected] b
E-mail: [email protected] c
E-mail: [email protected] d
E-mail: [email protected] e
E-mail: [email protected]
Abstract: To tackle the increased motorization, Ministry of Transportation (MoT) of Indonesia has promoted pilot cities for land transport improvement. Unfortunately, TransJogja as a new transit system has failed to encourage number of passengers in spite of the increasing of travel demand from population growth as its service quality has continually declined after over five years of operations. This research provides a comprehensive tool for measuring the overall transit service quality, named Heterogeneous Customer Satisfaction Index (HCSI), by considering different service aspects. To measure TransJogja service quality, users completed information about 8 service aspects which consists of overall 27 service attributes. The value of HCSI is 7.22 out of 10 indicating that the service delivered is about 72 percent successful in satisfying TransJogja customers. More efforts are needed to increase the level of customer satisfaction and attract new users to establish TransJogja as an appropriate transit system within the city.
Keywords: Indonesia, TransJogja, Service Quality, Service Attribute, HCSI
1. INTRODUCTION
Unlike most cities in developed countries where over half of commuting trips are made by combined modes including cycling, walking and public transit, nearly all of commuting trips in most cities of developing countries are absolutely dominated by private vehicles even for a short distance. At a certain point uncontrolled private vehicle using in this region becomes one of major causes of traffic congestion and various externalities threatening the sustainability of the cities. These cities do not have a proper mass transportation system to suppress the increase of motorization in urban areas. Moreover, the attitude of society is to use automobile ownership as one of the requirements for social acknowledgement. This has encouraged everyone to have their own private car and discouraged them to travel by public transport. In addition, urban growth and sprawl with a poor public transport network have heighten the trend of rapid motorization among urban residents in developing cities (Susilo et al., 2007).
particularly motorcycles phenomenon, the Ministry of Transportation (MoT) of Indonesia enacted decree No 51 of 2007, promoting pilot cities for land transport improvement. The decree mandates the pilot city candidates to reflect on their commitments by providing documents declaring their preparedness in terms of institutional capacity, funding capacity, human resource availability and transportation master plan. From the target of thirty pilot cities by 2014, to date, twenty seven cities have signed a memorandum of understanding with MoT and launched more than twenty new transit systems, including TransJogja of Jogjakarta. Unfortunately, after over five years of operation, the TransJogja has failed to encourage number of passengers despite the increasing of travel demand from population growth since its service quality has continually declined.
Indeed, the transit service quality itself is an aspect markedly influencing travel user choices. Users who have a good experience with transit will probably use transit services again, whereas users who feel dissatisfied with transit may not use the next time. For this reason, improving service quality is important for customizing habitual travelers and for attracting new users. Moreover, customer satisfaction represents a measure of company performance according to customer needs (Hill et al., 2003). Hence, the measure of customer satisfaction provides a service quality measure which customers express their points of view concerning the services by providing judgments on some service aspects by means of ad hoc experimental sample surveys, known in the literature as customer satisfaction surveys.
The aspects generally describing transit services can be distinguished into two characteristics. First, the characteristic that more properly explore the service (e.g., service frequency), and, the second characteristic is the less easily measurable terms that depend more on customer tastes (e.g., comfort). In the literature, there are many researches concerning transit service quality. Examples of the most recent research are reported in TRB (2003a, 2003b), Joewono and Kubota (2007), Tyrinopoulos and Antoniou (2008), Iseki and Taylor (2008) and Eboli and Mazzula (2009). In these studies, different attributes determining transit service quality are discussed; the main service aspects characterizing a transit service include service scheduling and reliability, service coverage, information, comfort, cleanliness, and safety and security. Service scheduling can be defined as service frequency (number of runs per hour or per day) and service time (time during which the service is available). Service reliability explores the regularity of runs that are on schedule and on time; an unreliable service does not permit user travel times to be optimized. Service coverage examines service availability in the space and is expressed through line path characteristics, number of stops, distance between stops, and accessibility of stops. Information consists of indications about departure and arrival scheduled times of the runs, boarding/alighting stop location, ticket costs, and so on. Comfort refers to passenger personal comfort while transit is used, including climate control, seat comfort, ride comfort including the severity of acceleration and braking, odors, and vehicle noise. Cleanliness speaks about the internal and external cleanliness of vehicles and cleanliness of terminals and stops. Safety deals with the possibility that users can be involved in an accident, and security concerns personal security against crimes. Other service aspects characterizing transit services analyze fares, personnel appearance and helpfulness, environmental protection, and customer services such ease of purchasing tickets and administration of complaints.
decreased as the service quality also has simultaneously declined. For example, the frequency of bus arrival, which promised every 5 to 10 minutes, now stretches to more than 30 minutes at peak hours. In point of fact, authors propose a synthetic index of overall satisfaction, which can be used easily by both transit agency and regulatory body for evaluating service performance of TransJogja. In the next section, a critical review of indices for measuring service quality from a user perspective is made; observations and remarks emerge from the comparison among the indices analyzed. Because of the disadvantages of the indices reported in the literature, a new index is proposed. The proposed methodology is applied by using experimental data collected by a customer satisfaction survey of passengers of a new transit service called TransJogja. The results and findings are discussed at the end of the paper.
2. REVIEW OF TRANSIT EVALUATION METHODS
It is inevitable, the concept of customer satisfaction as a measure of perceived service quality was mostly introduced in market research. In this field, many customer satisfaction techniques have been developed. The best known and most widely applied technique is ServQual method, proposed by Parasuraman et al. (1985). The ServQual method introduced the concept of customer satisfaction as a function of customer expectations (what customers expect from the service) and perceptions (what customers receive). The method was developed to assess customer perceptions of service quality in retail and service organizations. In the method, five service quality dimensions and twenty two items for measuring service quality are defined. Service quality dimensions are tangibles, reliability, responsiveness, assurance, and empathy. The method is in the form of a questionnaire that uses a Likert scale on the seven levels of agreement/disagreement (from strongly disagree to strongly agree).
The ServQual provides an index calculated through the difference between perception and expectation rates expressed for the items, weighted as a function of the five service quality dimensions embedding the items. Some variations of this method were introduced in subsequent years. For example, Cronin and Taylor (1994) introduced the ServPerf method, and Teas (1993) proposed a model named Normed Quality (NQ). Although the ServQual represents the most widely adopted method for measuring service quality, the adopted scale of measurement for capturing customer judgments has some disadvantages in obtaining an overall numerical measure of service quality. In fact, to calculate an index, the analyst is forced to assign a numerical code to each level of judgment. In this way, equidistant numbers are assigned to each qualitative point of the scale; this operation assumes that the distances between two consecutive levels of judgment expressed by the customers have the same size.
original regarding the variables considered and the cause and effect relationships introduced. The models from which these indices are derived have a very complex structure. In addition, model coefficient estimation needs of large quantities of experimental data and the calibration procedure is not easily workable. For this reason, this method is not very usable by transit agencies, particularly for monitoring service quality.
More recently, an index based on discrete choice models and random utility theory has been introduced. The index, named Service Quality Index (SQI), is calculated by the utility function of a choice alternative representing a service (Hensher and Prioni, 2002). The user makes a choice between the service habitually used and hypothetical services. Hypothetical services are defined through Stated Preferences (SP) techniques by varying the level of quality aspects characterizing the service. Habitual service is described by the user by assigning a value to each service aspect. The design of this type of SP experiments is generally very complex; an example of an SP experimental design was introduced by Eboli and Mazzulla (2008b).
Afterwards, Fu and Xin (2007) introduced Transit Service Indicator (TSI) as an alternative measure for the service quality of a transit system. This indicator incorporated spatial and temporal variations in travel demand and integrated various measures such as service headway, service hours, route coverage, and travel time components. From extant literature, Choocharukul and Sriroongvikrai (2013) analyzed customer satisfaction of Bangkok mass rapid transit passengers by applied factor analysis and structural equation modeling.
A more direct measure for service quality evaluation is provided by an overall index, often called Customer Satisfaction Index (CSI) (Hill et al., 2003). The CSI represents a measure of service quality on the basis of the user or consumer perceptions on service aspects expressed in terms of importance rates, compared with user or consumer expectations expressed in terms of satisfaction rates. The CSI plugs the gap of ServQual because it is based on judgments expressed by customer according to a numerical scale. Compared to all the described indices, CSI is based on a simple procedure, fully described in the next section, which allows the index to be easily calculated by transit operators. The CSI does not take into account the heterogeneities among user judgments. To the contrary, the index proposed by the authors provides an overall service quality measure introducing the dispersion of the importance and satisfaction rates among users.
3. METHODOLOGY
3.1 Customer Satisfaction Index
CSI=
∑
[
]
−
N
k
k
kW
S
1
. (1)
where
_
k
S : is the mean of the satisfaction rates expressed by users on the service quality k
attribute
k
W : (importance weight) is a weight of the k attribute, calculated on the basis of the importance rates expressed by the user. Specifically, the importance weight is the
ratio between the mean of importance rates expressed by users on the k attribute and the sum of the average importance rates of all the service quality attributes:
∑
−= N
k k k k
I I W
1 _ _
(2)
Ideally, CSI portrays good measure of overall satisfaction because it summarizes the judgments expressed by users in respect of various service attributes in a single score. Therefore, the more accurate the selection of the attributes is the more accurate the measure of the overall satisfaction will obtain. For this reason, the selected attributes should characterize the service aspects deeply as well as reflect the current serving situations as clear as possible.
However, when all the importance scores are close to a certain value, the importance weights are similar, and then the CSI value is close to the average of all the satisfaction scores. In this eventuality, CSI does not give any additional information compared to the indicator calculated by considering only the satisfaction scores. In addition, the average importance scores result from the rates expressed by a sample of customers, which can be very heterogeneous; the dispersion of the rates can be represented by the variance or the standard deviation from the mean. In the same way, the satisfaction rates can be very heterogeneous among users. These heterogeneities cannot be taken into account in the CSI calculation. To overcome this lack, importance weights can be corrected according to the dispersion of the importance rates from the average value. Analogously, satisfaction scores can be corrected according to the dispersion of the satisfaction rates from the average value. These adjustments have been introduced for calculating a new indicator, named Heterogeneous Customer Satisfaction Index (HCSI). From a mathematical point of view, HCSI is calculated by the following formula:
HCSI =
∑
[
]
−
N
k
c k c
kW
S
1
. (3)
where,
c k
S : is the mean of the satisfaction rates expressed by users on the k attribute, corrected according to the deviation of the rates from the average value
c k
Whereas Skc is calculated by the following formula:
N
S S S S
S S
N
k k
k k k
k c
k .
) var(
) var( .
1 _ _
_
∑
−= (4)
The adjustment factor is calculated as the mean of the satisfaction rates expressed by users on the k attribute divided by the mean of the average satisfaction rates of all the service quality attributes, weighted on the variance of the satisfaction rates.
Similarly, Wkc is calculated as the mean of the importance rates expressed by users on the k attribute divided by the sum of the average importance rates of all the service quality attributes, weighted on the variance of the importance rates, according to the following formula:
∑
−=
N
k k
k k k
c k
I I
I I
W
1 _ _
) var(
) var(
(5)
The introduction of the variance for adjusting the importance and satisfaction rates allows the attributes characterized by more homogeneous user judgments to be considered more significant; to the contrary, the attributes with heterogeneous judgments are considered less significant. Moreover, the mathematical basis of the HCSI formula is demonstrated by assuming that all the customers surveyed gave satisfaction scores of 10 out of 10 for every service characteristic, and the average satisfaction scores would all be 10. When the variance of the satisfaction judgments expressed by the customers tends to zero for all service characteristics, the mean of the satisfaction rates divided by the deviation from the mean of each k attribute would tend to the maximum value of 10, and Skc would tend toSk.
Therefore, total customer satisfaction on all their attributes would produce a satisfaction index of 100 percent.
3.2 Data Collection
4. EVALUATION OF TRANSJOGJA SERVICE QUALITY
4.1 Transit Service Characteristics
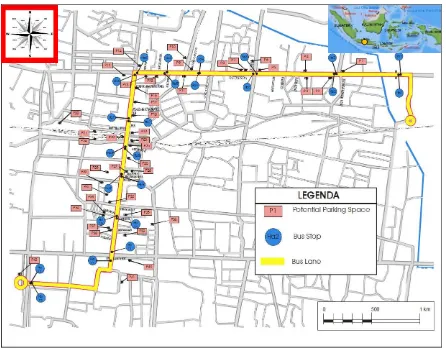
Authors applied the proposed methodology by considering a selected case study concerning new transit system in a medium-sized city of Indonesia. Jogjakarta is located on the central island of Java and ranks after Bali as the most visited tourist place and most people visit the city for the temples of Borobudur and Prambanan. Greater Jogjakarta Special Region itself is an urban agglomeration within Jogjakarta as a provincial capital. It consists of three local governments within the region: one municipality, that is, the City of Jogjakarta, and two districts, namely Sleman in northerly direction and Bantul in southern capital. The area covering 234 km2 was inhabited by 2.3 million people in 2013. Jogjakarta city's population alone is around 510,108 people within 32.50 km2 area (Figure 1).
Furthermore, many university students live in Jogjakarta and surrounding areas; approximately 51,000 students and 2,400 lecturers attend the University of Gadjah Mada alone. Other big universities with more than 10,000 students are Jogjakarta State University, Islamic Indonesia University, and Atma Jaya University, respectively.
The analyzed transit system is a new urban bus service initiated by MoT and Jogjakarta local government to promote a smart bus-based urban transport system employing features such as air-conditioned busses, scheduled services, designated shelters and a smart card ticketing system.
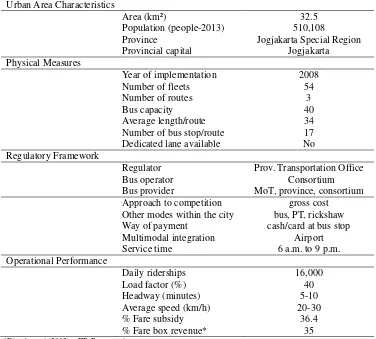
A new feature of TransJogja is the introduction of buy the service licensing scheme, or well-known as gross-cost contract, as an attempt to abolish the daily sublet revenue sharing system between the bus owner and bus operators that is commonly applied. In this new scheme, the government sets up service standards to be fulfilled by the operator. The service provided by the operator will be compensated based on kilometer-traveled as agreed in the initial contract. A brief city and transit service characteristics are presented in Table 1.
Table 1. City and Transit Service Characteristics
Urban Area Characteristics
Area (km²)
Population (people-2013) Province
Provincial capital
32.5 510,108
Jogjakarta Special Region Jogjakarta Physical Measures
Year of implementation Number of fleets Number of routes Bus capacity
Average length/route Number of bus stop/route Dedicated lane available
2008 54
3 40 34 17 No Regulatory Framework
Regulator Bus operator Bus provider
Prov. Transportation Office Consortium MoT, province, consortium Approach to competition
Other modes within the city Way of payment
Multimodal integration Service time
gross cost bus, PT, rickshaw cash/card at bus stop
Airport 6 a.m. to 9 p.m. Operational Performance
Daily riderships Load factor (%) Headway (minutes) Average speed (km/h) % Fare subsidy % Fare box revenue*
16,000 40 5-10 20-30
36.4 35
*Dirgahayani (2012) PT: Para-transit
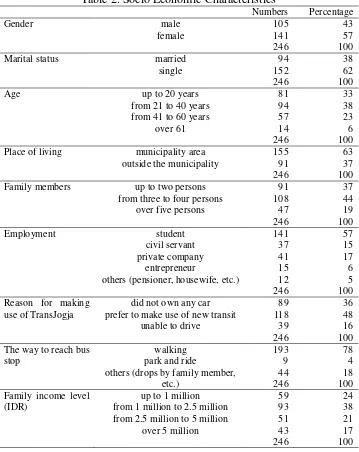
4.2 Users Characteristics
Table 2. Socio Economic Characteristics Marital status married
single Place of living municipality area
outside the municipality Family members up to two persons
from three to four persons over five persons
others (pensioner, housewife, etc.)
141 prefer to make use of new transit
unable to drive
others (drops by family member, etc.) from 1 million to 2.5 million from 2.5 million to 5 million
over 5 million
4.3 Users Perceptions and Expectations
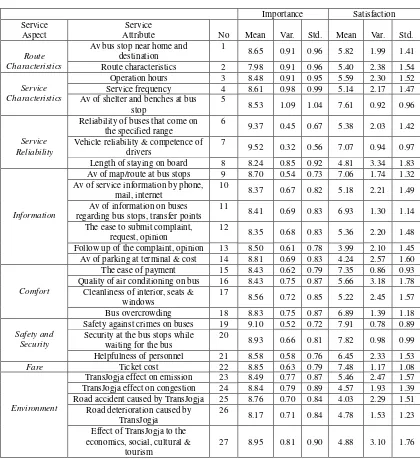
Table 3. Importance and Satisfaction Statistics
Normally, the attributes with an average satisfaction score lower than 6.0 can be considered as critical service aspects. According to analyzed services, as many as 17 of 27 attributes had an unsatisfactory average score; this indicates that most of respondents felt unsatisfied with the TransJogja transit service. Those seven attributes with the lowest average satisfaction score are the follow up of the complaint and opinion, road accident caused by TransJogja, availability of parking at terminal and cost, the effect TransJogja on congestion, road deterioration caused by TransJogja, length of staying on board, and the effect of TransJogja on the economics, social, cultural and tourism. The attributes with the highest average satisfaction scores are safety against crimes on bus, security at the bus stops while waiting for the bus, and availability of shelter and benches at bus stop.
Further, by exploring the importance rates, the most important attributes for the passengers can be identified. By concerning the average importance scores, all the service attributes are considered important by the TransJogja passengers as they are practically represented by an average importance score close to or higher than 8.0. The attributes with the
Importance Satisfaction Av of shelter and benches at bus
stop
5
8.53 1.09 1.04 7.61 0.92 0.96
Service Reliability
Reliability of buses that come on the specified range
6
9.37 0.45 0.67 5.38 2.03 1.42
Vehicle reliability & competence of drivers Av of service information by phone,
mail, internet
10
8.37 0.67 0.82 5.18 2.21 1.49
Av of information on buses regarding bus stops, transfer points
11
8.41 0.69 0.83 6.93 1.30 1.14
The ease to submit complaint, request, opinion
Cleanliness of interior, seats & windows Security at the bus stops while
waiting for the bus
20
Road deterioration caused by TransJogja
26
8.17 0.71 0.84 4.78 1.53 1.23
Effect of TransJogja to the economics, social, cultural &
tourism
highest average importance scores are reliability of vehicle and competence of drivers, reliability of buses on the specified range (service frequency), and safety against crimes on buses. These three attributes revealed average importance scores ranging from 9.52 to 9.10, pointing out that the service attributes are considered very important by respondents.
Afterwards, both satisfaction and importance rates were analyzed also by means of the variance. This type of measures enables the heterogeneity of passengers in the evaluation of service quality to be verified. By this way, the passenger judgments on expected quality (rate of importance) are much more homogeneous than the judgments on the perceived quality (rate of satisfaction). In fact, the value of average variance, calculated by considering the rates expressed on all the attributes, is 0.72 for the importance and 1.95 for the satisfaction. Then, the coefficients of variation are 9.7 and 23.4 percent, respectively. These figures also indicate that the passenger judgments on the perceived quality are around three times more heterogeneous than the judgments on the expected quality.
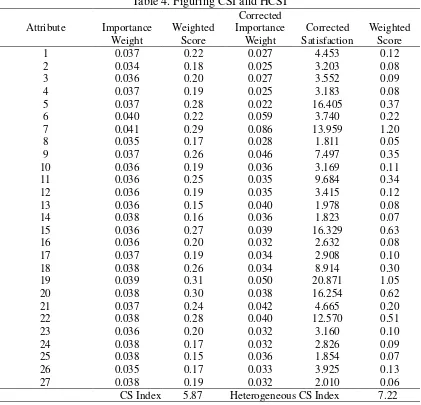
Eventually, both satisfaction and importance rates expressed by the bus passengers were used for the calculation of the CSI and HCSI as reported in Table 4. In the third and sixth column, the weighted scores are reported, which represent the contribution of each attribute to the final value of CSI and HCSI, respectively.
Table 4. Figuring CSI and HCSI
5. IMPLICATIONS OF CUSTOMER SATISFACTION INDEX
Based on the findings in the Table 3 and Table 4, it can be clearly seen that the city has failed to fulfill the customer satisfaction on TransJogja service quality, even though the transit system has been running for more than five years. Passenger judgments on perceived quality show that the only 7 of 27 service attributes are considered somewhat satisfied with the transit service as they are practically represented by an average satisfaction score close to or higher than 7.0. The attributes with the highest average satisfaction scores are safety against crimes on buses (7.91), security at the bus stops while waiting for the bus (7.82), availability of shelter and benches at bus stop (7.61), ticket cost (7.48), ease of payment (7.35), vehicle reliability and competence of drivers (7.07), and availability of map/route at bus stops (7.06) (Table 3). Furthermore, there is no an average satisfaction score close to or higher than 8.0 indicating that, none of the respondents is satisfied with the quality of transit service provided. On the contrary, as many as 20 of 27 service attributes reveal that average satisfaction scores ranging from the highest 6.93 (availability of information on buses regarding bus stops, transfer points) to the lowest 3.99 (follow up of the complaint and opinion). This empirical evidence has demonstrated that most of the service attributes are considered as neither less satisfied nor dissatisfied by respondents. As mentioned previously, users who have a good experience with transit will probably use transit services again, whereas users who feel dissatisfied with transit may not use the next time. Unfortunately, TransJogja has failed to encourage number of passengers despite the increasing of travel demand from population growth since its service quality has continually declines as well as most of customers are unsatisfied with service provided.
The projects in terms of financial and organizational reforms on public transport industry aiming to reform the existing regulatory policies and operational practices, are facing multiple obstacles to achieving organizational goals in both operational and management levels. The comprehensive assessment and evaluation required to include not only the related operation, financing, regulations and enforcement but also other policies neglecting business and commercial elements on public transport industry. These should be done through a series of comprehensive studies covering development of a modern, commercial and customer oriented strategy followed by training and workshops to local government staffs as well as bus operators on effective route and service planning, operational and maintenance system, followed by a demo project as a showcase for better operational system.
Analyzing root causes of problems such as unstable service frequency, and other discomfort aspects should be looked at to assist the operator with a financial scheme in the procurement of new buses and spare parts, for example through credit programs and cooperatives, or through some sort of tax incentives. An established of a policy reform and deregulation in urban public transport financing, should be followed by an improved standard for TransJogja service and building institutional capability of the provincial government in administering urban transport system and in developing an appropriate urban transport strategy. After more than five years to focus more on the expansion of service, it is the suitable time for the MoT and local government to focus solely on sustaining the attractiveness of TransJogja as before.
5. 1 Considerable Weight Contribute Satisfaction
of each service attribute to each index. Obviously, if the variance of importance rates is the same for all the attributes and, contemporaneously, the variance of satisfaction rates has the same value for all the attributes, CSI and HCSI value are equal.
In the meanwhile, by examining the weighted scores regarding CSI, it emerges that the attributes giving the highest contribution to overall satisfaction are safety against crimes on buses, security at the bus stop while waiting for the bus, vehicle reliability and competence of driver, availability of shelter and benches at bus stop, and ticket cost. However, the values of the weighted scores range from 0.15 to 0.31 as shown in Table 4. Of course, the other attributes also make a considerable contribution to the overall value of CSI.
Although of the gap between the two indices is 1.35, the weighted scores of CSI are very different compared to those of HCSI, which range from 0.05 to 1.20. The two attributes with the highest weighted scores for HCSI are vehicle reliability and competence of drivers, and safety against crimes on buses, respectively. Findings indicate the four most relevant service attributes for CSI are also relevant for HCSI. They are safety against crimes on buses, vehicle reliability and competence of drivers, security at the bus stops while waiting for the bus, and ticket cost, respectively. Furthermore, the availability of shelter and benches at bus stop and the availability of map/route at bus stops show the considerable weights.
5. 2 Environmental Issues
The integration of environmental concerns into urban transport policy has become important issues over the last few decades. Providing new transit system without being followed by tightening the use of private vehicles may not obtained optimal results, as experienced by the city of Jogjakarta. As the city is dominated by university students and as the students have become wealthier, most of them have bought motorcycles as the main mode to support their daily activities. Ease of credit system and low cost of vehicle ownership also contribute to the rapid growth of vehicle ownership. Nowadays, motorcycles make up more than 80 percent of the city’s vehicle fleet of 257,000 and have largely displaced other forms of travel including for short trips, although these trips are more efficiently done by foot.
The presence of TransJogja as clearly expressed by respondents is shown a less contribution to environmental aspect; from 7.22 of HCSI value, the weighted scores of effects on emission, congestion, and road accident are only 0.10, 0.09, and 0.07, respectively, indicating those service attributes contribute less than 5 percent of HCSI value. In other words, after over five years of operation, the new transit system has not been able to attract more private vehicle users and reduce the level of emission, congestion and accidents. Since Jogjakarta city is better well-educated than other medium-sized cities across country, the environmental issues are supposed to be easier campaigned and implemented by all stakeholders, including the active participation of the universities.
6. CONCLUSIONS
In this paper, local resident perception and expectation were explored by respondent participation in rating the TransJogja service quality referring to the current level of service. This research employs overall measures of service quality by considering different service aspect method to reveal and examine the data.
the strategies for improving the service quality to be defined. HCSI explores heterogeneity into user judgments because importance and satisfaction rates are corrected according to dispersion from the average value. The value of HCSI is 7.22 out of 10. By converting this score into a percentage, the satisfaction index shows that the service is about 72 percent successful in satisfying TransJogja customers.
More efforts are needed to increase the level of customer satisfaction and attract new users to use TransJogja. Both regulator and operator should more initiate corrective measures referring to the user's perspective, more than the government projects in general which are usually top down setting. For example, length of staying on board’s attribute is the lowest weighted score (0.05) which is also the least satisfactory service attribute expressed by respondent. Reducing travel time by the application of ITS in advance can be considered as the highest priority measure to tackle the service quality problems more than expanding the service area. Other service attributes that should be considered by both regulator and operator are the follow up of complaint and availability of parking at terminal, respectively. The weighted scores are 0.08 and 0.07, respectively, indicating that they less contribute HCSI value as well as the attributes which are mostly complained by respondents. These things have become evident that the functions, roles and regulatory framework of urban transport are needed to reform in order to overcome the increasingly complicated problems.
REFERENCES
Andreassen, T.W., Lervik, L. (1999) Perceived relative attractiveness today and tomorrow as a predictors of future repurchase intention. Journal of Service Research
2(2), 164-172.
Andreassen, T.W., Lindestad, B. (1998) Customer loyalty and complex services: the impact of corporate image on quality, customer satisfaction and loyalty for customers with varying degrees of service expertise. International Journal of Service Management 9(1), 7-23.
Choocharukul, K., Sriroongvikrai, K. (2013) Multivariate analysis of customer satisfaction: a case study of Bangkok’s mass rapid transit (MRT) passengers. Journal of the Eastern Asia Society for Transportation Studies, 10, 1258-1269.
Cronin, J.J., Taylor, S.A. (1994) SERVPERF versus SERVQUAL: Reconciling performance-based and perceptions-minus-expectations measurement of service quality. Journal of Marketing 58(1), 125-131.
Dirgahayani, P. (2012) Policy elements to upscale the contribution of urban transit initiative on sustainable urban transport: the case of bus improvement initiatives in Indonesia. UNU-IAS Working Paper No. 168, 23pp.
Eboli, L., Mazzulla, G. (2007) Service quality attributes affecting customer satisfaction for bus transit. Journal of Public Transportation 10(3), 21-34.
Eboli, L., Mazzulla, G. (2009) A new customer satisfaction index for evaluating transit service quality. Journal of Public Transportation 12(3), 21-37.
Eklof, J.A. (2000) European customer satisfaction index pan-European telecommunication sector report based on the pilot studies 1999. European Organization of Quality and European Foundation for Quality Management, Stockholm, Sweden.
Fornell, C., Johnson, M.D., Anderson, E.W., Cha, J., Everitt Bryant, B. (1996) The American Customer Satisfaction Index: Nature, purpose, and findings. Journal of Marketing 60, 7-18.
Journal of Marketing 56, 6-21.
Fu L., Xin, Y. (2007) A new performance index for evaluating transit service quality.
Journal of Public Transportation 10(3), 47-70.
Hensher, D.A., Prioni, P. (2002) A service quality index for an area-wide contract performance assessment regime. Journal of Transport Economics and Policy 36(1), 93-113.
Hill N., Brierley, G., MacDougall, R. (2003) How to Measure Customer Satisfaction. Gower Publishing, Hampshire.
Iseki, H., Taylor. B.D. (2008) Style versus service? An analysis of user perceptions of transit stops and stations in Los Angeles -, Paper presented at 87th Annual Meeting of the TRB, Washington, D.C., January 13-17.
Joewono, T.B., Kubota, H. (2007) User perception of private paratransit operation in Indonesia. Journal of Public Transportation 10(4), 99-118.
Johnson, M.D, A. Gustafsson, T.W. Andreassen, L. Lervik, Cha, J. (2001) The evolution and future of national customer satisfaction index models. Journal of Economic Psychology 22, 217-245.
Parasuraman, A., Zeithaml, V.A., Berry, L.L. (1985) A conceptual model of service quality and its implication for future research. Journal of Marketing 49,41-50.
Purba, A., Nakamura, F., Tanaka, S. (2014) Service Delivered on New Transit System from users viewpoint (case study: TransJogja and TransMusi-Indonesia) -, Paper presented at the International Symposium on City Planning, Hanoi, Vietnam, November 6-8.
Susilo, Y.O., Joewono, T. B., Santosa, W., Parikesit, D. (2007) A reflection of motorization and public transport in Jakarta metropolitan area. Journal of IATSS Research 31(1), 58-68.
Teas, R.K. (1993) Expectations, performance evaluation, and consumers’ perceptions of
quality. Journal of Marketing 57(4), 18-34.
Transportation Research Board. (2003a) A Guidebook for Developing a Transit Performance-Measurement System. Transit Cooperative Research Program, Report 88, Washington, D.C, National Academy Press.
Transportation Research Board. 2003b. Transit Capacity and Quality of Service Manual. Transit Cooperative Research Program, Report 100, Washington, D.C, National Academy Press.