ISSN: 2339-076X (e); 2502-2458 (p)
,
Volume 3, Number 3 (April 2016): 595-601
DOI:10.15243/jdmlm.2016.033.595
Research Article
Characteristics of soils developed from alluvium and their potential for
cocoa plant development in East Kolaka Regency, Southeast Sulawesi
E. Yatno
1*, Sudarsono
2, Iskandar
2, B. Mulyanto
21
Indonesian Centre for Agricultural Land Resources Research and Development , Jl. Tentara Pelajar No. 12, Cimanggu Bogor 16114, Indonesia.
2
Departement of Soil Science and Land Resource, Faculty of Agriculture, Bogor Agricultural University , Jl. Meranti, Kampus IPB Dramaga Bogor 16680, Indonesia
*
corresponding author:[email protected]
Abstract:
Cocoa is one of plantation commodities that is quite important for the national economy. Land management for the development of this plant should pay attention to the characteristics of the soil. Three soil profiles formed from alluvium parent material in East Kolaka Regency were investigated to determine the mineralogical, physical, and chemical soil properties, as well as the potential of the land for the development of cocoa plant. The results showed that the mineral composition of the sand fraction was dominated by quartz, while the clay mineral fraction was composed of kaolinite, hydrate halloysite, interstratified of illite-vermiculite and smectite. The soils were characterized by poor drainage, low bulk density (0.78 to 0.95 g / cm3), moderate available water pores (10-15%), slow to fast permeability (0.10 to 14.05 cm / h), silty clay loam to silty clay texture of top soil, acidic soil reaction (pH 4.62 to 5.47), high organic C content (3.86 to 4.60%) in the top soil and very low organic C content (<0.65%) in the lower layer, moderate to high available P (14-38 mg / kg) in the A horizon and very low to moderate (1-18 mg / kg) in horizon B, moderate to high P2O5(30-71 mg / 100g) in horizon A and extremely low (1-11 mg /100g) in horizon B, very low to moderate K2O (3-28 mg / 100g ), moderate to high exchangeable Ca
(9.32 to 13.92 cmolc / kg) in the upper and lower (0.70 to 5.04 cmolc / kg) in the bottom layer, high
exchangeable Mg content (2.83 to 8.95 cmolc/ kg), high soil CEC (34.18 to 38.28 cmolc/ kg) in the upper
layer and low to moderate (7.87 to 20.39 cmolc/ kg) in the bottom layer, moderate to high base saturation
(44-68%), and very low to moderate Al saturation (0-17%). At the family level, the soil was classified as Fluvaquentic Endoaquepts (EK 1 profile) and Typic Endoaquepts (EK 2 and EK 3 profiles), finely loamy, mix, acid, isohypertermik. The land was marginally suitable (S3) for cocoa plant with the contraints of impeded drainage, acid soil reaction, and low K2O. Drainage channel management can be done to
increase the carrying capacity of the land for the development of cocoa plant. Keywords: alluvium, cocoa plant, land suitability, soil characteristics
Introduction
Cocoa (Theobroma cacao L.) is one of the plantation commodity that plays important in the national economy, particularly as providers of employment, income source and country foreign exchange. In addition, cocoa also plays roles in encouraging the development of the region and the development of agro-industry (Goenadi et al., 2005). East Kolaka is one of the central areas of cocoa production in Southeast Sulawesi. In 2013, cocoa production in East Kolaka reached 32023 t. However, the average productivity of cacao plantations in East Kolaka is still relatively low,
provides diversity of the nature and type of soil formed. By nature, the diversity of soil parent material and the development of continuing land will affect the quality of land formed thereby determining the suitability of land and the level of production of certain agricultural commodities (Sys, 1978). Land evaluation is the process of estimating the potential use of land based on the land properties (Rossiter, 1996). Land suitability evaluation is needed in land use planning so that land can be used optimally, productively and sustainably (Zhang et al., 2004). Potential and constraints of land use can be identified early so that land management can be done better and directed in accordance with the commodity to be developed (FAO, 1976). Soil formed from alluvium in the cocoa central area of East Kolaka is widespread. However, many of the cacao plantations have been converted to paddy fields due to the unsatisfactory yield of cocoa. Therefore, a study on soil characteristics and suitability of land for the development of the cocoa plant on land formed from alluvium in East Kolaka is important and interesting to do so the
land potential and constraints for the development of the cocoa plant can be known. This study was aimed to elucidate the mineralogical, physical and chemical properties of soils developed from alluvium parent material and the land potential for the development of the cocoa plant in East Kolaka Regency, Southeast Sulawesi Province.
Materials and Methods
Description of the study area
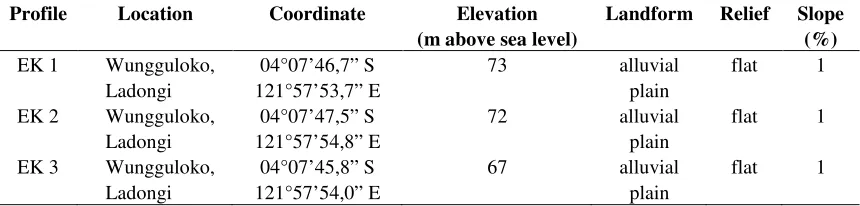
The research location is situated in the center of cocoa farm run by farmers with low-input at Wungguloko Village, Ladongi District, East Kolaka Regency of Southeast Sulawesi Province. Three representative soil profiles formed from alluvium parent materials were selected for this study. The three soil profiles (EK 1, EK 2, EK 3) are located on the alluvial plain landform with flat relief (slope of 1%). The location and description of soil profiles studied are presented in Table 1.
Table 1. The location and description of soil profiles studied
Profile Location Coordinate Elevation Landform Relief Slope
(m above sea level) (%)
EK 1 Wungguloko, 04°07’46,7” S 73 alluvial flat 1
Ladongi 121°57’53,7” E plain
EK 2 Wungguloko, 04°07’47,5” S 72 alluvial flat 1
Ladongi 121°57’54,8” E plain
EK 3 Wungguloko, 04°07’45,8” S 67 alluvial flat 1
Ladongi 121°57’54,0” E plain
The research area has an average rainfall annual of 1,901 mm / year (Ladongi station). The highest average monthly rainfall (306 mm) occurres in May, while the lowest (81 mm) occurres in August. The average air temperature is 27.9°C, while the average humidity is 75.6%. According to Schmidt and Ferguson (1951), the study area has a relatively rain-type B (humid). The level of wetness is reflected by the wet months (> 100 mm / month) that occurr during the 10 months and no dry months (<60 mm / month).
Methods
The representative soil profiles were described following the standard methods for Soil Profile Description (Soil Survey Division Staff, 1993). The soils studied were classified according to the level of family in accordance with Keys of Soil Taxonomy (Soil Survey Staff, 2014). The analysis procedure followed the standard method used in
Soil Survey Laboratory Methods Manual (Soil Survey Laboratory Staff, 2004) and the Indonesian Soil Research Institute (Sulaiman et al., 2005). Soil analysis consisted of soil physical, chemical, and mineralogical analyses. Particle size analysis was conducted by the pipette method. Soil bulk density was measured by gravimetric method on undisturbed soil samples. Water retention was measured at 33 kPa (2.54 pF) and 1500 kPa (4.2 pF) by the method of pressure plate / membrane apparatus, while the soil permeability was determined by the method of constant water level. Soil pH was measured by a glass electrode in a solution of water with a ratio of soil: water of 1: 5. Organic carbon was determined by the Walkley and Black method, while the total N was determined by Kjeldahl method. K2O was measured by the method of
extraction of HCl 25%, while the available P2O5
1. Exchangeable cations (Ca, Mg, Na, K) were extracted with 1 M NH4OAc pH 7.0 and measured
by atomic absorption spectrometer, while the cation exchange capacity was determined by saturation with 1 M NH4OAc pH 7.0.
Exchangeable aluminum was extracted with 1 M KCl and measured by titration. Mineral composition of total sand fraction (50-500 m) was identified on a glass slide using a polarization microscope and the minerals were determined by the line counting method (Buurman, 1990). Clay mineral fraction (<2μm) was determined using X-ray diffractometer (XRD) after saturation with Mg2+, Mg2+ and glycerol, and K+, followed by heating at a temperature of 550oC. Clay mineral identification was based on d spacing of each diffraction peak (van Reeuwijk, 1993). Land suitability evaluation was done by "matching", i.e. comparing the qualities and characteristics of land with plant growing requirements. Criteria of plant growth requirement used for this study was based
on Land Evaluation Technical Guidelines for Agricultural Commodities (BBSDLP, 2011).
Results and Discussion
Soil morphological characteristics
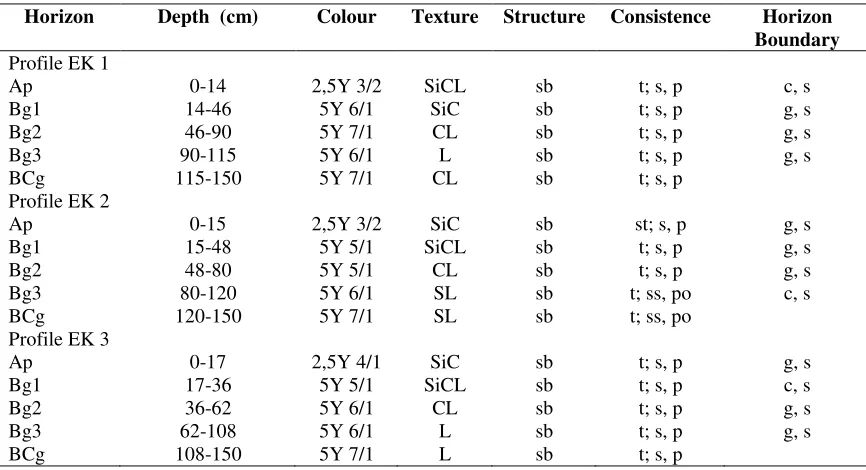
All of the soils studied had deep solum (Table 2). The top layer of soil ranged from very dark brown grayed (2.5Y 3/2) to dark gray (2.5Y 4/1), while the bottom layer ranged from gray (5Y 5 / 1-6 / 1) to light gray (5Y 7 / 1). The gray colour was the result of a process of gleisation where the soils were endosaturated for long time. Gray soil colour with chroma of 2 or less indicates that the soils has impeded drainage. The particle size distribution was generally fine loamy. The topsoil texture ranged from silty clay loam to silty clay, while the low layers varied from clay loam to loam and sandy loam. The soil structure was angular blocky, while the consistency ranged from firm to very firm, sticky and plastic.
Table 2. Soil morphological characteristics
Horizon Depth (cm) Colour Texture Structure Consistence Horizon Boundary
Profile EK 1
Ap 0-14 2,5Y 3/2 SiCL sb t; s, p c, s
Bg1 14-46 5Y 6/1 SiC sb t; s, p g, s
Bg2 46-90 5Y 7/1 CL sb t; s, p g, s
Bg3 90-115 5Y 6/1 L sb t; s, p g, s
BCg 115-150 5Y 7/1 CL sb t; s, p
Profile EK 2
Ap 0-15 2,5Y 3/2 SiC sb st; s, p g, s
Bg1 15-48 5Y 5/1 SiCL sb t; s, p g, s
Bg2 48-80 5Y 5/1 CL sb t; s, p g, s
Bg3 80-120 5Y 6/1 SL sb t; ss, po c, s
BCg 120-150 5Y 7/1 SL sb t; ss, po
Profile EK 3
Ap 0-17 2,5Y 4/1 SiC sb t; s, p g, s
Bg1 17-36 5Y 5/1 SiCL sb t; s, p c, s
Bg2 36-62 5Y 6/1 CL sb t; s, p g, s
Bg3 62-108 5Y 6/1 L sb t; s, p g, s
BCg 108-150 5Y 7/1 L sb t; s, p
Remarks: texture: L = loam, CL = clay loam, SiCL = silty clay loam, SiC = silt clay, SL = sandy loam; Structure: sb = angular blocky; consistency: st = very firm, t = firm, ss = somewhat sticky, s = intently, po = not plastic, p = plastic; horizon boundary: c = clear, g = gradual, s = flat
Soil mineralogical properties
Results of mineral analysis of sand fraction of the profile EK 3 showed that the soils formed from alluvium parent materials were dominated by quartz mineral (79-82%). Opaque, limonite, rock fragments, sanidin, glaukofan, and enstatit minerals were found in small amounts (average of
weathering. The long-term potential of soil fertility was low because it was not supported by
sufficient reserves of nutrients caused by the low content of easily weathered minerals in the soil.
Table 3. Mineral composition of sand fraction in the soils studied
Profile Horizon Depth Minerals of total sand fraction (%)
(cm) Op Ku Ln Lm Fb Sn Mk Bt Hb Ep Gk En
EK 3 Ap 0-17 3 80 2 sp 1 11 - - sp sp 2 1
Bg1 17-36 4 80 1 sp 1 10 sp - sp sp 1 3
Bg2 36-62 6 79 1 sp sp 9 - sp sp sp 2 3
Bg3 62-108 6 81 sp sp sp 7 sp sp sp sp 3 3
BCg 108-150 4 82 1 sp 2 6 sp sp sp sp 3 2
Remarks: Op = opaque, Ku = quartz, Ln = limonite, Lm = mineral weathering, Fb = rock fragment, Sn = sanidin, Mk = muscovite, Bt = biotite, Hb = hornblende, Ep = epidote, Gk = glaukofan, En = enstatit, sp = sporadic (<1%)
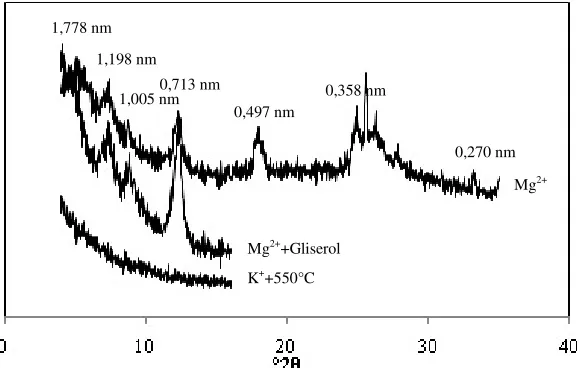
Mineral composition of clay fraction as dominated by kaolinite followed by hydrate halloysite, interstratified illite-vermiculite and smectite in the moderate amounts, and small amount of hematite (Figure 1). The present of kaolinite mineral was shown by X-ray diffraction peak of 0.713 nm (order 1) and 0.358 nm (order 2) at saturation treatment of Mg2+ and Mg2+ + glycerol, and its peak diffraction was lost / collapse by treatment with K+ + 550°C heating. Hydrate halloysite was characterized by X-ray
diffraction peak of 1.005 nm (order 1) and 0.497 nm (order 2) in the treatment of Mg2+and Mg2++ glycerol, and its peak diffraction was lost / collapse by treatment with K+ + 550°C heating. Interstratified illite-vermiculite was shown by X-ray diffraction peak of 1.198 nm in the treatment of Mg2+,whereas smectite with diffraction peak of 1.778 nm was shown in the treatment of Mg2++ glycerol. Hematite was shown by X-ray diffraction peak of 0.270 nm.
Figure 1. X-ray diffractograms for Bg1 horizon of EK3 profile
Soil physical properties
Soil bulk density was low (0.78 to 0.95 g / cm3), while the total pore space was high (46.4 to 57.4%). Retention of water at a pressure of 33 kPa or field capacity (pF 2.54) ranged from 31.2 to 38.8%, while the retention of water at a pressure of 1,500 kPa or permanent wilting point (pF 4.2) ranged from 19.1 to 28 , 1% (Table 4).
Available water pores were moderate (from 10.3 to 16.1%), except for Ap horizon of the EK1 profile which had low available water (8.0%). The permeability of the soil profiles studied quite varied. Ap horizon of EK1 and EK2 profiles had slow permeability (from 0.10 to 1.50 cm / h), while the Bg horizon had moderate permeability (4.85 cm / h) to fast (11.46 to 13.51 cm /h). 1,198 nm
1,005 nm0,713 nm 1,778 nm
0,497 nm
0,358 nm
0,270 nm
Mg2+
Mg2++Gliserol
Table 4. Soil physical properties
30-60 0.91 54.9 33.5 22.0 11.5 4.85
EK 2 0-30 0.79 54.9 38.8 22.7 16.1 1.50
30-60 0.82 57.4 36.8 24.4 12.3 11.46
EK 3 0-30 0.78 56.1 34.8 24.5 10.3 14.05
30-60 0.83 56.3 31.2 19.1 12.1 13.51
Soil chemical properties
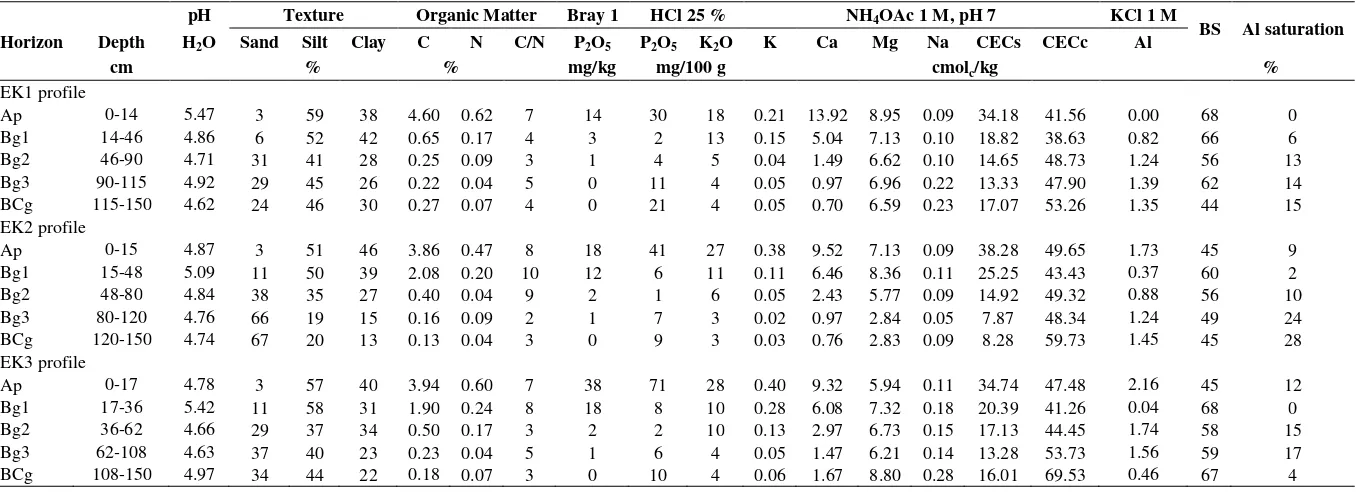
The soils studied had relatively high clay and silt contents, i.e. 38-46% and 51-59% in the upper layer, 5-42% and 19-58% in the lower layers (Table 5). This indicates that the top layer of the soils studied had finer particle size distribution than the lower layer. Soil reaction of the soil profiles studied was relatively acid (pH 4.62 to 5.47). The low soil reaction indicates that the soil forming materials were derived from weathering of sedimentary rocks or acid old volcanic materials that were carried away by the flow of water and depositing in alluvial plains. The low soil reaction was influenced by the kaolinite mineral. The contents of organic C and total N in the were high (3.86 to 4.60% and 0.47-.62%) in A horizon and low (0.2-2% and 0.04 to 0.24%) in B horizon. The high content of organic C in the A horizon was caused by frequent water saturation process so that the decomposition of organic matter was slow. The acidity of soils studied were not in line with the content of bases, especially exchangeable Ca and Mg, and their base saturation. Ca content was high in the A horizon (9.32 to 13.92 cmolc / kg) and low to moderate
(0.70 to 6.46 cmolc / kg) in the horizon B. Mg
content was high (2.83 to 8.95 cmolc / kg). Base
saturation was moderate to high (44-68%). The high bases (Ca and Mg) and base saturation were caused by the presence of mineral type 2:1 smectite that supplied Ca and Mg in the soil solution. In addition, the high content of exchangeable Ca was thought to be caused by the addition of Ca-rich material from over flowing river water. The content of P2O5(Bray 1 extract)
was moderate to high (14-38 mg / kg) in the A horizon and a low to moderate (1-18 mg / kg) in the horizon B. The content of P2O5 (HCl 25%
extract) was moderate to high (30-71 mg / 100g) in horizon A and very low (2-11 mg / 100g) in
horizon B, while K2O (HCl 25% extract) was
moderate (18-28 mg / 100g) in the A horizon and low (3-13 mg / 100g) in horizon B. Cation exchange capacity (CEC) of the soil was high (34-38 cmolc / kg) in the A horizon and low to
moderate (8-20 cmolc / kg) in the horizon B.
Exchangeabe aluminum and Al saturation were generally low to moderate. Exchangeabe Al content ranged from 0 to 2.16 cmolc / kg, while
the Al saturation ranged from 0 to 28%. The high value of the CEC, particularly in the upper layer, was influenced by the presence of smectite and interstratified illite-vermiculite mineral in moderate amount.
Soil classification
Journal of Degraded and Mining Lands Management 600 Table 5. Soil chemical properties
pH Texture Organic Matter Bray 1 HCl 25 % NH4OAc 1 M, pH 7 KCl 1 M
BS Al saturation
Horizon Depth H2O Sand Silt Clay C N C/N P2O5 P2O5 K2O K Ca Mg Na CECs CECc Al
cm % % mg/kg mg/100 g cmolc/kg %
EK1 profile
Ap 0-14 5.47 3 59 38 4.60 0.62 7 14 30 18 0.21 13.92 8.95 0.09 34.18 41.56 0.00 68 0 Bg1 14-46 4.86 6 52 42 0.65 0.17 4 3 2 13 0.15 5.04 7.13 0.10 18.82 38.63 0.82 66 6 Bg2 46-90 4.71 31 41 28 0.25 0.09 3 1 4 5 0.04 1.49 6.62 0.10 14.65 48.73 1.24 56 13 Bg3 90-115 4.92 29 45 26 0.22 0.04 5 0 11 4 0.05 0.97 6.96 0.22 13.33 47.90 1.39 62 14 BCg 115-150 4.62 24 46 30 0.27 0.07 4 0 21 4 0.05 0.70 6.59 0.23 17.07 53.26 1.35 44 15 EK2 profile
Ap 0-15 4.87 3 51 46 3.86 0.47 8 18 41 27 0.38 9.52 7.13 0.09 38.28 49.65 1.73 45 9 Bg1 15-48 5.09 11 50 39 2.08 0.20 10 12 6 11 0.11 6.46 8.36 0.11 25.25 43.43 0.37 60 2 Bg2 48-80 4.84 38 35 27 0.40 0.04 9 2 1 6 0.05 2.43 5.77 0.09 14.92 49.32 0.88 56 10 Bg3 80-120 4.76 66 19 15 0.16 0.09 2 1 7 3 0.02 0.97 2.84 0.05 7.87 48.34 1.24 49 24 BCg 120-150 4.74 67 20 13 0.13 0.04 3 0 9 3 0.03 0.76 2.83 0.09 8.28 59.73 1.45 45 28 EK3 profile
Ap 0-17 4.78 3 57 40 3.94 0.60 7 38 71 28 0.40 9.32 5.94 0.11 34.74 47.48 2.16 45 12 Bg1 17-36 5.42 11 58 31 1.90 0.24 8 18 8 10 0.28 6.08 7.32 0.18 20.39 41.26 0.04 68 0 Bg2 36-62 4.66 29 37 34 0.50 0.17 3 2 2 10 0.13 2.97 6.73 0.15 17.13 44.45 1.74 58 15 Bg3 62-108 4.63 37 40 23 0.23 0.04 5 1 6 4 0.05 1.47 6.21 0.14 13.28 53.73 1.56 59 17 BCg 108-150 4.97 34 44 22 0.18 0.07 3 0 10 4 0.06 1.67 8.80 0.28 16.01 69.53 0.46 67 4
Journal of Degraded and Mining Lands Management 601 Land potential and constraints
Results of land suitability evaluation based land suitability criteria for cocoa by BBSDLP (2011) showed that the soils studied were marginally suitable (S3) for the development of the cocoa plant with limiting factors of impeded drainage, acid soil reaction (pH <5.5), and low K2O (HCl
25% extract) (15-20 mg / 100g). The potential reserves of mineral nutrients from easily weathered was quite low, but the fertility of the soil was still quite good because the soil still contained high exchangeable Ca and Mg in the top layer, and in the top soil CEC and base saturation were moderate to high. The main obstacle for the management of the soils for cocoa plant was the impeded land drainage. Soils with impeded drainage can cause to disturbed growth and development of roots that leads to the low production of cocoa plant. Making drainage channel can be done to improve the carrying capacity of the soil for the development of the cocoa plant.
Conclusion
The mineral composition of sand from soils developed from alluvium in the cocoa production centre of East Kolaka was dominated by quartz mineral, while clay minerals were composed of kaolinite, hydrate halloysite, interstratified illite-vermiculite and smectite. The soils were characterized by silty clay loam to silty clay in the top soil, low bulk density, acid soil reaction, high organic C and P2O5 content in A horizon,
moderate to high base saturation and CEC. At the family level, the soils were classified as Fluvaquentic Endoaquepts (EK1 profile) and Typic Endoaquepts (EK2 and EK3 profiles), finely loam, acid mix, isohyperthermic. The soils were marginally suitable (S3) for the development of the cocoa plant with limiting factors of impeded drainage, acid soil reaction, and low K2O
content.
References
Balai Besar Penelitian dan Pengembangan Sumberdaya Lahan Pertanian (BBSDLP). 2011. Petunjuk Teknis Evaluasi Lahan untuk Komoditas Pertanian. Edisi Revisi. Balai Besar Penelitian dan Pengembangan Sumberdaya Lahan Pertanian. Bogor.
Buol, S.W., Hole, F.D. and McCraken, R.J. 1980. Soil Genesis and Classification. The Iowa State University Press.
Buurman, P. 1990. Chemical, physical, and mineralogical characteristics for the soil database.
Tech. Report No.7, Version 2.1. LREPP Part 2, Soil Data Base Management. CSAR. Bogor.
Dinas Pertanian, Kehutanan, dan Perkebunan Kabupaten Kolaka Timur. 2014. Rekapitulasi Luas Areal Produksi, Produktivitas dan Jumlah Petani Perkebunan Rakyat Kabupaten Kolaka Timur Tahun 2013. Dinas Pertanian, Kehutanan, dan Perkebunan Kabupaten Kolaka Timur.
Food and Agriculture Organization (FAO). 1976. A Framework for Land Evaluation. FAO Soil Bull. No. 32. Rome.
Goenadi, D.H., Baon, J.B. and P.A. Herman, P.A. 2005. Prospek dan Arah Pengembangan Agribisnis Kakao di Indonesia. Badan Penelitian dan Pengembangan Pertanian. Jakarta.
Rossiter, D.G. 1996. A theoretical framework for land evaluation. Discussion Paper. Geoderma, 72 : 165-190.
Schmidt, F.H. and Ferguson, J.H.A.. 1951. Rainfall types based on wet and dry period ratios for Indonesia and Western New Guinea. Verh. 42. Jaw. Meteo. dan Geofisik. Jakarta.
Soil Survey Division Staff. 1993. Soil Survey Manual. USDA Handbook No.18. United States Department of Agriculture, Washington DC.
Soil Survey Laboratory Staff. 2004. Soil Survey Laboratory Methods Manual. Soil Soil Investigation Report No. 42. NRCS-USDA. Soil Survey Staff. 2014. Keys to soil taxonomy. 12thed.
Natural Resources Conservation Service. USDA. Washington DC.
Sulaeman, Suparto, and Eviati. 2005. Petunjuk Teknis Analisis Kimia Tanah, Tanaman, Air, dan Pupuk. Balai Penelitian Tanah, Bogor.
Sys, C. 1978. Evaluation of land limitations in the humid trpoics. Pedologie, XXVIII-3:307-335. van Reeuwijk, L.P. 1993. Procedures for Soil Analysis.
Four Edition. ISRIC, Wageningen. Netherlands. Zhang, B., Zhang, Y., Chen, D., White, R.E. and Li, Y.
2004. A quantitative evaluation system of soil productivity for intensive agriculture in China.