L
Journal of Experimental Marine Biology and Ecology 243 (2000) 17–43
www.elsevier.nl / locate / jembe
Modelling somatic growth in the sea urchin Evechinus
chloroticus (Echinoidea: Echinometridae)
*
Miles D. Lamare , Philip V. Mladenov
Department of Marine Science, University of Otago, P.O. Box 56, Dunedin, New Zealand Received 30 March 1999; received in revised form 2 July 1999; accepted 20 July 1999
Abstract
Somatic growth was examined in two populations of the sea urchin Evechinus chloroticus (Valenciennes). Growth was quantified for smaller urchins (,10 mm test diameter (TD)) through laboratory rearing and in situ airlift sampling of newly settled juvenile cohorts, and for larger individuals (.10 mm TD) by calcein tagging and recapture. Newly settled urchins grew to a mean size at 1 year of 8.05 mm TD in the laboratory and an estimated 10.5 mm TD in the field. Growth of newly settled urchins appeared to be biphasic with a period of slow growth (0–200 days post-settlement), followed by accelerated growth. Larger, calcein tagged individuals were recaptured 1 year after tagging and their growth modelled using three asymptotic growth functions (Brody-Bertalanffy, Richards and Jolicoeur) and one non-asymptotic function (Tanaka). A second sample of tagged urchins was recovered from one of the sites 3.9 years after the initial tagging. Evaluation of each growth model was made using (1) sum of the squares residual values of the difference equation regressions for each growth function (2) an examination of the regression residuals (3) a comparison of the predicted versus observed size at age at 1 year for E. chloroticus sampled in Doubtful Sound, and (4) a comparison of the predicted growth of urchins over 3.9 years, with the observed growth in the urchins recovered 3.9 years post-tagging. The sample taken 3.9 years after tagging also allowed us to examine whether growth is asymptotic in the larger size classes. While growth does not appear to be be asymptotic, we found the Richards function best described growth in E. chloroticus overall. Using this model, the test diameters of individuals at ages 1 to 6 years are about 10, 25, 40, 55, 65 and 72 mm TD, respectively. 2000 Elsevier Science B.V. All rights reserved.
Keywords: Growth; Sea urchin; Echinoid; Evechinus chloroticus
*Corresponding author. Present address: Friday Harbor Laboratories, University of Washington, 620 University Road, Friday Harbor, WA 98250, USA.
E-mail address: [email protected] (M.D. Lamare)
1. Introduction
Growth rate is a critical parameter of the population dynamics of a species. For many populations of marine invertebrate species, however, accurate estimates of growth rate are lacking. This is due, in part, to the difficulties associated with sampling, monitoring and tagging individuals in marine populations. A further problem is the application of a suitable growth model to marine invertebrate populations (Ebert and Russell, 1993).
These problems apply to investigations into the growth of sea urchin species (Echinodermata: Echinoidea). Gage and Tyler (1985) highlighted this fact when analysing growth ring counts in the deep water sea urchin, Echinus affinis. Using five different growth models, they found differences in predicted juvenile growth and asymptotic size depending on the growth model applied. A similar result was found by Ebert and Russell (1993) when analysing growth of Strongylocentrotus franciscanus using three growth models. These latter workers noted that asymptotic growth functions may not be appropriate when modelling sea urchin species if they continue to grow throughout their lifetime. Furthermore, of the S-shaped growth models used to describe sea urchin growth, all but one are symmetrical. For this reason, the first limb (early growth) and second limb (later growth) of the curve are not independent and, hence, growth of juveniles and adults is linked (Gage and Tyler, 1985; Ebert and Russell, 1993).
In this study, we examine growth of the New Zealand sea urchin, E. chloroticus, in two populations. Growth in very small sea urchins (,1 year old) was measured by in vitro rearing and the analysis of size frequency distributions of newly settled urchins in the field. Older sea urchins (.1 year old) were tagged in situ using a fluorescent dye, and growth after 1 year modelled using four growth models. Three of the models are asymptotic growth functions, the Brody-Bertalanffy growth model (von Bertalanffy, 1938; Brody, 1945)
2Kt
St5S`
s
12bed
(1)the Richards growth model (Richards, 1959)
2n
2Kt
St5S`
s
12bed
(2)and the Jolicoeur model (Jolicoeur, 1985)
2K21
St5S`
s
12btd
(3)where St5size at time t, S`5asymptotic size, b5scaling parameter to adjust for size
±0 at time 0, K5growth constant and n5shape parameter for the Richards model. The
fourth model applied was the Tanaka growth model (Tanaka, 1982, 1988)
]]]]
To ascertain whether growth in E. choroticus is asymptotic, we resampled one of the populations 3.9 years after the initial tagging. These data also allowed us to compare observed growth rates over the 3.9 years with predicted growth over the same period for each growth model. We use these comparisons to assess growth estimates for E.
chloroticus in each of the studied populations, and discuss the appropriateness of using
asymptotic and non-asymptotic growth functions for modelling growth in this species.
2. Materials and methods
2.1. Study sites
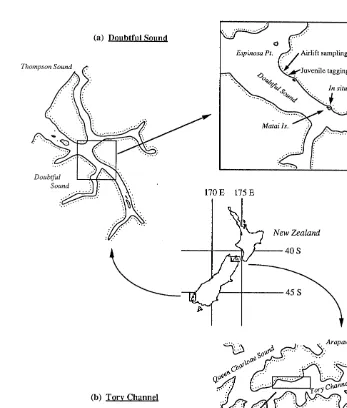
One of the populations of Evechinus chloroticus occurs at Espinosa Point (1668 58’ 450 E, 458 189 000 S) within the Doubtful-Thompson-Bradshaw Sound complex (Fig. 1a), which is approximately 110 km long in total, and 2 km wide with a 40 km main channel and five secondary arms. The other population occurs in Titi Bay (1748119400
E, 418 149 150 S) within Tory Channel, Marlborough Sounds (Fig. 1b), an open waterway 20 km long and an average of 2 km wide, with a maximum depth of 50 m.
2.2. Growth estimates
2.2.1. Early Evechinus chloroticus growth (,1 year)
Newly settled E. chloroticus juveniles were obtained from stocks of larvae reared in the laboratory. Competent larvae were pipetted into small plastic containers containing 400 ml of 158C, 45mm millipore filtered seawater and a number of small coralline algae encrusted pebbles. Twenty-four hours after the transfer of larvae, the pebbles were examined under a dissecting microscope, and the test diameters (TD) of the newly metamorphosed sea urchins were measured to the nearest 0.01 mm. Subsequent measurements of test diameters were made at 2-week to 2-monthly intervals for 1 year. The measurements of any individuals that died within the year were excluded from all growth estimates. Water temperature was kept at 158C, and 50% of the water was replaced with filtered seawater every 2 weeks. At this time, all pebbles free of sea urchins were replaced with freshly collected coralline encrusted pebbles.
Growth rates of juveniles (,10 mm TD) in the field were calculated from changes in the size-frequency distribution of newly settled urchins in Doubtful Sound and Tory Channel (Fig. 1) between 27 January 1993 and 23 July 1993. On each sampling date,
2
Fig. 1. Map showing the location of airlift sampling, juvenile calcein tagging and in situ calcein tagging of E.
chloroticus in Doubtful Sound (a) and Tory Channel (b).
2.2.2. Evechinus chloroticus tagging and recapture
Evechinus chloroticus were tagged with the fluorescent dye, calcein, using a working
peristomeal membrane. Administration of the dye was done in situ by SCUBA divers using an adjustable dose, automatic refilling syringe, fitted with a 16-gauge hypodermic needle. Tagging of 250–300 E. chloroticus was done on 2 December 1993 in Doubtful Sound, and for 800–900 individuals on 19 and 20 April 1994 in Tory Channel.
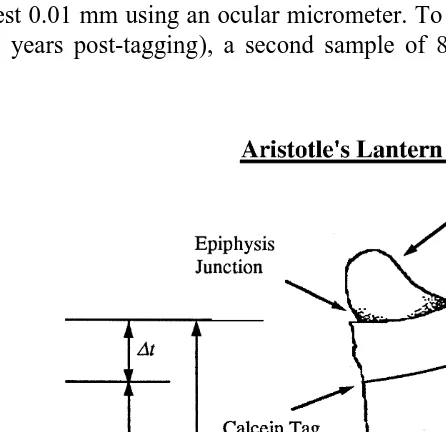
Doubtful Sound was first revisited on 1 December 1994 (365 days post-tagging) when 167 E. chloroticus ranging in size from 43 to 116 mm TD were collected from the tagging site. Tagged sea urchins were removed from the Tory Channel site on 12 April 1995 (358 days post-tagging), with 196 urchins ranging in size from 28 to 95 mm TD collected. On these days, sea urchins were collected by SCUBA, bagged and returned to the field station for processing. For each animal, the TD was measured to the nearest millimetre using knife-edged vernier calipers, and the Aristotle’s lantern dissected out. Later, each Aristotle’s lantern was cleaned and disassembled by soaking in 5% sodium hypochlorite. The samples were air dried for 3–4 days and the size (to the nearest 0.1 mm) of one of the demi-pyramids measured from the oral tip to the epiphysis junction (Fig. 2). Each lantern was then inspected under a dissecting microscope that was illuminated by an external ultraviolet light source. If a fluorescent tag was detected (Fig. 2), then the distance between the oral tip and the point where the calcein tag met the external edge of the demi-pyramid (Jt) was measured (Fig. 2). Measurements were made to the nearest 0.01 mm using an ocular micrometer. To assess growth over a longer time period (3.9 years post-tagging), a second sample of 83 E. chloroticus ranging in size
Fig. 2. Measurements made on the Aristotle’s lantern demi-pyramid to estimate change in lantern size in E.
chloroticus following calcein tagging. The previous position of the epiphysis junction (Jt) is represented by the
from 46 to 103 mm TD were collected from the Doubtful Sound site on 17 November 1997. Logistical constraints did not allow a second sample to be taken from the Tory Channel site.
As calcein is incorporated into the sites of active calcium deposition (Fig. 2), the position of the tag represents the size of the lantern at the time of the tagging, Jt. The size of the lantern at the time of the measurement represents size at Jt1 Dt, in this case
Dt being 1 year for the first samples, and 3.9 years for the second of the Doubtful Sound
samples. In order to convert these data on changes in lantern size to changes in sea urchin size, the relationship between the demi-pyramid length and test diameter was established over the range of E. chloroticus sampled. For each population, demi-pyramid length (J ) was converted to test diameter (TD) using the non-linear, logarithmic equation
TD5c1mln J (5)
with the homogeneity of slopes between both sites tested using ANCOVA. Thus Jt was converted to test diameter at the time of tagging (TDt) and harvest (TDt1Dt).
2.3. Estimating growth model parameters
For each site, the paired measurements of initial (TDt) and final (TDt1 Dt) test
diameters were analysed using Walford plots (Walford, 1946). The relationship between the initial and final sizes can be established for each of the four growth models using the appropriate linear or non-linear difference (or regression) equation.
2.3.1. Brody-Bertalanffy growth function
Parameters for the Brody-Bertalanffy function;
2Kt
St5S`
s
12bed
(6)were estimated using the linear regression model, y5c1mx of initial and final sizes
(Walford, 1946), where y5final size (TDt1 Dt) and x5initial size (TDt), and the slope
2Kt
of the regression, m5e . Therefore
c
where t5time between initial and final measurements and
S0
]
b512 (9)
S`
where S05size at settlement. Newly settled urchins reared in the laboratory were found to have a test diameter of 0.4 mm. Therefore, S0 was replaced by 0.4 mm when estimating growth of the test diameter and the difference model only estimated S and K.`
2Kt
were estimated using a non-linear regression model for the difference equation
2n
Parameters for the difference equation were estimated by the simplex method using the SYSTAT statistical package (Wilkinson, 1989), with a model
(21 / N ) 2N
Y5(C1(V *(X ))) (16)
where v5m, c5c, N5n, and X and Y are the initial and final test diameters,
respectively.
Instantaneous growth rates (I ) were calculated using the equation
2Kt 2Kt2n21
I5 2S nbKe`
s
12bed
(17)2.3.3. Jolicoeur growth function
Parameters for the Jolicoeur growth function
2K21
St5S`
s
12btd
(18)were estimated using a non-linear regression model for the difference equation
Parameters of the difference equation were estimated by the simplex method using the SYSTATstatistical package (Wilkinson, 1989) with a model
Y5SM /(12(((SO2SM ) /SO )?(((((X2SM ) /(((SO2SM ) /SO )
(21 / K ) 2K )
?X ))) )11) ) (21)
where Y5final size (TDt1 Dt), X5initial size (TDt), SM5S , SO` 5S0 and K5K
(Ebert and Russell, 1993).
Instantaneous growth rates (I ) were calculated using the equation
2K21 2K22
I5 2S bKt`
s
12btd
(22)2.3.4. Tanaka growth function
Parameters for the Tanaka growth function
]]]]
where c (age of maximum growth)5a /E and
]]]
E5exp
s
œ
f Ss 02ddd
(24)were estimated from a non-linear regression for the difference equation
]]
Parameters for the difference equation were estimated by the Quasi-Newton method using theSYSTAT statistical package (Wilkinson, 1989) with a model
Y51 / SQR(F )
1
and 1 / a is the maximum growth rate.
2.4. Comparison of growth functions
Evaluation of each growth model was made using (1) standard sum of the squares error residual (SSE) of the difference equation regressions, (2) an examination of the regression residuals, (3) a comparison of the predicted versus observed size at age 1 year for E. chloroticus sampled in Doubtful Sound, and (4) a comparison of the predicted growth of urchins over 3.9 years, with the observed growth in the urchins recovered 3.9 years post-tagging.
The comparison of observed growth over 3.9 years in Doubtful Sound with the models’ prediction of growth over the same period was made by converting the size of the lantern at the time of tagging to the test diameter at that time. Predicted growth of these tagged urchins for the 3.9 years after tagging was calculated using each of the four growth models. As an example, one recovered urchin was 82.2 mm TD at the time of tagging, which according to the Brody-Bertalanffy (B ), Richards (R ), Jolicoeur (J )B D L
and Tanaka (T ) growth models would have an age of BK B55.9 years, RD56.9 years,
JL57.7 years and TK58.9 years. This urchin was predicted to grow BB515.6 mm,
RD515.4 mm, JL512.6, and TK511.7 mm over the 3.9-year period. The individual actually grew 12.5 mm over the 3.9 years.
The relationship between the predicted and observed growth of the tagged urchins over the 3.9 years was examined using linear regression analysis. Assessment of each growth model was made by comparing the co-efficient of variation, standard sum of the squares error residual, the distribution of residuals, and the slope of the regression.
2.5. Mathematical and statistical calculations
All statistical analysis was carried out using theSYSTATstatistical package (Wilkinson, 1989).
3. Results
3.1. Early Evechinus chloroticus growth (,1 year)
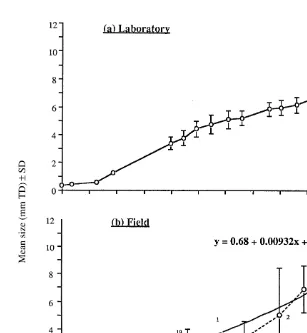
Five E. chloroticus individuals were kept alive for the entire year and their growth calculated from changes in test diameter over that period (Fig. 3a). The mean sea urchin TD (6SD) after 1 year was 8.0560.61 mm, with growth rates averaging 0.16 mm
21 21
Fig. 3. Change in the mean test diameter of newly settled E. chloroticus (6SD) reared in the laboratory (a) at 158C (n55), and sampled from Doubtful Sound (b). The number of individuals sampled on each date is indicated for the field samples. Sea temperatures in the field ranged from 10.9 to 14.08C during sampling.
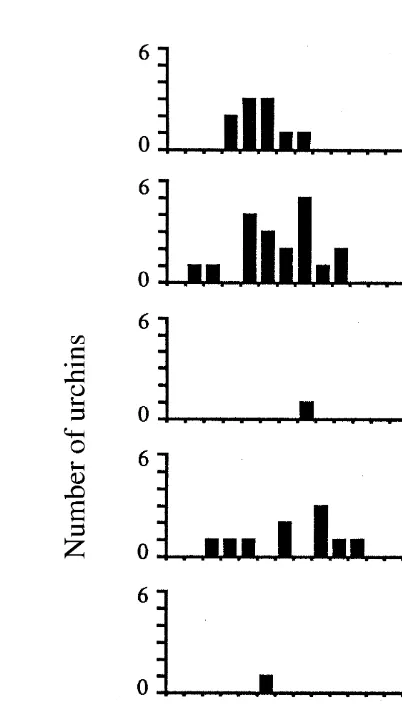
Only one early post-settlement sea urchin (1.48 mm TD) was recovered from airlift samples taken in Tory Channel, while a total of 50 early post-settlement sea urchins ranging in size from 0.96 to 9.50 mm TD were recovered from Doubtful Sound over the sampling period. Size-frequency distributions were generated for each of the Doubtful Sound samples (Fig. 4) and the mean size (6SD) of the juvenile cohort calculated for each sampling date. To calculate growth rate, the mean size (6SD) of the juvenile cohort on each sampling date was plotted against the time since the estimated day of juvenile settlement of the cohort, estimated from settlement samplers (Lamare (1997), as 1 November 1992 (Fig. 3B). The mean growth rate in the field over the sampling period
21 21
was 0.19 mm week , with a maximum growth rate of 0.51 mm week estimated between 27 June and 23 July 1993. Growth of the juveniles in the field appears to be
21
non-linear, with slow growth for the first ¯197 days (0.12 mm week ) followed by a
21
Fig. 4. Size distribution (0.5 mm TD size classes) of juvenile E. chloroticus collected from airlift samples taken in Doubtful Sound between 27 January 1993 and 23 July 1993. Total area sampled on each sampling
2
date58 m , n5number collected on each sampling date.
following 65 days. The average size of 1-year-old urchins in the field was estimated
2
from the non-linear curve, size (mm)50.6810.00932x10.0000485x , where x5days after settlement. An extrapolation of this curve gave an estimated average size of 10.5 mm test diameter for 1-year-old individuals.
3.2. Recovery of calcein tagged Evechinus chloroticus
Table 1
Summary of the tagging and recovery of Evechinus chloroticus in Doubtful Sound and Tory Channel using the fluorescent dye, calcein
Doubtful Sound Tory Channel
No. of sea urchins tagged (date) 250–300 (2 / 12 / 93) 800–900 (19 / 04 / 94)
Size range tagged (TD) (mm) 20–120 20–110
No. of sea urchins collected (date) 167 (1 / 12 / 94) 83 (17 / 11 / 97) 196 (12 / 04 / 95)
No. with calcein tags 63 25 46
% tagged 37.70 30.12 23.50
Size range collected (TD) (mm) 43–116 46–103 28–95
Size range of tagged urchins (TD) (mm) 48–112 66–103 45–89
Channel sample, smaller sea urchins were collected (down to 28 mm TD), but no urchins ,45 mm TD carried calcein tags.
3.3. Transforming demi-pyramid length to test diameter
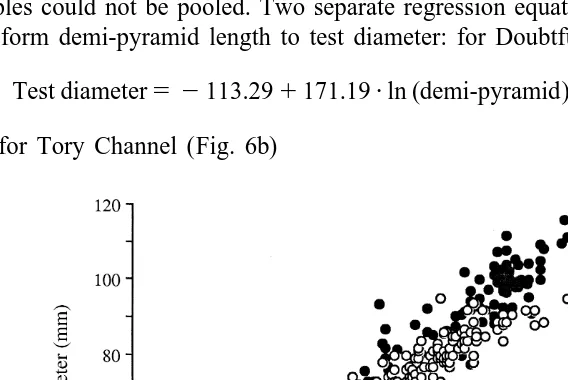
The relationship between test diameter and demi-pyramid length differed between sites (Fig. 5). Analysis of covariance of test diameter vs. ln(demi-pyramid length) between sites showed that the slopes were heterogeneous (P5 ,0.001, Table 2) and the samples could not be pooled. Two separate regression equations were therefore used to transform demi-pyramid length to test diameter: for Doubtful Sound (Fig. 6a)
Test diameter5 2113.291171.19?ln (demi-pyramid)
and for Tory Channel (Fig. 6b)
Table 2
Analysis of covariance of test diameter vs. ln (demi-pyramid length) for Evechinus chloroticus from Doubtful Sound (n5167) and Tory Channel (n5196); the dependent variable is ln (demi-pyramid length) and the covariant is test diameter
Homogeneity of slopes
Analysis of variance SS df MS F-ratio P
Location 0.080 1 0.080 86.828 0.000
Test diameter 18.896 1 18.896 20621.651 0.000
Location?test diameter 0.109 1 0.109 119.287 0.000
Error 0.329 359
Test diameter5 280.7611136.29?ln (demi-pyramid)
3.4. Growth models
3.4.1. Comparison of growth function parameters
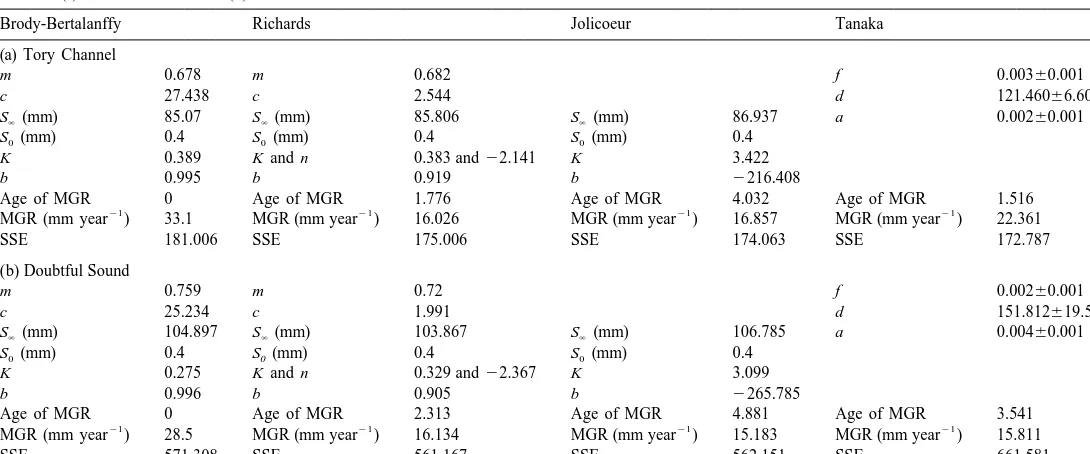
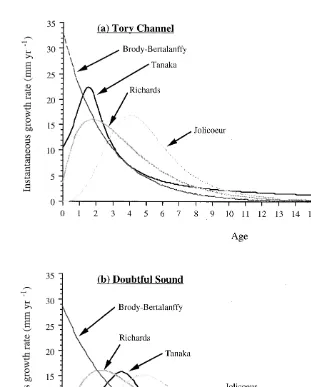
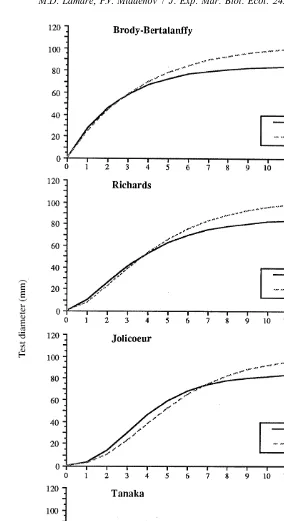
Demi-pyramid length was converted to test diameter, and E. chloroticus test diameter growth was modelled using Walford Plots of the initial and final size of tagged sea urchins from each site (Fig. 7). The parameters for each of the growth models were calculated from the regression analysis (Table 3), and growth rate at age (Fig. 8) and size at age estimated (Fig. 9).
3.4.1.1. Tory channel
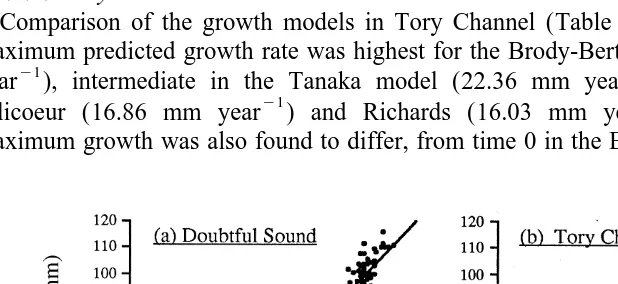
Comparison of the growth models in Tory Channel (Table 3a, Fig. 8a) showed the maximum predicted growth rate was highest for the Brody-Bertalanffy model (33.1 mm
21 21
year ), intermediate in the Tanaka model (22.36 mm year ) and lowest in the
21 21
Jolicoeur (16.86 mm year ) and Richards (16.03 mm year ) models. Age of maximum growth was also found to differ, from time 0 in the Brody-Bertalanffy model,
M
Estimated parameters for the Brody-Bertalanffy, Richards, Jolicoeur and Tanaka growth models for test diameter growth in tagged Evechinus chloroticus from Tory
a
Channel (a) and Doubtful Sound (b)
Brody-Bertalanffy Richards Jolicoeur Tanaka
SSE 181.006 SSE 175.006 SSE 174.063 SSE 172.787
(b) Doubtful Sound
m 0.759 m 0.72 f 0.00260.001
c 25.234 c 1.991 d 151.812619.526
S (mm)` 104.897 S (mm)` 103.867 S (mm)` 106.785 a 0.00460.001
SSE 571.308 SSE 561.167 SSE 562.151 SSE 661.581
a
m5slope, c5y-intercept, S`5maximum size, S05size at settlement, K5growth constant, b5scaling parameter to adjust for s±0 at settlement, MGR5
Fig. 8. Predicted changes in the instantaneous growth rate with age for E. chloroticus in Tory Channel (a) and Doubtful Sound (b) using the Tanaka, Richards, Jolicoeur and Brody-Bertalanffy growth models.
up to 4.03-years-old in the Jolicoeur model. For the three asymptotic growth functions, estimates of maximum test diameter were similar, ranging from 85.07 to 86.94 mm (Table 3a).
3.4.1.2. Doubtful sound
Maximum growth rates of urchins from Doubtful Sound (Table 3b, Fig. 8b) were
21
highest in the Brody-Bertalanffy model (28.5 mm year ), but varied little between the
21
Jolicoeur model. Maximum test diameter estimates were also found to vary little between the three asymptotic growth functions, ranging from 103.87 mm in the Richards model, to 106.79 mm for the Jolicoeur model (Table 3b).
A comparison of growth parameters between the two populations (Table 3) showed that the age of maximum growth was younger in Tory Channel, with maximum growth rates higher for Tory Channel for all but the Richards model. The rate of change in growth rate with time for Brody-Bertalanffy (KVB), Richards (KRD), Jolicoeur (K ) andJK
the Tanaka function ( f ), were consistently higher in Tory Channel urchins (KBB50.389,
KRD50.383, KJK53.422, f50.003) compared with Doubtful Sound (KBB50.275,
KRD50.329, KJK53.099, f50.002). Estimates of maximum test diameter for each of the asymptotic growth functions were consistently greater for E. chloroticus from Doubtful Sound compared with Tory Channel.
3.4.2. Size at age
When translating the differences in the growth model parameters in terms of size at age of E. chloroticus (Fig. 9), all four growth models predict individuals in Tory Channel will initially grow at higher rates, resulting in larger initial size at age compared with Doubtful Sound individuals. According to the models, growth rates will then decrease at both sites, with the decrease being more rapid in Tory Channel (larger K and
f values). The net result will be a transition, with Doubtful Sound individuals attaining a
larger size at age compared with Tory Channel individuals.
3.5. Evaluation of growth models
3.5.1. Residual standard sum of the squares error (SSE)
For Tory Channel, the residual SSE of the growth model regressions (Table 3a) was found to be highest for the Brody-Bertalanffy model (181.006). The SSE of the remaining growth models were all higher, but very similar in magnitude (172.787 to 175.006). For Doubtful Sound (Table 3b), SSE was lowest for the Richards (561.167), Jolicoeur (562.151) and Brody-Bertlanffy (571.308) models, and considerably higher in the Tanaka model (661.581).
3.5.2. Examination of residuals
The distribution of the residuals for each model (Fig. 10) is similar within each site. A significant difference, however, is the behaviour of the residuals in the larger size classes, particularly in Doubtful Sound. For all three asymptotic growth functions, the residuals of the larger sizes move from negative to positive, indicating growth is continuing beyond the maximum predicted size. In contrast, the residuals in the Tanaka model remain negative, the model allowing for continued growth of the larger size classes (although over-estimating growth of larger size classes).
3.5.3. Comparison of the predicted versus observed size at age 1
both sites (Table 4) range from 4.1 to 27.7 mm in Tory Channel and from 3.3 to 25.5 mm in Doubtful Sound, depending on the model. An alternative assessment was made by comparing the growth models’ predictions of growth in the first year in Doubtful Sound, with the independent measurements of early E. chloroticus growth made in the laboratory and from airlift samples (Table 4). A comparison of size at age 1 year shows the Richards growth model provided the closest fit to the observed growth rates. The Richards model estimates of size at 1 year of 8.58 mm TD (Doubtful Sound) and 10.42 mm TD (Tory Channel) are comparable to the 8.05 and 10.5 mm TD estimated from the laboratory and airlift samples, respectively. Both the Jolicoeur and Tanaka models underestimated the size at age 1, while the size predicted by the Brody-Bertalanffy model greatly exceeded that observed. Further comparison shows that the increase in growth rate over the first year indicated from the airlift samples was predicted in the Richards, Jolicoeur and Tanaka models, while the Brody-Bertalanffy model predicted growth would decrease over the first year.
3.5.4. Comparison of predicted with observed growth over a 3.9-year period
The relationship between observed and predicted growth of E. chloroticus (Fig. 11) was examined by linear regression analysis of observed and predicted growth over 3.9 years. A significant relationship (P,0.005) between the two existed for all four growth models (Table 5), with the residual standard sum of squares ranging from 335.33 for the Tanaka model to 1274.03 for the Richards model. For the three asymptotic growth models the slope of the regression did not differ significantly from a slope of 1.0 (t[23]#0.061, P.0.05), indicating that the mean predictions by these three models did not differ significantly from the actual growth rates. In contrast, the slope of the Tanaka model was significantly less than 1.0 (t[23]5 22.645, P,0.02), over-estimating growth in the larger size classes and under-estimating growth in the smallest size classes that were resampled.
A high degree of growth variability exists between individuals of the same size (Fig.
2
11), and resulted in low coefficient of variation (R ) values. Predictions from the Tanaka
2
model could only account for 46.1% (R 50.461) of the observed growth (Table 5), with the remaining three models predicting 42.1% (Brody-Bertalanffy), 42.8% (Richards) and 42.8% (Jolicouer) of the observed growth. The residuals of all four growth models were
Table 4
Estimates of size at 1 year and mean growth rate for Evechinus chloroticus in Tory Channel and Doubtful Sound using predictions from the Brody-Bertalanffy, Richards, Jolicoeur and Tanaka growth models, compared with estimates of growth from size-frequency analysis of airlifter samples, and growth of newly settled urchins in the laboratory
Brody-Bert. Richards Jolicoeur Tanaka Tory channel
Size at age 1 year (mm) 27.71 10.42 4.1 13.47
21
Mean growth rate (mm month ) 2.31 0.87 0.34 1.12
Doubtful Sound Airlift Laboratory
Size at age 1 year (mm) 25.54 8.58 3.34 5.94 10.5 8.05
21
Fig. 11. Observed growth over 3.9 years of E. chloroticus (n525), versus predicted growth over the same period using the Brody-Bertalanffy, Richards, Jolicoeur and Tanaka growth models. The solid line is the linear relationship between the observed and predicted growth. The dashed line represents a line with a slope of 1.
Table 5
Regression analysis of observed growth over 3.9 years of Evechinus chloroticus (n525) versus predicted growth over the same period using the Brody-Bertalanffy, Richards, Jolicoeur and Tanaka growth models
2
Model n Regression equation Residual SE of SE of ANOVA R
SSE slope intercept (dF, F, P)
Fig. 12. Distribution of residuals from the regression of observed growth over 3.9 years of E. chloroticus (n525), versus predicted growth over the same period for the Brody-Bertalanffy, Richards, Jolicoeur and Tanaka growth models.
evenly distributed around the x-axis, but increased in dispersion with increasing growth values (Fig. 12).
4. Discussion
¯
individuals to range between 2.1 and 4.2 mm (x53.264 mm). These individuals, in fact,
¯
increased in test diameter from 3.4 to 11.4 mm (x56.2 mm).
The comparison between predicted and observed growth over 3.9 years highlights one of the inadequacy of modelling asymptotic growth in E. chloroticus. Despite this, all three asymptotic growth functions modelled growth that was not statistically different from the observed growth over the 3.9 years. For these models, there was a significant regression between the observed and predicted growth rates (P,0.05), and the slope of linear regression did not differ significantly from 1.0 (P.0.05). For the Tanaka model, there was also a significant regression between the observed and predicted growth rates
P5(0.0002), although the slope of the line was significantly less than 1.0 (P,0.02). This reflects an over-estimation of growth in the larger size classes and under-estimation of growth in the smaller size classes, a result also found by McShane and Anderson (1997) when applying the Tanaka model to E. chloroticus.
Given these findings, we suggest that of the four models presented here, the Richards model best describes growth in E. chloroticus. This conclusion is subjective, but based on several important considerations. Firstly, the Richards model provides the closest prediction of size at 1 year. Model predictions of 10.42 mm TD in Tory Channel and 8.58 mm TD in Doubtful Sound were similar to the size of E. chloroticus observed in the laboratory (8.05 mm TD), and in Doubtful Sound (¯10.5 mm TD). In this respect, the large size at age 1 predicted by the Brody-Bertalanffy model excluded it from further consideration. Secondly, the Brody-Bertalanffy model predicted that growth in the first year decreases with age, contrary to the observations of early growth of E. chloroticus in the field. Thirdly, of the three remaining growth models, the sum of the squares errors was similar for all three models in Tory Channel, but considerably higher for the Tanaka model in Doubtful Sound. The Tanaka model tends to under-estimate growth in the smaller size classes and over-estimate growth in the larger size classes. Lastly, the onset of maturity is usually accompanied by a decrease in somatic growth as resources are channelled into gonad production. The Richards model predicts a decrease in somatic growth in Tory Channel after an age of 1.76 years (22 mm TD) and 2.31 years (30 mm TD) in Doubtful Sound, with growth decreasing rapidly after ages 3 to 4 years (40 to 50 mm TD). This is concordant with reported age at first reproduction in E. chloroticus. Macroscopic gonads were first produced at an age of 2.5 to 3 years (30–40 mm TD) (Lamare, 1997), with sexual maturity attained at 3–4 years (Dix, 1970), or a size of 40 to 50 mm TD (Dix, 1970; McShane et al., 1994). This degree of concordance was not observed at both sites using the remaining models.
The Richards model has been used to describe the growth of a number of sea urchin species (Ebert, 1980a, 1980b, 1982; Gage and Tyler, 1985; Russell, 1987; Ebert and Russell, 1992, 1993; Kenner, 1992), and the current study is the first application of the model to E. chloroticus. The Richards model describes a flexible S-shaped growth curve, ranging from the Brody-Bertalanffy Model (when the shape parameter, n5 21), the logistic function (when n5 11), to the Gompertz equation as theunuapproaches infinity (Ebert, 1980a). Reported values of n for sea urchins have ranged from 20.603 to
10.154 (mean n5 20.384) in 19 tropical and subtropical species (Ebert, 1982),
n5106.89 in the deep water species Echinus affinis (Gage and Tyler, 1985), from
Kenner, 1992), and from 20.3208 to 25.5636 (mean5 22.062) in S. franciscanus (Ebert and Russell, 1992, 1993). The range in n indicates that large variations in the shape of growth curves may exist for echinoids. The values of n obtained in the current study (22.141 and 22.367) are most similar to the northern temperate species, S.
franciscanus, and suggest growth in E. chloroticus has only a short initial lag phase (,1
year), followed by a rapid acceleration in growth preceding a long period of slower growth.
The growth of juvenile E. chloroticus in the first year was found to be an average of
21 21
8.05 mm year in the laboratory, and an estimated 10.5 mm year in the field. Growth in the field appears to be biphasic, with an initial period of slow growth (0–200 days post-settlement), followed by a period of accelerating growth. In contrast, growth rate in the laboratory increased in the first 150 days, but remained constant after this time. Early biphasic growth has previously been observed in newly settled sea urchins (Raymond and Scheibling, 1987; Rowley, 1990) and other echinoderm species (Birkeland et al., 1971; Yamaguchi, 1973, 1974, 1975; Barker, 1979; Zann et al., 1987) and is generally associated with a major shift in diet. In sea urchins this likely involves a shift from feeding on a microbial surface film, filamentous algae epiphytes and coralline algae to a diet of fleshy kelp and algal turf (Raymond and Scheibling, 1987; Rowley, 1990). For E.
chloroticus it is possible that for the first 150–200 days after settlement, juveniles feed
on the microbial surface film, filamentous algal epiphytes and coralline algae. Growth
21
rate over this period is between 0.52 and 0.79 mm month . Between 150 and 200 days, at a size of 3–4 mm TD, juveniles commence feeding on fleshy algae and algal turf.
21
Growth rate accelerates to ¯1.70 mm month , resulting in a size of 10–11 mm TD at 1 year. Following the slow initial growth phase, growth rate increases until the sea urchin reaches a size of around 40 to 50 mm TD when the sea urchins reach maturity, after which time growth rate decreases.
Previous estimates of E. chloroticus growth have been made for a number of geographic locations using a variety of methods and growth models (Table 6). Estimates from ring counts, change in size distribution, and the Richards function are comparable and suggest that the test diameters of E. chloroticus at ages 1 to 6 years are about 10, 25, 40, 55, 65 and 75 mm TD, respectively, although considerable geographic variation in
Table 6
Average estimates of size at age for Evechinus chlorticus from studies employing similar growth estimate techniques
Method Average test diameter (mm)
Age (years) 1 2 3 4 5 6
a
Ring counts 11 26.5 41 55 66.4 75.8
b
Size frequency distribution 10.5 Tag / recapture
b,c,d
Brody-Bertalanffy 21.8 38.4 51.3 61.5 69.5 75.8
b
Richards 9.5 24.6 40 53.6 64.3 72.5
growth is likely. Indeed, differences in the growth of E. chloroticus between Tory Channel and Doubtful Sound were apparent in this study. While size at age is similar in both populations in the first three years of growth, growth rates decreased more rapidly in Tory Channel. The differences in somatic growth become evident at onset of gonad production, between the ages of 3 and 4 years (40 –50 mm TD).
Differences in somatic growth have been attributed to variations in food quality and quantity in a number of sea urchin species (see review by Lawrence and Lane, 1982; Klinger et al., 1983; Andrew and Choat, 1985; Raymond and Scheibling, 1987; Levitan, 1988; Rowley, 1990), and is the likely cause of the growth differences observed in this study. Indicative of this is the fact that E. chloroticus has relatively larger Aristotle’s lanterns in Tory Channel compared to Doubtful Sound. The relative size of the Aristotle’s lantern has been correlated with food availability and density of conspecifics in a number of sea urchin species (Ebert, 1980b; Black et al., 1982, 1984; Levitan, 1991b; Edwards and Ebert, 1991). It is interesting to note that the lantern indices in both populations were similar in the smaller E. chloroticus size classes (40–50 mm TD), but showed increasing differences with increasing age. This mirrors differences in the growth of E. chloroticus between the two populations, with growth diverging after 50 mm TD.
In addition to spatial differences, large differences in growth rates of individuals within the Doubtful Sound population were evident. For example, three individuals with an initial size calculated as 72, 73 and 70 mm TD grew 23, 10 and 12 mm in diameter, respectively, over 3.9 years. Individuals over 100 mm TD had growth that ranged from 1.1 to 11.4 mm over the 3.9 years. Individual variability in growth of E. chloroticus within a site, and the degree that differences are due either to genetic variability within a population or to other factors, such as small scale habitat variation, is of interest and warrants further study.
Acknowledgements
Thanks to Paul Meredith, Paul Brewin, Daryl Coup, Brian Stewart, Jake Keogh and Paul Jones for technical assistance, and to Mike Barker for help with the identification of newly settled sea urchins. This paper benefited from comments from Mike Barker, Rachel Berquist, Paul McShane, Owen Anderson and Russell Miller. Research was funded by an Otago Research Grant provided by the University of Otago, New Zealand, and was generously supported by Fiordland Travel Limited (NZ).
References
Andrew, N.L., Choat, J.H., 1985. Habitat related differences in the survivorship and growth of juvenile sea urchins. Mar. Ecol. Prog. Ser. 27, 155–161.
Barker, M.F., 1979. Breeding and recruitment in a population of the New Zealand starfish Stichaster australis (Verrill). J. Exp. Mar. Biol. Ecol. 41, 195–211.
Birkeland, C., Chia, F.-S., Strathmann, R.R., 1971. Development, substratum selection, delay of metamor-phosis and growth in the seastar Mediaster aequalis Stimpson. Biol. Bull. 141, 99–108.
Black, R., Johnson, M.S., Trendall, J.T., 1982. Relative size of Aristotle’s lantern in Echinometra mathaei occurring at different densities. Mar. Biol. 71, 101–106.
Black, R., Codd, C., Hebbert, D., Vink, S., Burt, J., 1984. The functional significance of the relative size of Aristotle’s lantern in the sea urchin Echinometra mathaei (de Blainville). J. Exp. Mar. Biol. Ecol. 77, 81–97.
Brody, S., 1945. Bioenergetics and growth, Reinhold Publishing Corporation, New York.
Dix, T.G., 1970. Biology of Evechinus chloroticus (Echinoidea: Echinometridae) from different localities. 3. Reproduction. N.Z. J. Mar. F.W. Res. 4, 385–405.
Dix, T.G., 1972. Biology of Evechinus chloroticus (Echinoidea: Echinometridae) from different localities. 4. Age, growth, and size. N.Z. J. Mar. F.W. Res. 6, 48–68.
Ebert, T.A., 1980a. Estimating parameters in a flexible growth equation, the Richards Function. Can. J. Fish. Aquat. Sci. 37, 687–692.
Ebert, T.A., 1980b. Relative growth of sea urchin jaws: an example of plastic resource allocation. Bull. Mar. Sci. 30, 467–474.
Ebert, T.A., 1982. Longevity, life history, and relative body wall size in sea urchins. Ecol. Monogr. 52, 353–394.
Ebert, T.A., Russell, M.P., 1992. Growth and mortality estimates for red sea urchin Strongylocentrotus
franciscanus from San Nicolas Island, California. Mar. Ecol. Prog. Ser. 81, 31–41.
Ebert, T.A., Russell, M.P., 1993. Growth and mortality of subtidal red sea urchins (Strongylocentrotus
franciscanus) at San Nicolas Island, California, USA: problems with models. Mar. Biol. 117, 79–89. Edwards, P.B., Ebert, T.A., 1991. Plastic responses to limited food availability and spine damage in the sea
urchin Strongylocentrotus purpuratus (Stimpson). J. Exp. Mar. Biol. Ecol. 145, 205–220.
Gage, J.D., Tyler, P.A., 1985. Growth and recruitment of the deep-sea urchin Echinus affinis. Mar. Biol. 90, 41–53.
Jolicoeur, P., 1985. A flexible 3-parameter curve for limited or unlimited somatic growth. Growth 49, 271–281.
Kenner, M.C., 1992. Population dynamics of the sea urchin Strongylocentrotus purpuratus in a Central California kelp forest: recruitment, mortality, growth, and diet. Mar. Biol. 112, 107–118.
Klinger, T.S., McCarthy, B.M., Lawrence, J.M., 1983. The effects of food quantity and quality upon somatic and gonadal growth of Lytechinus variegatus Lamarck (Echinodermata: Echinoidea). American Zoologist. 23 (4), 964.
Lamare, M.D., 1997. Population biology, pre-settlement processes and recruitment in the New Zealand sea urchin Evechinus chloroticus Valenciennes (Echinoidea: Echinometridae). Ph.D. Thesis, University of Otago, New Zealand.
Lawrence, J.M., Lane, J.M., 1982. The utilization of nutrients by post-metamorphic echinoderms. In: Jangoux, M., Lawrence, J.M. (Eds.), Echinoderm Nutrition, A.A. Balkema, Rotterdam, pp. 331–371.
Levitan, D.R., 1988. Density-dependent size regulation and negative growth in the sea urchin Diadema
antillarum, Philippi. Oecologia 76, 627–629.
Levitan, D.R., 1991. Skeletal changes in the test and jaws of the sea urchin Diadema antillarum in response to food limitation. Mar. Biol. 111, 431–435.
McShane, P.E., Anderson, O., Gerring, P., Stewart, R., Naylor, J.R., 1994. Fisheries biology of kina(Evechinus
chloroticus) (New Zealand Fisheries Assessment Research Document No. 94 / 17). MAF Fisheries, New Zealand Ministry of Agriculture and Fisheries.
McShane, P.E., Anderson, O.F., 1997. Resource allocation and growth rates in the sea urchin Evechinus
chloroticus (Echinoidea: Echinometridae). Mar. Biol. 128, 657–663.
Raymond, B.G., Scheibling, R.E., 1987. Recruitment and growth of the sea urchin Strongylocentrotus ¨
droebachiensis (Muller) following mortalities off Nova Scotia. Can. J. Exp. Mar. Biol. Ecol. 108, 31–54.
Richards, F.J., 1959. A flexible growth function for empirical use. J. Exp. Bot. 10, 290–300.
Rowley, R.J., 1990. Newly settled sea urchins in a kelp bed and urchin barren ground: a comparison of growth and mortality. Mar. Ecol. Prog. Ser. 62, 229–240.
Russell, M.P., 1987. Life history traits and resource allocation in the purple sea urchin Strongylocentrotus
Tanaka, M., 1982. A new growth curve which expresses infinite increase. Publs. Amakusa mar. biol. Lab. 6, 167–177.
Tanaka, M., 1988. Eco-physiological meaning of parameters of ALOG growth curve. Publs. Amakusa Mar. Biol. Lab. 9, 103–106.
Walford, L.A., 1946. A new graphic method of describing the growth of animals. Biol. Bull. 90, 141–147. Walker, M.M., 1981. Influence of season on growth of the sea urchin Evechinus chloroticus. N.Z. J. Mar. F.W.
Res. 15, 201–205.
Wilkinson, L., 1989. SYSTAT. The System for Statistics, Systat, Evanston, IL.
Yamaguchi, M., 1973. Early life histories of coral reef asteroids, with special reference to Acanthaster planci (L.). In: Jones, O.A., Endean, R. (Eds.), Biology and Geology of Coral Reefs, Vol. 2, Biology 1, Academic Press, New York, pp. 369–387.
Yamaguchi, M., 1974. Growth of juvenile Acanthaster planci (L.) in the laboratory. Pacific Science 28, 123–138.
Yamaguchi, M., 1975. Estimating growth parameters from growth rate data. Oecologia 20, 21–332. Zann, L., Brodie, J., Berryman, C., Naqasima, M., 1987. Recruitment, ecology, growth and behavior of
