Stochastic use of the LEACHN model to forecast nitrate
leaching in different maize cropping systems
M. Acutis
a,*, G. Ducco
b, C. Grignani
baDipartimento di Ingegneria Agraria e Agronomia del Territorio,Uni
6ersita`‘Federico II’di Napoli,Via Uni6ersita`100, 80055Portici(Na),Italy
bDipartimento di Agronomia,Sel
6icoltura e Gestione del Territorio,Uni6ersita` di Torino,Via L.da Vinci, 44 10095Grugliasco,Italy
Received 19 February 1999; received in revised form 3 December 1999; accepted 28 April 2000
Abstract
This paper proposes a stochastic application of a deterministic model (LEACHN) with the aim of forecasting the probability of exceeding given nitrate leaching levels for different cropping systems and soil hydrological characteris-tics. The understanding of the level of probability associated to the prediction of leaching is an important criteria for the judgement of cropping systems. After calibration of organic matter mineralization and nitrification rates in both a sandy-loam and a loamy soil of the Western Po river valley (Northern Italy), LEACHN was used as a stochastic tool to evaluate the meteorological variability and the spatial variability of hydrological parameters of a soil. Meteorological variability was generated using series of measured air temperature, rainfall and global radiation for a period of at least 15 years, and these were then expanded to 100 years using the climate simulator CLIMGEN. Soil variability was simulated using the scale factor approach. The scale factor mean and standard deviation were obtained in eight locations within a 1000-m2 area. The stochastic scale factors were applied to parameters a and b in
Campbell’s water retention function and to hydraulic conductivity. The following combinations of crops were simulated in the two soils: (a) continuous maize for silage (MM); (b) continuous maize for grain (MG); (c) a combination of late harvested Italian ryegrass and short cycle silage maize (LRM); and (d) early harvested Italian ryegrass and late maturing silage maize (ERM). The crops were fertilized with 200 or 300 kg N ha−1year−1(or 450
kg for MM) and submitted to three water regimes: no irrigation, irrigation on the basis of water balance and conventional irrigation, which resulted in the highest volume. The simulated leaching was higher when fertilization and irrigation inputs were higher. It was further reduced by the introduction of cover-crop and was higher in the sandy soil. All these factors interacted, creating different levels of nitrate loss risk, that ranged from a minimum leaching of 4 kg N ha−1year−1, with a 10% breakthrough probability of 16 kg N ha−1year−1(low fertilized and
irrigated ERM in the sandy-loam soil) to a maximum average leaching of 146 kg N ha−1 year−1 with a 10%
breakthrough probability of 235 kg N ha−1year−1(high fertilized, conventionally irrigated MM in the sandy soil).
The breakthrough probability curves associated to nitrate leaching are skewed, showing that lower than average values are more frequent than higher ones. The standard deviations of yearly leaching were closely correlated to the www.elsevier.com/locate/eja
* Corresponding author. Tel.: +39-011-6708776; fax: +39-011-6708798.
E-mail address:[email protected] (M. Acutis).
M.Acutis et al./Europ.J.Agronomy13 (2000) 191 – 206 192
means and were frequently greater than the means, particularly in the sandy soil. The stochastic simulation results offered the possibility of ranking cropping systems into classes of probability of exceeding a given value of leaching and the possibility of deriving suggestions for improved crop management. © 2000 Elsevier Science B.V. All rights reserved.
Keywords:Nitrate leaching; Stochastic model; Cropping systems; Breakthrough probability
1. Introduction
Several methods for assessing the risk of non-point-contamination of surface water and ground-water resources have been proposed. These differ in scale and complexity.
Simpler methods are based on indices. Such methods require a small number of input parame-ters and describe the system combining such in-dices in a final assessment of pollution risk or groundwater vulnerability. Some indices have been developed specifically for nitrogen pollution risk (Giardini and Giupponi, 1993; Bockstaller et al., 1997) and are also used as a technical support to apply regional policy rules (Regione Emilia-Romagna, 1993).
A more fundamental approach is based on the application of water and nutrient balance calcula-tions, coupled with solute transport models, at different spatial and temporal scales (Donatelli et al., 1994; Corwin and Wagenet, 1996; Donatelli et al., 1999). Input parameters are more detailed and difficult to measure, but the results are numerical estimates, which quantify the polluting mass flow. It is now widely understood that the use of numerical models offer some very important and well-known advantages (an increase in the level of understanding of the physical processes, an in-crease in the possibility of synthesizing the current level of knowledge, etc.), however the uncertainty of the final results must be carefully considered. Models are imperfect tools because of errors due to the simplification of physical processes, errors in parameter values, and numerical errors. More-over, most models fail to account for naturally existing heterogeneity (Wu et al., 1997) and for the implication of both spatial and temporal variability.
Nevertheless, farmers or environmentalists can-not wait for the setting up of perfect models (Stockdale et al., 1997) and models are often
proposed as important tools for forecasting infor-mation in decision-making for environmental management (Hoogenboom et al., 1994; Ceccon et al., 1995; Jame and Cutforth, 1996; Girondel and Arondel, 1997). Some information on spatial and temporal variability associated to model re-sults is therefore strongly needed (Loague and Corwin, 1996).
Overall variability is generated by: (a) soil spa-tial variability (in particular for hydrological parameters and the type and quantity of organic matter); (b) climatic temporal variability over the years (evapotranspiration vs. precipitation bal-ance is often considered as the driving variable); and (c) anthropic management through different cropping systems (crop type, fertilization, irriga-tion, soil tillage, etc.). Several works have been carried out at a regional or basin scale that take the spatial variability between soils into account (Connolly et al., 1997; Richter et al., 1998), but not that within a soil, which might be very impor-tant (Warrick, 1990; Schulz and Huwe, 1997).
The scale at which these models are used has changed greatly over the last 40 years (Addiscott and Tuck, 1996). Greater effort has been made more recently, in order to enhance modelling, towards the so-called ‘upscaling’, both in time and in space, and produce instruments that are useful to assess the risk of non-point pollution from agricultural systems (Wu et al., 1997).
The present study is a methodology proposal. A stochastic-mechanistic approach to predict the
N-NO3 leaching probability, for pedological
The model that was chosen is LEACHN (Hutson and Wagenet, 1992). The main soil parameters (hydraulic conductivity, retention curve) and me-teorological data are considered as stochastic vari-ables. The scaling factor approach (Miller and Miller, 1956) has been used to insert the stochastic variability of soil hydrological parameters into the model. This approach allows one to include the hydrological variability in a model through only one parameter, the scaling factor. The scaling theory has been extensively used since long (Sim-mons et al., 1979; Russo and Bresler, 1980; Rao et al., 1983; Warrick 1990): several works used the scaling factor for modelling (Peck et al., 1977; Warrick and Amoozegar-Fard, 1979; Hopmans and Stricker, 1989) or to insert stochastic compo-nents into deterministic models (Boulier and Vau-clin, 1986; Vachaud et al., 1988; Braud et al., 1995).
The objective of this paper was to calculate and to discuss the predicted probability to exceed a
given level of NO3 leaching loss for several
crop-ping systems.
2. Methods
The research was organized in the following phases: choice of simulation model, creation of a specific software for repeated model utilization, definition of the variability associated with soil hydrological parameters and to climatic data, choice of cropping systems to be studied and, finally, selection of the most representative output values.
2.1. The model
An analysis of nitrate leaching from cropping systems was carried out using the LEACHN model (Hutson and Wagenet, 1992). This model has already been extensively applied to different environments (Ramos and Carbonell, 1991; Lotse et al., 1992; Jemison et al., 1994; Acutis et al., 1997a,b; Ducco, 1997). It solves the Richards’ equation to predict soil water dynamics and simu-lates the nitrogen cycle according to Johnsson et al. (1987). Three pools of organic matter are
defined: humus, litter and manure, each
character-ized by a C/N ratio and by a mineralization rate,
which depends on soil temperature and soil water contents. The humification process is simulated, allowing for re-organization of mineral nitrogen
and CO2 losses. Crop residues (straw and roots)
are added to the litter pool. The ammonia pool is subjected to nitrification, volatilization and leach-ing and the nitrate pool is subjected to denitrifica-tion and leaching. Mineral nitrogen movements are simulated using the convection-diffusion equa-tion. The soil temperature is simulated using the Fourier’s law, with the upper boundary condition set to the air temperature; the thermal conductiv-ity is expressed as a function of soil water content, following De Vries (1963).
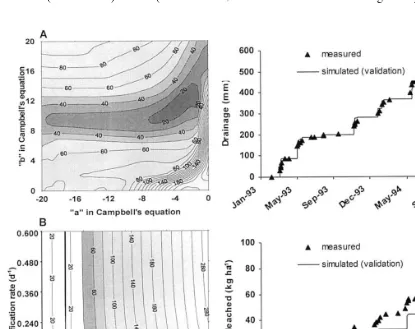
The model was analyzed for parameter sensitiv-ity, calibrated and validated on experimental re-sults obtained on a sandy-loam and a loamy soil in the Western Po valley (Northern Italy) in open field conditions using ceramic cups (Ducco, 1997; Zavattaro, 1998) and in lysimeters (Acutis et al., 1997a,b). Some examples of calibration and vali-dation of this model, for the water and the nitro-gen sections, are reported in Fig. 1.
Ducco (1997) and Acutis et al. (1997a,b) re-ported that the most sensitive inputs to predict nitrogen leaching of a particular cropping system using this model are: (a) the hydrological charac-teristics of the soil (in particular the retention curve); and (b) the climatic variables: weekly evapotranspiration, air temperature and rainfall. These inputs, which are highly variable, were therefore chosen to be stochastically studied.
The nitrogen transformation rates were not changed in the stochastic dataset because the sen-sitivity of the simulated N leaching to changes in the humus mineralization and nitrification rates was low. In fact, as Fig. 1 shows, a wide range of values optimized model prediction.
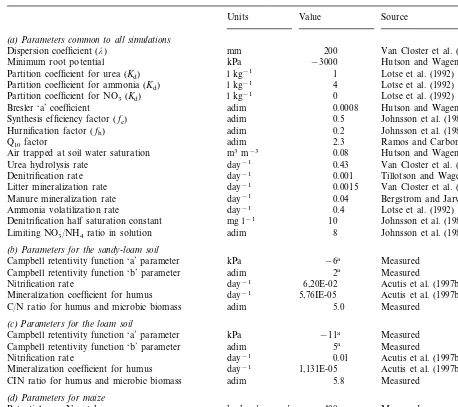
The input values, which were not stochastically varied are reported in Table 1.
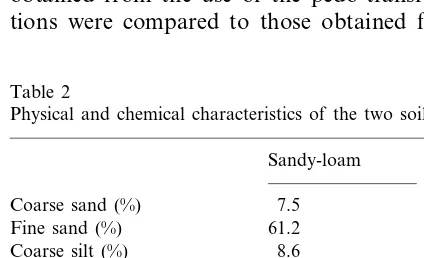
The average soil characteristics are reported in Table 2.
M.Acutis et al./Europ.J.Agronomy13 (2000) 191 – 206 194
year as initialization values for the following year. In this way, the model was applied to a series of 100 consecutive years.
2.2. Variability associated to climatic data
Daily minimum and maximum air temperature, humidity, rainfall and solar radiation meteorolog-ical data were available for a 23-year period in the sandy-loam soil site and for 15 years in the loam soil site. As the length of these series is not sufficient for an assessment of long term environmental effects (Morari and Giupponi, 1995), a 100-year climatic data series was generated using the CLIMGEN (version 3.05) model (Sto¨ckle et al.,
1998) for both sites. This weather generator is widely used as it is part of some well-known models (Sto¨ckle and Nelson, 1994). The CLIMGEN simu-lator has shown simulations that are close to measured meteorological data in different sites throughout the world as well as in the Po Valley (Acutis et al., 1998, 1999). The potential evapotran-spiration, required by LEACHN as input in the form of weekly total, was calculated according to Priestley and Taylor (1972). In the sandy-loam site, where a more complete set of meteorological data were available, the Priestley – Taylor method was compared to the FAO proposed Penman – Mon-teith formula (FAO, 1990) and a good agreement was obtained considering weekly totals.
Table 1
Input data used in the simulations
Units Value Source
(a)Parameters common to all simulations
mm
Dispersion coefficient (l) 200 Van Closter et al. (1995)
−3000
kPa Hutson and Wagenet (1992)
Minimum root potential
l kg−1
Partition coefficient for urea (Kd) 1 Lotse et al. (1992)
l kg−1
Partition coefficient for ammonia (Kd) 4 Lotse et al. (1992)
0
l kg−1 Lotse et al. (1992)
Partition coefficient for NO3 (Kd)
0.0008
Bresler ‘a’ coefficient adim Hutson and Wagenet (1992)
0.5
adim Johnsson et al. (1987)
Synthesis efficiency factor (fe)
adim
Hurnification factor (fh) 0.2 Johnsson et al. (1987)
2.3
Q10factor adim Ramos and Carbonell (1991)
0.08
m3m−3 Hutson and Wagenet (1992)
Air trapped at soil water saturation
day−1
Urea hydrolysis rate 0.43 Van Closter et al. (1995)
day−1
Denitrification rate 0.001 Tillotson and Wagenet (1982)
0.0015
day−1 Van Closter et al. (1995)
Litter mineralization rate
day−1
Manure mineralization rate 0.04 Bergstrom and Jarvis (1991)
day−1
Ammonia volatilization rate 0.4 Lotse et al. (1992)
10
mg l−1 Johnsson et al. (1987)
Denitrification half saturation constant
8
Limiting NO3/NH4ratio in solution adim Johnsson et al. (1987)
(b)Parameters for the sandy-loam soil
Campbell retentivity function ‘a’ parameter kPa −6a Measured
2a Measured
Campbell retentivity function ‘b’ parameter adim
6,20E-02
day−1 Acutis et al. (1997b)
Nitrification rate
day−1
Mineralization coefficient for humus 5,76IE-05 Acutis et al. (1997b) 5.0
C/N ratio for humus and microbic biomass adim Measured
(c)Parameters for the loam soil
Campbell retentivity function ‘a’ parameter kPa −11a Measured
5a Measured
Campbell retentivity function ‘b’ parameter adim
0.01
day−1 Acutis et al. (1997b)
Nitrification rate
day−1
Mineralization coefficient for humus 1,131E-05 Acutis et al. (1997b) CIN ratio for humus and microbic biomass adim 5.8 Measured
(d)Parameters for maize
Potential max N uptake kg ha−1 year−1 400 Measured 1.1
Maximum value of Etc/ET0ratio adim Measured
(e)Parameters for Italian ryegrass
Potential max N uptake kg ha−1 year−1 220 Measured
1 Measured
Maximum value of Etc/ET0ratio adim aAverage values.
2.3. Variation of the hydrological parameters
The scaling factor approach was used to insert a stochastic soil variability into the model. If the soil behaves like geometrically similar media, ac-cording to Miller and Miller (1956), the soil water characteristic curves and the hydraulic conductiv-ity at location i can be related to the href(u) and
where h and K are, respectively, the water
pres-sure and the hydraulic conductivity in location i
or in the reference soil, anda
iis the scaling factor,
that is, the ratio of the microscopic characteristic
M.Acutis et al./Europ.J.Agronomy13 (2000) 191 – 206 196
of the reference soil. Simmons et al. (1979) and Warrick (1990) demonstrated that the scaling fac-tors are applicable even in soils which are not geometrically similar ‘ sensu strictu ’, if the rela-tive saturation is used in place of the volumetric water content. As relative saturation was used in this application, the scaling factor approach was surely appropriate for the present analysis, which was focused on ‘homogeneous soil’.
Scaling factors were found to be log-normally distributed, and, if computed separately from pressure curves or from conductivity curves of the same sample, to be strictly correlated. The usual procedure for a stochastic model is to sample the distribution to obtain a number of values (500 – 1000) that are sufficient for a good statistical representation of the distribution. This procedure results in an excessive computational time (the time required to simulate 1 year is 1 min with a Pentium II© 266 based computer). As proposed by Braud et al. (1995), it was here decided to use only ten scaling factors, dividing the distribution into ten equiprobabilistic intervals, and to per-form a simulation using only the central value of each class.
The pedo-transfer functions of Rawls and Brakensiek (1985) were applied to a set of particle
size analysis of eight plots of 1000 m2. These
functions estimate the water content that corre-spond to seven tensions. In the sandy-loam soil, the mean and the variance of the scaling factors obtained from the use of the pedo-transfer func-tions were compared to those obtained from
di-rect measurement of the h(u) curves, and no
significant differences were found (P\0.2;
Ducco, 1997). The ability of pedo-transfer to take spatial variability into account at a decametric scale is also mentioned in Romano and Santini (1997). The values adopted for the mean and standard deviation of the logarithms of scale
fac-tors were −0.06 and 0.41 for the sandy-loam,
and 0.055 and 0.42 for the loam soil, respectively. These scale factors were applied to parameters a and b in Campbell’s equations for the water reten-tion funcreten-tion and the hydraulic conductivity (Campbell, 1974).
2.4. Cropping systems
On the basis of other researches (Grignani and Acutis, 1994; Grignani, 1996) it was decided to simulate four maize cropping systems that are frequent in the intensive stock farming of the Western Po plain: (1) maize can be grown contin-uously, yielding a silage production without any return of straw to the soil (MM); (2) it can be harvested for grain or spike production, therefore allowing the unharvested aerial part to return to the soil (MG); (3) maize can be intercropped with Italian ryegrass (LRM: in this case, the winter fodder crop is traditionally harvested in May, late harvest, thus delaying the maize seeding time by approximately 1 month); and (4) a more recent solution has been adopted to increase the forage quality of both crops, with an early harvest of Italian ryegrass (April) and a consequent anticipa-tion of the maize seeding (ERM). Nitrogen up-take is higher in spring for LRM and in autumn for ERM.
Fertilization levels were simulated at 200, 300
and 450 kg N ha−1for silage maize (MM), and at
200 and 300 kg N ha−1
for the other cropping systems (MG, LRM, ERM). These simulated ni-trogen applications correspond to the range of regular agricultural practices in the studied area.
In all cases 100 kg N ha−1 was considered to be
applied as urea in the middle of June and the complement (computed considering the total amount of nitrogen in the manure) was applied earlier as liquid manure in spring, just prior to soil tillage.
Table 2
Physical and chemical characteristics of the two soils
Loam Sandy-loam
2.3 Coarse sand (%) 7.5
Fine sand (%) 61.2 48.5 pH (water 12.5) 7.88
0.90
Organic carbon (%) 0.70
All simulations were run by considering the crops to be irrigated at three input levels, as in Sto¨ckle et al. (1997): (a) ‘no irrigation’: rainfed maize; (b) ‘deficit’: maize was supplied with 50 mm when the difference between the cumulated Et and the rain reached this value; and (c) ‘full’: maize was irrigated through a rigid scheduling which distributed 50 mm every 15 days in July and August, as is often the case in the considered region, where water availability is high.
A 100 years were simulated for every cropping system, in each of the ten equiprobable soil hy-drological conditions.
The 1000 simulation results available for each cropping system were described in terms of aver-age leaching over the whole period, standard devi-ation and breakthrough probability curve of exceeding given levels of nitrate leaching.
3. Results and discussion
3.1. Description of the systems
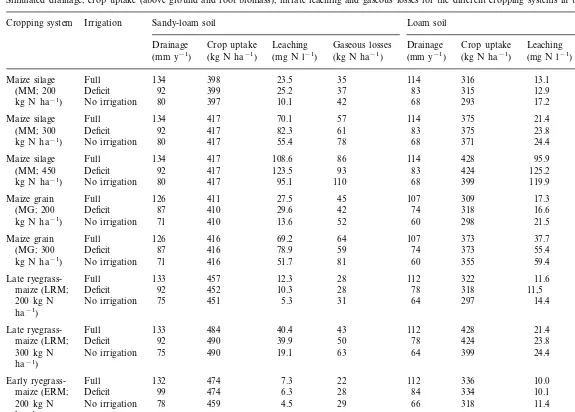
Before analysing the leaching values and their probabilities, a brief description of the systems, in terms of average values of crop uptake, nitrate concentration in leaching and gaseous losses ob-tained from the simulations, is reported in Table 3.
Crop uptake was higher in sandy loam soil, but it was not so influenced by the simulated irriga-tion and fertilizairriga-tion levels. The cropping systems with Italian ryegrass showed higher uptakes; the N uptake increase due to the catch crop was higher in the sandy loam soil and in the ERM systems. Gas losses are proportional to the fertil-ization levels in both soils and were higher when irrigation was lower. They ranged between 14 and 27% of fertilization inputs in sandy loam soil and between 12 and 22% in the loam one. The average
concentration of NO3-N in leaching in most
situa-tions exceeded the EU threshold for drinkable water. The concentration was obviously depen-dent on fertilization level, while the effect of irri-gation was different in the two soils. In the sandy loam soil the lower irrigation reduced the nitrate concentration (maybe because the effect of
re-duced mineralization in a dryer soil); in the loam soil the expected dilution effect prevailed.
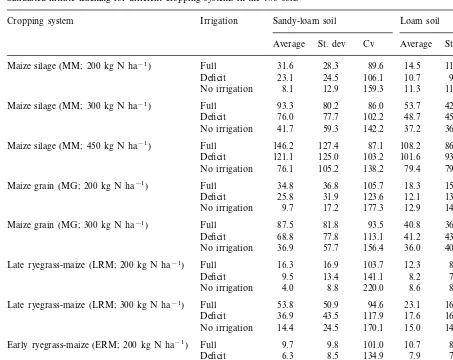
3.2. A6erage leaching6alues
The average leaching values for the different cropping systems are reported in Table 4.
As expected, leaching was higher: (1) with the highest fertilization and irrigation inputs; (2) when crop uptake was smaller (i.e. maize only vs. maize-ryegrass); and (3) in soil with the greatest sand component.
Fertilization is the main leaching cause when it drastically exceeds crop uptake, as it was the case for the 450 kg N ha−1input level for the two soils and the three irrigation modes: in the case of the ‘full’ irrigation, average leaching losses reached
146 kg N ha−1 in the sandy soil and 108 kg N
ha−1 in the loamy soil.
If one excludes such an excessive fertilization level, there is not one single dominating leaching cause amongst the different factors studied: fertil-ization, irrigation, cropping system and soil type. All factors interacted creating different average leaching levels of nitrogen loss. Maize silage (MM) caused the highest leaching losses (45.6 and
29.4 kg N ha−1
year−1
in the sandy and loamy soils, respectively). Maize grain (MG) resulted to be slightly less risky: leaching was on average 3 kg
N ha−1 year−1 less than MM in both soils.
Nitrogen offtake was smaller in MG than in MM, but the straw returned to the soil, owing to the high C/N ratio, seemed to be effective in avoiding the spring peak of nitrate concentration. This peak is often observed in northern Italy climate after ploughing, fertilization and the increase of temperature in spring (Patruno et al., 1989). Straw also reduces a rise in nitrate concentration that starts after harvesting and stops when the winter – autumn rainfalls originated a nitrate leaching. The maize-ryegrass systems show more interesting possibilities to reduce leaching. The maize-ryegrass combination with the late ryegrass harvest (LRM) showed an average leaching of
22.5 and 14.1 kg N ha−1 year−1. Compared to
M
Simulated drainage, crop uptake (above ground and root biomass), nitrate leaching and gaseous losses for the different cropping systems in the two soils
Cropping system Irrigation Sandy-loam soil Loam soil
Crop uptake
Drainage Leaching Gaseous losses Drainage Crop uptake Leaching Gaseous losses
(kg N ha−1) (kg N ha−1)
(kg N ha−1) (mm y−1) (mg N l−1)
(mm y−1) (mg N l−1) (kg N ha−1)
Maize silage Full 134 398 23.5 35 114 316 13.1 31
25.2 37 83 315 12.9
108.6 86 114 428
Maize silage Full 134 417 95.9 59
123.5 93 83 424 125.2
417 56
Full 133 322 11.6 25
Late
ryegrass-452 10.3 28 78 318 11,5
maize (LRM; Deficit 92 25
5.3 31 64 297 14.4 37
Late ryegrass- Full 133 112 428 21.4 39
490 39.9 50 78 424
92 23.8
maize (LRM; Deficit 38
19.1 63
300 kg N No irrigation 75 490 64 399 24.4 54
ha−1)
474 7.3 22
Early ryegrass- Full 132 112 336 10.0 30
474 6.3 28 84 334 10.1
maize (ERM; Deficit 99 27
4.5 29 66 318 11.4 34
459
200 kg N No irrigation 78
ha−1)
Early ryegrass- Full 132 548 18.7 41 112 444 13.1 41
551 16.7 42 84 441
99 14.5
Deficit 40
maize (ERM;
6.3 45
No irrigation 66 423 15.1 48
300 kg N 78 547
Table 4
Simulated nitrate leaching for different cropping systems in the two soilsa
Sandy-loam soil Loam soil
Cropping system Irrigation
Average St. dev Cv Average St. dev Cv
31.6
Maize silage (MM; 200 kg N ha−1) Full 28.3 89.6 14.5 11.3 77.9
23.1 24.5 106.1
Deficit 10.7 9.7 90.7
8.1 12.9 159.3 11.3 11.0
No irrigation 97.3
93.3 80.2 86.0
Maize silage (MM; 300 kg N ha−1) Full 53.7 42.6 79.3
76.0 77.7 102.2 48.7 45.1 92.6 Deficit
41.7 59.3 142.2 37.2
No irrigation 36.6 98.4
Maize silage (MM; 450 kg N ha−1) Full 146.2 127.4 87.1 108.2 86.5 79.9
Deficit 121.1 125.0 103.2 101.6 93.6 92.1 76.1 105.2 138.2 79.4
No irrigation 79.6 100.3
Maize grain (MG; 200 kg N ha−1) Full 34.8 36.8 105.7 18.3 15.8 86.3
25.8 31.9 123.6
Deficit 12.1 13.3 109.9
9.7 17.2 177.3 12.9 14.8
No irrigation 114.7
87.5 81.8 93.5
Maize grain (MG; 300 kg N ha−1) Full 40.8 36.6 89.7
68.8 77.8 113.1 41.2
Deficit 43.8 106.3
36.9 57.7 156.4 36.0
No irrigation 40.4 112.2
Late ryegrass-maize (LRM; 200 kg N ha−1) Full 16.3 16.9 103.7 12.3 8.9 72.4
Deficit 9.5 13.4 141.1 8.2 7.5 91.5
4.0 8.8 220.0 8.6
No irrigation 8.2 95.3
Late ryegrass-maize (LRM; 300 kg N ha−1) Full 53.8 50.9 94.6 23.1 16.9 73.2
36.9 43.5 117.9
Deficit 17.6 16.1 91.5
14.4 24.5 170.1 15.0 14.6
No irrigation 97.3
9.7 9.8 101.0
Early ryegrass-maize (ERM; 200 kg N ha−1) Full 10.7 8.2 76.6
6.3 8.5
Deficit 134.9 7.9 7.4 93.7
3.5 7.7 220.0 7.0
No irrigation 7.0 100.0
24.8 22.8 91.9
Early ryegrass-maize (ERM; 300 kg N ha−1) Full 14.4 11.1 77.1
16.6 18.8 113.3
Deficit 11.6 10.7 92.2
4.9 10.1 206.1 9.5 9.2 96.8
No irrigation
aAverage and standard deviation values are expressed in kg N-NO
3ha−1year−1; the coefficients of variation (cv) are expressed
in %.
was only 11.0 and 10.2 kg N ha−1
year−1 . The LRM average leaching reduction was 51 and 52%, while the ERM reduction was 76 and 65%, in each soil. This reduction in leaching for both cropping systems can be explained by the increase in nitrogen uptake and by the known mitigating effect of the winter crop cover that reduces the bare soil period. Early harvested ryegrass is more effective in reducing leaching than late harvested ryegrass: this shows that, under these conditions, it is more important to enhance maize uptake during summer than Italian ryegrass uptake in early spring.
When decreasing fertilization to a sub-optimal
level (from 300 to 200 kg N ha−1
year−1 ) leach-ing was substantially reduced: from 46.6 to 15.2
kg N ha−1year−1in the sandy soil (−67%) and
from 29.0 to 11.3 kg N ha−1
year−1
in the loamy
soil (−61%),while the reduction in nitrogen
up-take and DM production was much lower. Water input is another way of controlling the leaching risk. By irrigating maize with a fixed amount of water every 15 days leaching was on
average 44.0 and 23.5 kg N ha−1
M.Acutis et al./Europ.J.Agronomy13 (2000) 191 – 206 200
water deficit, the average leaching was reduced to 32.9 and 19.6 kg N ha−1year−1in the two soils,
respectively (−25 and −17%). Without any
irri-gation, the leaching values were 15.4 and 17.2 kg
N ha−1 year−1 (−65 and −27%).
A variation of the irrigation management had a more pronounced impact on leaching in soils with a higher conductivity at saturation and a lower water holding capacity, as with sandy soil.
3.3. Variability of leaching
The standard deviations reported in Table 2 are closely correlated to the means and show values that often exceed the means, particularly in the sandy soil. These results confirm the importance of considering leaching variability when evaluat-ing the environmental impact of cultivation sys-tems. This is particularly true when general assumptions are based on experimental data, which often refer to a limited number of locations and years.
The standard deviation to mean ratio (coeffi-cient of variation) increased when irrigation was not applied. Irrigation therefore reduced leaching variability, which is otherwise dominated by rainfall.
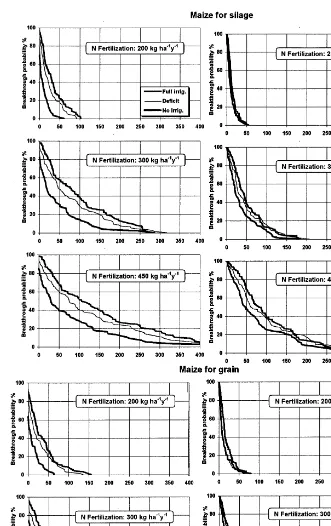
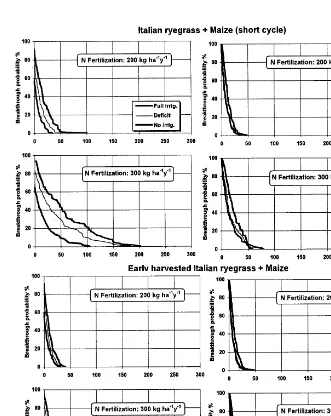
The breakthrough curves with the probability of exceeding a given value of leaching are re-ported in Figs. 2 and 3, for the maize alone and the combination of maize and Italian ryegrass, respectively.
The general shape of these curves is hyperbolic. The probability of exceeding a given value of leaching changes rapidly in the first part of the curve (leaching values lower than average) but much less in the second part (leaching values higher than average). In other words, given a particular cropping system, the change in proba-bility of exceeding two different leaching values is higher when leaching is low.
This observation seems more relevant in crop-ping systems that are more exposed to the risk of leaching (i.e. MM highly fertilized and fully irri-gated in the sandy soil), while the shape of the curve seems more linear in situations where aver-age leaching is lower (i.e. ERM in the loam soil).
However, in all cases, lower than average leach-ing values are more frequent than higher ones: the median is lower than the average.
A possible application of these results concerns the criteria to use when judging experimental re-sults: measured differences between treatments in years or soil conditions that reduce leaching tend to be more consistent and predictive than in the opposite conditions.
Figs. 2 and 3 show that curves rarely intersect or only do so when the differences are very small. If other contrasts were studied (for example com-paring different crops at the same fertilization and irrigation level), some interactions would show up. For example, in the sandy soil at 300 kg N ha−1fertilization and full irrigation, MM shows a 50% probability of exceeding a leaching value of
75.6 kg N ha−1, and a 20% probability of
exceed-ing 167.8 kg. Under the same conditions MG shows a lower risk at 50% breakthrough
probabil-ity (65.3 kg N ha−1), but a higher one at 20%
probability (171.3 kg). Nevertheless, interactions are few and always concern small differences from a practical point of view, as in the given example. The data would therefore suggest that the
classifi-cation of cropping systems with respect to NO3
leaching, does not change according to the chosen breakthrough probability.
Ranking can also be used to judge cropping
systems. In each environment, a leaching
threshold can be chosen, for example, on the basis
of the EU limit of 50 mg l−1 N-NO
3 in the
predicted drainage flux.
The cultivation systems could be classified into three groups:
low risk (L): average leaching is lower than the
leaching threshold and the probability of ex-ceeding the leaching threshold is lower than 20%;
medium risk (M): average leaching is lower
than the leaching threshold and the probability of exceeding is between 20 and 50%;
high risk (H): on average, leaching is higher
than the leaching threshold.
The following is an example based on the pro-posed simulations.
M.Acutis et al./Europ.J.Agronomy13 (2000) 191 – 206 202
flux allows one to accept a leaching impact of
50 kg N ha−1 at the most (leaching threshold
for the sandy soil). In the loamy soil, character-ized by a lower water drainage, this limit is 40 kg N ha−1.
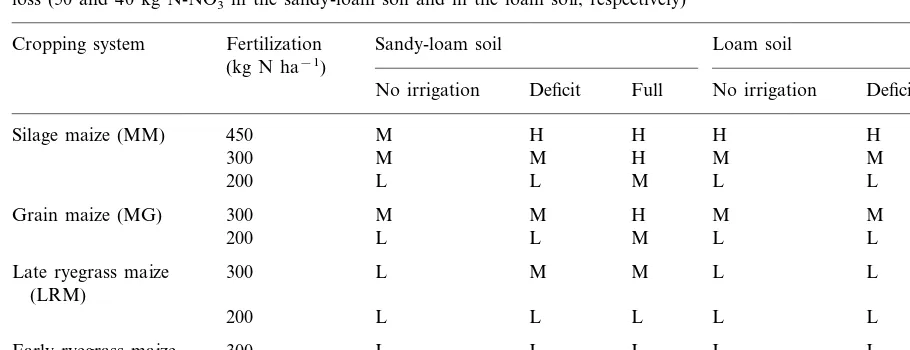
An application of these criteria is reported in Table 5. Cropping systems with silage maize or
maize grain, fertilized with 300 kg N ha−1 or
more, are at high risk of leaching when full
irriga-tion is applied to the sandy soil. The high fertiliza-tion of maize silage shows a high risk even when irrigation is more carefully applied. In the other eight cropping systems, where the crop is more likely to produce high leaching (silage maize), fertilization is high, or irrigation exceeds the crop requirements, the leaching level could be classified as medium. The remaining cropping systems are in the low risk class.
Table 5
Classification of different cropping systems in term of leaching risk (H: high; M: medium; L: low) to exceed a given level of nitrate loss (50 and 40 kg N-NO3in the sandy-loam soil and in the loam soil, respectively)
Cropping system Fertilization Sandy-loam soil Loam soil (kg N ha−1)
No irrigation Deficit Full No irrigation Deficit Full
Silage maize (MM) 450 M H H H H H
M
300 M H M M H
L L M L
200 L L
Grain maize (MG) 300 M M H M M M
200 L L M L L L
300 L M
Late ryegrass maize M L L L
(LRM)
200 L L L L L L
300 L L
Early ryegrass maize L L L L
(ERM)
200 L L L L L L
The same criteria applied to the other soil show a sharper defined situation. Silage maize and grain maize are at high or medium risk when fertilized
with 300 kg N ha−1. All other cases show to
belong to the low leaching risk class. When com-pared to the crop or to the crop fertilization, irrigation seems less important in the definition of the leaching risk.
4. Conclusions
In order to pilot agriculture towards a reduc-tion of nitrogen leaching, useful suggesreduc-tions can be derived from model application. This work is an attempt to use a deterministic model to obtain stochastic information on nitrogen leaching pro-duced by different cropping systems. With respect to other leaching risk assessments, which are fre-quently only based on pedological information, the proposed technique offers the possibility of simultaneously considering soil, weather condi-tions, crops and agronomic techniques and their
spatial and/or temporal variability. Sustainable
land management in agriculture requires such a complete approach.
The most important aspects presented can be summarized as follows:
All the considered aspects are key points
influ-encing the leaching level: the soil type, the crop system (uptake level and straw return to the soil), the level of nitrogen application and the irrigation management.
The probability distribution of nitrate leaching
is skewed: lower than average values are more frequent than higher ones;
It is possible to rank cropping systems
accord-ing to the probability of exceedaccord-ing leachaccord-ing values.
Ranking does not depend very much on the
probability level chosen.
Some policy suggestions may be derived from such rankings. For example, cropping systems at high risk could be forbidden. Those at low risk could be allowed or even encouraged (with public financial support). The medium risk cultivation systems could be allowed only if cultivation man-agement were run more carefully, through the application of improved N fertilization techniques allowing a reduction of N use in particular years (Bodilis et al., 1998).
The proposed method was easy to apply and offered clear suggestions on the nitrate leaching risk associated to different cropping systems.
M.Acutis et al./Europ.J.Agronomy13 (2000) 191 – 206 204
the scaling factor method should be applied to
a layered soil through a more complex process than that which was carried out here, i.e. through sampling in a multivariate normal dis-tribution of the log of scaling factors (Wu et al., 1997);
the chosen model does not explicitly consider
macroporosity, which may play an important role in water and nutrient dynamics, particu-larly in heavy soils;
this approach has not taken the problem of soil
variability associated to chemical and biologi-cal characteristics into account; more detailed information on organic matter mineralization variability would be required and, when avail-able, added to the modelling process.
Further investigations will look into the possi-bility of coupling this approach to GIS software.
Acknowledgements
The authors would like to thank Professor An-drea Cavallero for his help in organizing this research. This research was funded by
Panda-MIPA and Assessorato Ambiente Regione
Piemonte.
References
Acutis, M., Argenti, G., Caredda, S., Cavallero, A., Ducco, G., Fara, G., Grignani, C., Pardini, A., Porqueddu, C., Reyneri, A., Sulas, L., Talamucci, P., Zanchi, C., 1997. Modellizzazione della percolazione profonda dell’acqua nel terreno: calibrazione e validazione dei codici CREAMS e LEACHW in diversi suoli e colture foraggere. Riv. Agron. 31 (1), 33 – 41.
Acutis, M., Argenti, G., Caredda, S., Cavallero, A., Ducco, G., Fara, G., Giordani, C., Grignani, C., Pardini, A., Porqueddu, C., Reyneri, A., Sulas, L., Talamucci, P., Tarello, C., Zanchi, C., 1997. Modellizzazione della liscivi-azione dei nitrati: calibrliscivi-azione e validliscivi-azione del modello LEACHN in diversi suoli e colture foraggere. Riv. Agron. 31 (1), 42 – 53.
Acutis, M., Donatelli, M., Sto¨ckle, C.O., 1998. Comparison of the performance of three weather generators. European Society for Agronomy, Short Communications, Vol. II, Fifth Congress 28 June – 2 July. Nitra, pp. 117 – 118. Acutis, M., Donatelli, M, Sto¨ckle, C.O., 1999. Performances
of two weather generators as a function of the number of
available years of measured climatic data. Proceedings of the International Symposium Modelling Cropping Sys-tems, Lleida 21 – 23 June, Catalonia, Spain, pp. 129 – 130. Addiscott, T.M., Tuck, G., 1996. Sensitivity analysis for
re-gional-scale solute transport modeling. In: Corwin, D.L., Loague, K. (Eds.), Applications of GIS to the Modeling of Non-Point Source Pollutants in the Vadose Zone. SSSA Special Publication Madison, USA no. 48, 153 – 162. Addiscott, T.M., Whitmore, A.P., Powlson, D.S, 1991.
Farm-ing, Fertilizers and the Nitrate Problem. CAB Interna-tional, Wallingford.
Bergstrom, L., Jarvis, N.J., 1991. Prediction of nitrate leaching losses from arable land under different fertilization intensi-ties using SOIL-SOILN models. Soil Use Manage. 7 (2), 79 – 87.
Bockstaller, C., Girardin, P., van der Werf, H.M.G., 1997. Use of agro-ecological indicators for the evaluation of farming system. Eur. J. Agron. 7, 261 – 270.
Bodilis, A.M., Bouthier, A., Castillon, P., Laurent, F., Desvig-nes, P., 1998. Pilotage de la fertilisation azote´e avec Jubil: la gamme s’e´largit. Perspectives Agricoles 236, 57 – 63. Boulier, J.F., Vauclin, M., 1986. Mode´lisation stochastique
des e´coulements d’eau dans la zone non sature´e. Hydroge´-ologie 2, 153 – 162.
Braud, J., Dantas-Antonino, A.C., Vauclin, M., 1995. A stochastic approach to study the influence of spatial vari-ability of soil hydraulic properties on surface fluxes, tem-perature and humidity. J. Hydrol. 165, 283 – 310. Campbell, G.S., 1974. A simple method for determining
unsat-urated conductivity from moisture retention data. Soil Sci. 117 (6), 311 – 314.
Ceccon, P., Beinat, E., Giovanardi, R., Zerbi, G., 1995. Appli-cazione di un Decision Support System (DSS) per la valutazione di sistemi colturali alternativi. Riv. Agron. 29 (3), 480 – 486.
Connolly, R.D., Silburn, D.M., Ciesiolka, C.A.A., 1997. Dis-tributed parameter hydrology model (ANSWERS) applied to a range of catchment scales using rainfall simulator data. III. Application to a spatially complex catchment. J. Hydrol 197, 183 – 202.
Corwin, D.L., Wagenet, R.J., 1996. Applications of GIS to the modeling of nonpoint sources pollutants in the vadose zone: a conference overview. J. Environ. Qual. 25, 403 – 411.
De Vries, D.A., 1963. Thermal properties of soils. In: Van Wijik, A. (Ed.), Physics of Plant Environment. North-Hol-land, Amsterdam, pp. 210 – 235.
Donatelli, M., Ceotto, E., Spallacci, P., Marchetti, R., 1994. Uso del modello Epic nello studio degli effetti di pratiche agricole su aspetti di interesse ambientale: un esempio di metodologia. Agricoltura Ricerca 156, 33 – 46.
Ducco, G., 1997. Quantificazione dei flussi idrici e di azoto da diversi terreni e colture foraggere. Calibrazione e vali-dazione di LEACHM e sua applicazione stocastica. PhD Thesis, Universita` di Torino, 133 pp.
FAO, 1990. Expert consultation on revision of FAO method-ologies for crop water requirements. Report draft, 28 – 31 May, Rome, Italy, 45 pp.
Giardini, L., Giupponi, C., 1993. Proposta metodologica per la determinazione della capacita` ricettiva del territorio per l’impiego agronomico dei liquami zootecnici. Riv. Agron. 27 (3), 149 – 159.
Girondel, P., Arondel, C., 1997. Tri des syste`mes de culture en fonction de leur impact sur la qualite` de l’eau de pro-fondeur (cas d’application de la methode ELECTRA tri). Proc of 46th meeting of the European Working Group ‘Multicriteria aid for decision’, Bastia, France, October 1997.
Go¨rres, J., Gold, A.J., 1996. Incorporating spatial variability into GIS to estimate nitrate leaching at the aquifer scale. J. Environ. Qual. 25, 491 – 498.
Grignani, C., 1996. Influenza della tipologia di allevamento e dell’ordinamento colturale sul bilancio di elementi nutritivi di aziende padane. Riv. Agron. 30 (3), 414 – 422. Grignani, C., Acutis, M., 1994. Assessment of mineral and
organic nitrogen balance in North-Western Italy in dairy and beef cattle farms. Proc. 3rd ESA Congress, Abano-Padova, 1994, pp. 700 – 701.
Heathwaite, A.L., Burt, T.P., Trudgill, S.T., 1993. Overview on the nitrate issue. In: Burt, T.P., Heathwaite, A.L., Trudgill, S.T. (Eds.), Nitrate: Process, Patterns and Man-agement. Wiley, Chichester, pp. 3 – 21.
Hoogenboom, G., Jones, J.W., Hunt, L.A., Thornton, P.K., Tsuji, G.Y., 1994. An integrated decision support system for crop model applications. ASAE Paper No. 943025, 23 pp.
Hopmans, J.W., Stricker, J.N.M., 1989. Stochastic analysis of soil water regime in a watershed. J. Hydrol. 105, 57 – 84. Hutson, J.L., Wagenet, R.J., 1992. LEACHM. Leaching
Esti-mation and Chemistry Model. A process-based model of water and solute movement, transformation, plant uptake and chemical reaction in the unsaturated zone. Dept. of Soil, Crop and Atmospheric Sciences. Research Series no. 92-3. New York, Cornell University, 121 pp.
Jame, Y.W., Cutforth, H.W., 1996. Crop growth models for decision support systems. Can. J. Plant Sci. 76 (1), 9 – 19. Jemison, J.M., Jabro, J.D., Fox, R.H., 1994. Evaluation of
LEACHM: II. Simulation of nitrate leaching from nitro-gen-fertilized and manured corn. Agron. J. 86, 852 – 859. Johnsson, H., Bergstro¨m, L., Jansson, P.E., Paustian, K.,
1987. Simulated nitrogen dynamics and losses in a layered agricultural soil. Agric. Ecos. Envir. 18, 333 – 356. Loague, K., Corwin, D.L., 1996. Uncertainty in regional-scale
assessments of non-point source pollutants. In: Corwin, D.L., Loague, K. (Eds.), Applications of GIS to the mod-eling of non-point source pollutants in the vadose zone. SSSA Special Publication Madison, USA no. 48, pp. 131 – 152.
Lotse, E.G., Jabro, J.D., Simmons, K.E., Baker, D.E., 1992. Simulation of nitrogen dynamics and leaching from arable soils. J. Contam. Hydrol. 10, 183 – 186.
Miller, E.E., Miller, R.D., 1956. Physical theory for capillary flow phenomena. J. Appl. Phys. 27 (4), 324 – 332. Morari, F., Giupponi, C., 1995. Effects on water quality of
four cultivation systems for maize crop: model simulations. In: Giupponi, C., Marani, A., Morari, F. (Eds.), Modelling the Fate of Agrochemicals and Fertilizers in the Environ-ment. ESA, Venice 3 – 5 March, pp. 485 – 502.
Patruno, A., Cavazza, L., Pistelli, E., 1989. Variazione del contenuto di azoto nitrico nel terreno. Influenza della concimazione azotata e della sua interazione con la la-vorazione, su colture ed in annate diverse. Riv. Agron. 23 (1), 99 – 115.
Peck, A.J., Luxmoore, R.J., Stolzy, J.L., 1977. Effects of spatial variability of soil hydraulic properties in water budget modeling. Water Resour. Res. 13 (2), 348 – 354. Priestley, C.H.B., Taylor, R.J., 1972. On the assessment of
surface heat flux and evaporation using large-scale parame-ters. Monthly Weather Rev. 100, 81 – 92.
Ramos, C., Carbonell, E.A., 1991. Nitrate leaching and soil moisture prediction with the LEACHM model. Fert. Res. 27, 171 – 180.
Rao, P.S.C., Jessup, R.E., Hornsby, A.C., Casse, D.K., Pol-lans, W.A., 1983. Scaling soil microhydrological properties of Lakeland and Konawa soils using similar media con-cepts. Agric. Wat. Man. 6, 277 – 290.
Rawls, W.J., Brakensiek, D.L., 1985. Prediction of soil water properties for hydrologic modeling. In: Jones, E.B., Ward, T.J. (Eds.), Watershed Management in the Eighties. Proc of Symp. ASCE convention, Denver, CO, April 30 – May 1. Regione Emilia-Romagna, 1993. Manuale per la gestione e l’utilizzazione agronomica dei reflui zootecnici. Centro Ricerche Produzioni Animali, 317 pp.
Richter, G.M., Beblik, A.J., Schmalstieg, K., Richter, O., 1998. N-dynamics and nitrate leaching under rotational and continuous set-aside — a case study at the field and catchment scale. Agric. Ecos. Envir. 68, 125 – 138. Romano, N., Santini, A., 1997. Effectiveness of using
pedo-transfer functions to quantify the spatial variability of soil water retention characteristics. J. Hydrol. 202, 137 – 157. Russo, D.E., Bresler, E., 1980. Scaling soil hydraulic
proper-ties of heterogeneous field. Soil Sci. Soc. Am. J. 44, 681 – 684.
Schulz, K., Huwe, B., 1997. Water flow modelling in the unsaturated zone with imprecise parameters using a fuzzy approach. J. Hydrol. 201, 211 – 229.
Simmons, C.S., Nielsen, D.R., Biggar, J.W., 1979. Scaling of field-measured soil-water properties. Hilgardia 47 (4), 77 – 173.
Stockdale, E.A., Gaunt, J.L., Vos, J., 1997. Soil-plant nitrogen dynamics: what concepts are required? Eur. J. Agron. 7, 145 – 159.
M.Acutis et al./Europ.J.Agronomy13 (2000) 191 – 206 206
Sto¨ckle, C.O., Cabelguenne, M., Debaeke, P., 1997. Compari-son of CropSyst performance for water management in southwestern France using submodels of different level of complexity. Eur. J. Agron. 7, 89 – 98.
Sto¨ckle, C.O., Campbell, G.S., Ndlovu, L.S., Castellvi, F., Nelson, R., 1998. CLIMGEN User Guide, Washington State Univ., Pulmann, 10 pp.
Tillotson, W.R., Wagenet, R.J., 1982. Simulation of fertilizer nitrogen under cropped situations. Soil Sci. 133 (3), 133 – 143.
Vachaud, G., Vauclin, M., Balabanis, E., 1988. Stochastic approach of soil water flow through the use scaling factors: measurements and simulation. Agric. Water. Manag. 13, 249 – 261.
Van Closter, M., Viaene, P., Diels, J., Feyen, J., 1995. A
deterministic evaluation analysis applied to an integrated soil-crop model. Ecol. Modelling 81, 183 – 195.
Warrick, A.W., 1990. Application of scaling to the characteri-zation of spatial variability in soils. SSSA Special Publica-tion no. 25, pp. 39 – 51.
Warrick, A.W., Amoozegar-Fard, A., 1979. Infiltration and drainage calculations using spatially scaled hydraulic prop-erties. Water Resour. Res. 15, 1116 – 1120.
Wu, K.J., Ward, A.D., Workman, S.R., Salchow, E.M., 1997. Applying stochastic simulation techniques to a determinis-tic vadose zone solute transport model. J. Hydrol. 197, 88 – 110.
Zavattaro, L., 1998. Assessing water and nitrogen dynamics in various soils and forage crops. Measurements and simula-tions. University of Torino, Ph.D thesis, 130 pp.
.