Modelling long-term transpiration measurments from grassland in
southern England
R.J. Harding
a,∗, C. Huntingford
a,1, P.M. Cox
b aInstitute of Hydrology, Crowmarsh Gifford, Wallingford, Oxon OX10 8BB, UKbHadley Centre, Meteorological Office, Bracknell RG12 2SY, UK
Received 2 March 1999; received in revised form 14 October 1999; accepted 18 October 1999
Abstract
Observations of latent heat, sensible heat and momentum flux from eddy correlation equipment are presented, along with approximately weekly measurements of soil moisture content. The measurements were made over a pasture field in the south of England for 3 years, covering two dry years, 1995 and 1996 and a more normal year, 1997. The data show that, overall, approximately 80% of the measured net radiation was used for evaporation. During July and August of the two dry years, soil moisture deficits of over 150 mm developed within the top 1400 mm, and at these deficits the evaporation was reduced. During the summer months, overall between 71 and 76% of the net radiation was used for evaporation. During the winter months, the latent heat flux exceeded the net incoming radiation. An energy closure better than 10% suggests that the measurements were well founded. The surrounding trees may, however, have influenced the momentum exchange; the estimated roughness length of 38 mm is considerably more than the commonly accepted 10% of vegetation height.
This extensive dataset provides an excellent test for the current UK Meteorological Office Surface Energy Scheme (MOSES) when applied to this site, the results of which are presented here. In its unoptimised form, the model can explain 72% of the variance of the hourly evaporative flux data, and with excellent agreement with the soil moisture measurements. Optimisation can improve the model fit, but only up to a maximum of 76%. The largest remaining errors occur during mid-summer when high temperatures, vapour pressure deficits and soil moisture deficits occur. ©2000 Published by Elsevier Science B.V. All rights reserved.
Keywords: Evaporation; Stomatal conductance; Soil moisture; Grassland; SVAT modelling
1. Introduction
One of the primary uses of Global Circulation Models (GCMs) is to predict global fields of near surface temperature and humidity. The accuracy of such predictions depends critically upon correct pa-rameterisations of the partitioning of net radiation
∗Corresponding authors. Tel.:+44-(0)1491-838800; fax:+44-(0)1491-692424.
E-mail address: [email protected] (R.J. Harding).
1Co-corresponding author.
into thermal energy and latent heat fluxes at the land surface. Such surface fluxes influence the generation of rainfall and the development of overall circulation patterns. Surface energy partitioning is highly depen-dent upon stomatal opening, itself a function of local microclimate and soil status. Thus accurate descrip-tions of both stomatal conductance and soil moisture evolution are essential.
The dependences of stomatal conductance on envi-ronmental conditions have been extensively described. Jarvis (1976) derived functions to describe the ob-served variations of conductance in terms of soil leaf
water potential, vapour pressure deficit, temperature and photon flux density for several coniferous forests. Based on the analysis of Jarvis, Stewart (1988) derived a similar description in terms of variables generated by a meteorological model (e.g. soil moisture, air tem-perature, vapour pressure deficit and solar radiation). Similar formulations have been produced for conifer-ous forest (Prince and Black, 1989; Dang et al., 1997), for tropical rain forest (Dolman et al., 1991; Wright et al., 1996), for savannah (Huntingford et al., 1995) and for grassland (Stewart and Verma, 1992). Huntingford and Cox (1997) confirmed, through the use of uncon-strained neural network fitting techniques applied to data from Thetford Forest, UK, that these functional dependences are of the correct form to describe the variation of stomatal conductance.
The Jarvis/Stewart functions are, however, empiri-cal descriptions of complex physiologiempiri-cal responses. Recently, more mechanistic, coupled models of pho-tosynthesis and transpiration (e.g. Collatz et al., 1992) have been included within land surface schemes of GCMs. Typical of these is the MOSES (Meteoro-logical Office Surface Energy Scheme) model of the UK Meteorological Office. The canopy conductance sub-model within MOSES was developed using data from the Kansas grassland, FIFE sites, a C4 grass,
(Cox et al., 1998). MOSES has also been tested suc-cessfully for a savannah site within HAPEX-Sahel (Blyth et al., 1999). This paper describes a similar but more extensive testing and calibration of MOSES on a 3 year run of evaporation and soil moisture data taken over a pasture grassland in the UK (a C3 grass). These observations have provided the
op-portunity to compare the performance of the land surface model in different, contrasting years and to check the applicability, and thus predictive ability, of a calibration made with one year’s data in subsequent years.
2. Data
2.1. Introduction
The dataset is very extensive, containing over three years of simultaneous measurements of surface fluxes, surface meteorology and soil moisture. The years 1995–1997 are the most complete and they are
described and modelled here. The three years had in-teresting contrasts: 1995 and 1996 had below average rainfall and 1997 average rainfall. In the summers of 1995 and 1996 the grass showed signs of water stress, whereas 1997 saw a dry spring but wet summer months with no obvious visual signs of soil moisture stress.
2.2. Site description
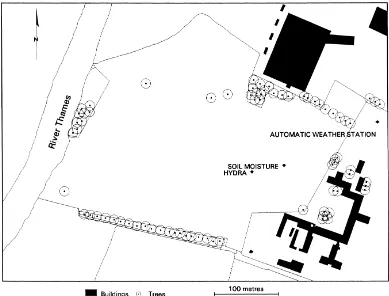
The pasture field at Wallingford, Oxfordshire, UK (51◦36′N 1◦7′E) is shown in Fig. 1, along with the
positions of the flux measurements, soil moisture measurements and additional meteorological mea-surements. The field is permanent pasture classified as an Lolium perenne–Cynosauriis cristatus grassland community (Rodwell, 1993). It was grazed intermit-tently with cattle during the period of measurement, such that the vegetation height varied from 10 to 30 cm. The field is flat, with a slight slope (1.5 m in 300 m) from the flux mast towards the River Thames. The soils are a 4.5 m thick layer of calcareous gravels and sands overlain between 0.5 and 1 m of a clay loam (Jarvis et al., 1984). Well level and soil mois-ture measurements showed that the groundwater was below 3 m for the study period, and therefore outside the range of the grass roots. The field is bounded by the river to the west, a row of mature trees to the south, a two storey building to the east and a mix of trees and buildings to the north (Fig. 1). The uninter-rupted fetch over grass exceeded 300 m to the west, but reduced to 100 m to the north, east and south-east. The fetch over grass was therefore not perfect in all directions and this showed itself in the measured mo-mentum exchange and calculated roughness lengths, as described further. However the field is fairly typical of the UK and the measured energy closure suggests the fetch is adequate (see Section 4.2).
2.3. Soil moisture measurements
Fig. 1. A diagram showing the position of the pasture field and associated instrumentation, all areas other than trees and buildings are grassland.
2.4. Flux and meteorological measurements
Eddy correlation measurements were made of evap-oration,λE (W m−2), sensible heat flux, H (W m−2) and momentum flux using Hydra systems (Shuttle-worth et al., 1988). The Hydra system consists of a one-dimensional sonic anemometer, an infrared hy-grometer, a fine-wire thermocouple thermometer and a sensitive cup anemometer (to measure horizontal wind fluctuations), all monitored at 10 Hz. In this case the sensor head was mounted at 3.2 m above the ground. The Hydra systems were recalibrated every year. Be-cause the site was used for testing systems, as well as routine monitoring, there were often two, or some-times three, systems in the field. The agreement be-tween individual systems was generally excellent.
The Hydra systems output the mean fluxes hourly. These data were unfortunately not always continuous.
The Hydra system also recorded hourly average hu-midity, air temperature, wind speed and net radiation. The humidity was recorded with a Vaisala RH sen-sor, the air temperature with the thermocouple sensor (also used for the measurement of temperature fluc-tuations) and the net radiation, with a REBS Q*6 ra-diometer. To provide the continuous record of forcing data required for the model runs, these data were sup-plemented by data from an automatic weather station (AWS) operated at a site 200 m north-east of the flux tower (Fig. 1). Comparisons showed that the agree-ment between the data taken at the flux mast and the AWS was excellent. There was a small underestimate of the net radiation by the AWS at high radiation lev-els which was almost certainly due to inadequacies in the design of the AWS Shenk radiometer. However the hours of high radiation were sufficiently few that the totals from the two radiometers agreed well.
3. Model description
The complete MOSES scheme is a comprehensive land surface model describing the exchanges of en-ergy, water and carbon at the land surface (Cox et al., 1999). It contains the parameterisation of tran-spiration, interception, direct soil evaporation, soil water movement, soil thermal regime (including soil freezing) and the melting of snow. The full model is described by Cox et al. (1999), only the important features of the soil and photosynthesis model are described further.
Soil water movement is described using a four layer model with vertical transfers described by the Darcy equation. Plant roots extend throughout the top three layers but water can move upwards from the bottom layer into the root zone through diffusion. The neces-sary soil parameters are calculated from soil texture classes following Cosby et al. (1984). Transpiration is reduced from a non-limited rate once the average soil moisture in the root zone drops below a critical value,
θcrit(which itself is a function of soil texture), using a
‘soil water availability factor’,β, which decreases lin-early between the critical soil moisture and the wilting point,θwilt.
Transpiration is based upon a surface energy parti-tioning equation, which splits available radiation into evaporative flux, sensible heat flux and soil heat flux.
A fractional coverage of vegetation is prescribed, and for the grass field, this is set as 0.95. With a value so near to unity, bare soil evaporation is only a small component of the total evaporative flux. The surface energy equation used within MOSES is essentially an extended version of the Penman–Monteith equation (Monteith, 1965), and is given in Eq. (11) of Cox et al. (1999).
A key parameter within the surface equations is the stomatal conductance to water vapour. At the top leaf level, the model of the stomatal conductance, gs
(m s−1) is based upon the work of Collatz et al. (1992) and Leuning (1995). This may be written as
gs=
Here anis the net photosynthesis (which contains an
explicit dependence upon soil moisture; see Cox et al., 1998), cs (mol CO2m−3) is the CO2concentration at
the leaf surface, c∗ (mol CO2m−3) is the CO2
con-centration at the photorespiration compensation point and Ds the humidity deficit at the leaf surface. Net
photosynthesis contains an explicit dependence upon surface temperature T1(K), photosynthetically active
radiation and intercellular CO2concentration, ci(mol
CO2m−3). The latter is found by combining Eq. (1),
and that for diffusion through the stomata (i.e.an =
(gs/1.6)(cs −ci)) to give a closure first found by
Both f0and D∗are empirical parameters derived from
laboratory experiments (e.g. Collatz et al., 1991) or optimised on field data. Initial values of f0=0.95 and
D∗=0.075 kg kg−1were selected to fit with published
values of maximum stomatal conductance (Schulze et al., 1994) and the vapour pressure deficit response (e.g. Dolman et al., 1991). Soil moisture (through parameterβ) was also modelled as directly affecting net leaf photosynthesis (Cox et al., 1998), and there-fore stomatal conductance as described by Eq. (1).
A number of parameters contained within MOSES were considered for calibration. The first is Vmax(mol
et al. (1994) and set to a value of 0.4×10⁻⁵mol CO2m−2s−1. This parameter appears within the
description of the temperature dependent rubisco capacity of the top leaf level of C3plants thus:
VT =Vmax
20.1(Ts−25)
[1+e0.3(Ts−T1)] (3)
where Tsis the surface temperature. Parameter T1(◦C)
represents stomatal closure at higher temperatures and an initial value of T1=36◦C (e.g. Sellers et al., 1996)
is prescribed. Except in strongly light-limited condi-tions, net leaf photosynthesis an(mol CO2m−2s−1) is
broadly proportional to VT (Cox et al., 1999) with all
other factors invariant. Parameters f0 and D∗ in Eqs.
(1) and (2) were also used in the optimisation. The equations for gs were derived from
observa-tions on individual leaves. A scaling up procedure is adopted in MOSES to calculate the whole canopy con-ductance, gc. It is assumed that all limiting factors for
photosynthesis decay within the canopy, follow Beer’s Law, and so by integration of the canopy and noting that gs is linear in an, then
gc=
1−e−kLc
k
gs (4)
where k is an extinction coefficient (set to 0.5) and Lc
is the local leaf area index.
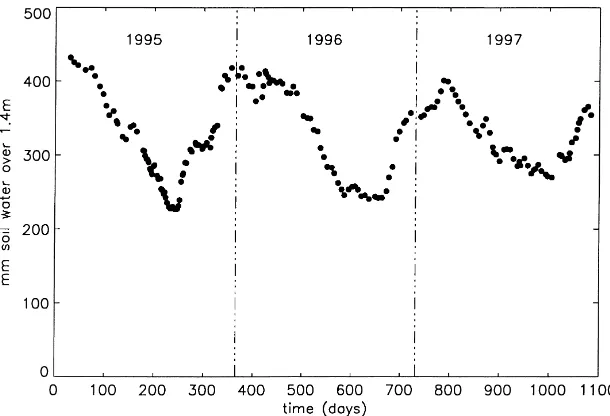
Fig. 2. Values of measured total soil moisture within the top 1.4 m of soil for 1995–1997.
4. Data analysis
4.1. Soil moisture
The time series of total water contents in the top 1.4 m for the 3 years showed important differences be-tween the years (Fig. 2). The summer of 1995 was dry, particularly through July and August, and the maxi-mum soil moisture deficit developed at the end of Au-gust. The summer of 1996 was dry, but wetter than 1995, however this year had a very dry autumn which caused an extended period of deficit during September and October (although the extreme values of deficits observed in 1995 were not reached). 1997 had a dry spring but frequent rain periods through the summer, leading to only moderate soil moisture deficits. From visual inspection of the soil moisture profiles in the drier years, it was evident that the seasonal summer drying extended down to 1.4 m.
The values of soil moisture at saturation, θsat=
0.400 m3H2O m−3, and wilting point,θwilt=0.128 m3
H2O m−3, were inferred from the wettest and dryest
soil moisture measured over the entire record (Finch and Harding, 1998). The value of a third soil param-eter, θcrit, was set to be consistent with the values
of θsat and θwilt using the underlying assumption
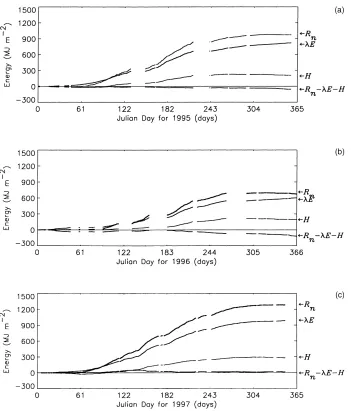
Fig. 3. A cumulative plot for (a) 1995, (b) 1996 and (c) 1997 of measurements of net radiation, Rn, evaporative flux,λE, sensible heat
flux, H and Rn–λE–H where such data exists. Tick marks on the time axis correspond to approximately two monthly periods.
(Cosby et al., 1984; Cox et al., 1999). This returned a value ofθcrit=0.211 m3H2O m−3.
4.2. The energy closure
The cumulative energy components for the mea-sured data for each year are shown in Fig. 3a–c. It should be noted that these are not totals for the en-tire year but for the hours when all three fluxes (λE, H and Rn) are available (approximately half the time).
fluxes was 10% greater than the net radiation, how-ever this is still well within the errors expected from net radiometers (Halldin and Lindroth, 1992) and tur-bulent flux measurements (Lloyd et al., 1997). There was, as expected, some variation through the year due to changes in soil heat storage.
4.3. Roughness length
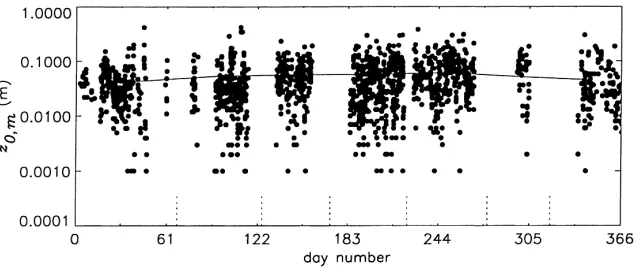
A value of the roughness length for momentum transport was calculated by inverting the logarithmic wind profile equation (with a Monin–Obukov stabil-ity correction) using the hourly measured momentum fluxes (see, for example, Paulson, 1970). To avoid errors inherent in wind speed measurements at low speeds, calculations were only made when the wind speed exceeded 1 m s−1. There was considerable scat-ter in the hourly calculated values of roughness length. There was some evidence of a seasonal dependence, rising from 0.03 m in winter to 0.07 m in the late sum-mer (Fig. 4). This was almost certainly related to the growth of the grass (modified by the impact of reg-ular grazing). There was also a dependence on wind direction; the roughness was less from the west, the direction for which there was the largest fetch over the pasture. The (median) value of roughness length for momentum,z0m (m), was 0.038 m. This was greater
than the 10% of vegetation height which is generally assumed (Monteith and Unsworth, 1990, p. 117) and it seems very likely that the surrounding trees and buildings were increasing the momentum transport and hence the effective roughness length. However the
Fig. 4. A plot of inferred values of momentum roughness length, z0m (log axis), against day number for year 1996 (tick marks correspond to approximately two monthly intervals). Also plotted (the continuous line) are mean values for each period.
exposure of this field was fairly typical of the south of England so this measured value was used in the analysis following. The closure of the energy balance, despite the limited fetch and evidence of the effect of the nearby trees on the momentum exchange, may be partial as a result of the predominantly grass fields be-yond the trees. The roughness length for heat was as-sumed to be one tenth of that of momentum, see, for example, Garratt (1992) (Figure 4.4, pp. 93–94).
5. Modelling and optimisation
5.1. Modelling strategy
The modelling strategy was to first assess the per-formance of the model using, as far as possible, the parameters used routinely in the Hadley Centre GCM (Cox et al., 1999). In order to make meaningful com-parisons (and to limit the number of optimised param-eters in subsequent stages) the soil paramparam-eters (θsat,
andθwilt) and roughness length were specified from
independent, site specific measurements (see Sections 4.1 and 4.3). Other soil parameters within the model were adjusted to be consistent withθsat andθwilt
A second stage was to compare the perfor-mance of the model containing untuned transpira-tion/photosynthesis parameters with that of a model containing a very simple transpiration description, i.e. constant value for the conductance.
The third stage was to optimise parameters within the transpiration module against evaporation mea-surements. The calibration was made by maximising the percentage of variance explained by the model,
σPVE of measured hourly evaporation. This statistics
also provides an assessment of model performance. A range of optimisations were undertaken using dif-ferent sets of optimised parameters. Parameters were optimised for one year (1995) and then these values applied in subsequent years (1996–1997) to test the predictive capability. This was an excellent test be-cause the years were very different, with large deficits developing in 1996 but not 1997. Model performance was also addressed by comparing the measured and modelled soil moisture changes, although this was done by eye and with no formal statistic.
5.2. The initial model run
An initial model run using standard parameters de-scribed in Section 3 reveals that the model system-atically underestimated evaporation at high tempera-tures. This behaviour was also found by Blyth et al. (1999) for Sahelian vegetation. To correct this error,
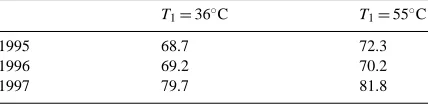
T1was reset to 55◦C, essentially removing any
mod-elled upper temperature limitation on photosynthesis (and transpiration) at this site. With this correction, statisticσPVE increased for 1995 from 68.7 to 72.3%
(with equivalent improvements in the other years, see Table 1).
5.3. Comparison with simpler models for 1995
To clarify the impact of increasing complexity of the description of the transpiration on the model fit,
Table 1
The effect upon percentage of variance explained of changing T1 from 36◦C to 55◦C
T1=36◦C T1=55◦C
1995 68.7 72.3
1996 69.2 70.2
1997 79.7 81.8
two additional runs were made with very simple tran-spiration equations:
(i) with a constant conductance (0.0143 m s−1) with no soil moisture control.
(ii) with a constant conductance (0.0143 m s−1) but with soil moisture control.
The value of 0.0143 m s−1 for conductance is rec-ommended for grassland by Allen et al. (1989) and was derived from experimental (generally lysimeter) studies. The goodness of fit of these runs was com-pared with those using using the MOSES transpiration model in Table 2. The first run, (i), gave a poor sim-ulation with lowσPVE and a systematic overestimate
of the evaporation. Run (ii) gave a reasonable model fit (σPVE=70.8%) but was not as good as using the
MOSES routines without optimisation.
5.4. The optimisation of parameters within the model runs for 1995
A variety of optimisations were performed and com-pared to the value of 72.3% for the standard parame-ters (with T1=55◦C). First, all three variables Vmax,
D∗and f0were varied (see Table 2 for new parameter
values), and in this optimisation 79.6% of the variance was explained. However, there was significant inter-play between variable values due to collinearity, result-ing in predictions of ‘best fit’ parameters which were many orders of magnitude away from their literature values. The three parameters were then optimised indi-vidually, with the other parameters fixed at the values prescribed in Section 5.2. This exercise showed that some improvement can be achieved by the optimisa-tion of f0, but comparatively little improvement from
the individual optimisation of Vmaxand D∗. The best
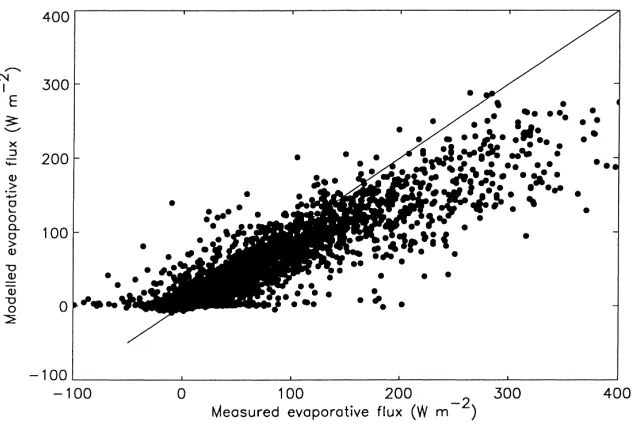
fit value of f0=0.88 yielded a fit of 76.1% variance
Table 2
Model fit using 1995 data (T1=55◦C throughout) for runs with either constant surface conductance, or with the MOSES transpiration model Parameters fixed Constant conductance Constant conductance Moses
or optimised No soil moisture with soil moisture
Standard Optimising Optimising Optimising Optimising parameters Vmax, f0, D∗ Vmaxonly f0 only D∗only
% variance 53.6 70.8 72.3 79.6 73.8 76.1 72.4
explained
Parameter value Vmax= Vmax= Vmax= f0= D∗=
4×10⁻⁵ 1.46×10⁻⁴ 2.86×10⁻⁵ 0.882 D
∗=0.08117
f0=0.95
D∗=0.075
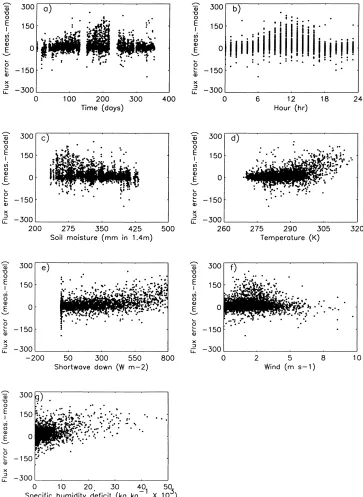
Fig. 6 shows that for 1995 the deviation between model prediction and measurement as a function of time and environmental parameters. The largest and positive deviations (i.e. the modelled value was less than the measurement) were at mid-day, in mid-summer, at high temperature, high vapour pressure deficit and at low soil moisture. All these effects may not be correctly described by this com-paritively simple model; however, because of corre-lation between these variables it was not possible to positively identify the root cause of this systematic deviation.
Fig. 5. A scatter diagram of modelled against measured evaporation for the year 1995, with optimisation of model parameter f0 (see Eqs. (1) and (2)). Further T1=55◦C (see Eq. (3)).
5.5. Optimised model used predictively for 1996 and 1997
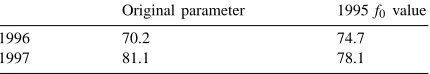
The performance of the model (with just f0
opti-mised for 1995) revealed statisticsσPVE=74.7% and
σPVE=78.1% for 1996 and 1997 respectively (Table
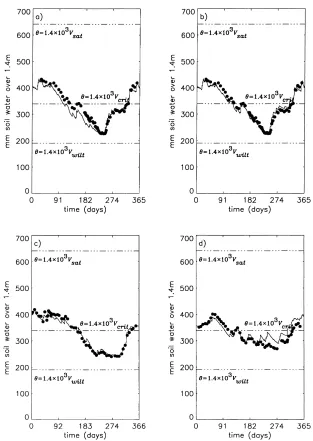
Fig. 7. A plot of both measurement and model predictions of soil moisture within the top 1.4 m of soil. These are for (a) 1995, with no optimisation of model paramaters, (b) 1995 with optimisation of model parameter f0 (see Eqs. (1) and (2)), (c) 1996 with optimised parameter f0 from year 1995 and (d) 1997 with optimised parameter f0 from year 1995. For all simulations, T1=55◦C (see Eq. (3)). Also plotted are the soil moisture content values for 1.4 m of soil associated with the model values of saturated, critical and wilting points.
5.6. Soil moisture simulations
The soil moisture simulations and observations are shown in Fig. 7 for the original model for 1995 and with the optimised (f0only) transpiration parameter for
1995, 1996 and 1997. Optimisation of the
Table 3
Percentage of variance explained by the model using original pa-rameters and with, f0=0.882, the 1995 optimised value (T1=55◦C throughout)
Original parameter 1995 f0 value
1996 70.2 74.7
1997 81.1 78.1
occurred regularly in 1997). This is not a failure of the transpiration model, but is a common failure of sim-ple soil water models (see, e.g., Ragab et al., 1997). It is not clear whether it was the underestimation of evaporation from rain-wetted grass or the neglect of macropore flow through the soil (surface runoff was not observed at this flat site and was not simulated by the model) which caused this effect. On the last point it should be recognised that the soil moisture mea-surement is only at a single point and there may be some preferential drainage, or systematic local redis-tribution, at this point.
6. Discussion and conclusions
This paper presents 3 years of eddy correlation mea-surements of the surface energy components from a pasture field in southern England. Although the mea-surements were taken at a site which was not perfect for micrometeorological research, the energy closure suggests that the evaporation measurements were well founded. The evaporation measurements also agreed well with the soil moisture changes further strengthen-ing confidence in them (see also, Finch and Hardstrengthen-ing, 1998). There was, however, some evidence that the momentum exchange was enhanced by the surround-ing trees and buildsurround-ings. The measurements showed that approximately 80% of the incoming net radiation was used as latent heat, reducing to a value between 71 and 76% in the summer months of 1995 and 1996 (these were the two driest years on record in this re-gion). In the winter the latent heat flux generally ex-ceeded the net radiation. Moisture depletion extended down to at least 1.4 m in the soil in the drier years, implying a larger store of available soil water than is often recognized (see, e.g., Penman, 1949).
The study presents a test of a land scheme which is operationally used within a major climate model. The
operation of the scheme has been tested against the extensive dataset of direct measurements of evapora-tion and soil moisture. The use of 3 years of obser-vations has allowed a calibration and an independent test of the effectiveness of the calibrated values. One remarkable feature is the initial success of the tran-spiration scheme without calibration. The scheme was originally developed and calibrated against flux data from a C4 grassland from FIFE (Cox et al., 1998).
In this study it performed well without calibration for C3grassland, at least in the mean. The calibration of
three key parameters within the transpiration and pho-tosynthesis module naturally reduced the scatter in the hourly evaporation estimates. One interesting feature of the study was that the improvement by calibration on the first year (1995) was not necessarily carried over to one of the test years (1997). Two distinquish-ing features of 1997 was that the unoptimised version of MOSES worked very well (σPVE=81.1%) and the
summer was wet, with limited soil water stress. It ap-pears that MOSES produces its poorest simulations during the most highly stressed conditions. The simu-lation is improved by optimisation, but it may be that there are implicit shortcomings in the precise func-tional forms of model response to either soil stress, high temperature limitation or high vapour pressure deficit values. Unfortunately, such stresses often oc-cur together and as such it is difficult to separate these effects.
Some important lessons can be drawn from both the initial success of the model and the comparitively small improvement through optimisation. This study is a useful demonstration which shows that parameter values obtained primarily in laboratory experiments on single plants can be effectively scaled up to the field scale. With respect to a single variable (such as evaporation) at a single site, large land surface models, such as used here, are probably over-parameterised. This, and the co-linearity between the controlling vari-ables, causes severe problems in the optimisation, fre-quently producing ill defined and multiple minima, and unrealistic parameter values (see, e.g., Franks et al., 1997). One way to define parameters better from field data is to use simultaneous measurements of dif-ferent variables. For example, the use simultaneous measurements of the CO2flux would have provided a
Despite the reservations expressed earlier, the use of field data in the calibration of this model has led to significant improvements in the operation of the model, in particular, the operation of the soil water function — through the adjustment of the soil depth and the adjustment of the temperature limitation on the transpiration. There is an obvious need to continue to test models, such as these, against observations from a range of different sites with varying soil types and vegetation covers.
Acknowledgements
The majority of the modelling presented in this paper was undertaken with funds from Hadley Cen-tre subcontract to the Institute of Hydrology, number MET1b/2128. Peter Cox was supported under the UK DETR Climate Prediction Programme under contract PECD 7/12/37. We also gratefully acknowledge our numerous colleagues who contributed to both the eddy correlation and soil moisture measurements.
References
Allen, R.G., Jensen, M.E., Wright, J.L., Burman, R.D., 1989. Operational estimates of reference evapotranspiration. Agron. J. 81, 650–662.
Bell, J.P., 1977. Neutron Probe Practice. NERC, Institute of Hydrology Report No. 16, Wallingford, UK.
Blyth, E.M., Harding, R.J., Essery, R., 1999. A coupled dual source GCM SVAT. Hydrol. Earth Sys. Sci. 3, 71–84.
Collatz, G.J., Ball, J.T., Grivet, C., Berry, J.A., 1991. Physiological and environmental regulation of stomatal conductance. Agric. For. Meteorol. 54, 107–136.
Collatz, G.J., Ribas-Carbo, M., Berry, J.A., 1992. Coupled photosynthesis-stomatal conductance model for leaves of C4 plants. Aust. J. Plant Physiol. 19, 519–538.
Cosby, B.J., Hornberger, G.M., Clapp, R.B., Ginn, T.R., 1984. A statistical exploration of the relationships of soil moisture characteristics to the physical properties of soils. Water Resourc. Res. 20, 682–690.
Cox, P.M., Huntingford, C., Harding, R.J., 1998. A canopy conductance and photosynthesis model for use in a GCM land surface scheme. J. Hydrol. 212–213, 79–94.
Cox, P.M., Betts, R.A., Bunton, C., Essery, R.L.H., Rowntree, P.R., Smith, J., 1999. The impact of new land surface physics on the GCM simulation of climate and climate sensitivity. Climate Dynamics 15, 183–203.
Dang, Q.-L., Margolis, H.A., Coyea, M.R., Mikailou, S.Y., Collatz, G.J., 1997. Regulation of branch-level gas exchange of boreal
trees roles of shoot water potential and vapour pressure difference. Tree Phys. 17, 521–535.
Dolman, A.J., Gash, J.H.C., Roberts, J.M., Shuttleworth, W.J., 1991. Stomatal and surface conductance of tropical rainforest. Agric. For. Meteorol. 54, 303–318.
Finch, J.W., Harding, R.J., 1998. A comparison between reference transpiration measurements of evaporation for a riparian grassland site. Hydrol. Earth Sys. Sci., 129–136.
Franks, S.W., Beven, K.J., Quinn, P.F., Wright, I.R., 1997. On sensitivity of soil–vegetation–atmosphere transfer (SVAT) schemes: equifinality and the probelm of robust calibration. Agric. For. Meteorol. 86, 63–75.
Garratt, J.R., 1992. The Atmospheric Boundary Layer. Cambridge University Press, Cambridge, 316 pp.
Halldin, S., Lindroth, A., 1992. Errors in net radiometers — comparison and evaluation of 6 radiometer designs. J. Atmos. Ocean. Technol. 9, 762–783.
Huntingford, C., Allen, S.J., Harding, R.J., 1995. An intercomparison of single and dual-source vegetation– atmosphere transfer models applied to transpiration from Sahelian Savannah. Boundary-Layer Meteorol. 74, 397–418. Huntingford, C., Cox, P.M., 1997. Use of statistical and neural
network techniques to detect how stomatal conductance responds to changes in the local environment. Ecol. Mod. 97, 217–246.
Jacobs, C., 1994. Direct impact of atmospheric CO2 enrichment on regional transpiration. PhD Thesis, Wageningen Agricultural University.
Jarvis, P.G., 1976. The interpretation of the variations of leaf water potential and stomatal conductance found in canopies in the field. Phil. Trans. R. Soc. London B 273, 593–610.
Jarvis, M.G., Allen, R.H., Fordham, S.J., Hazelden, J., Moffat, A.J., Sturdy, R.G., 1984. Soils and their uses in south-east England. Soil Survey of England and Wales, Bulletin No. 15. Leuning, R., 1995. A critical appraisal of a combined stomatal-photosynthesis model for C3 plants. Plant Cell Environ. 18, 357–364.
Lloyd, C.R., Bessemoulin, P., Cropley, F.D., Culf, A.D., Dolman, A.J., Elbers, J., Heusinkeld, B., Moncrieff, J.B., Monteny, B., Verhoef, A., 1997. A comparison of surface fluxes at the HAPEX-Sahel fallow bush sites. J. Hydrol. 188, 400–425. Monteith, J.L., 1965. Evaporation and the environment. Symp.
Soc. Expl. Biol. 19, 205–234.
Monteith, J.L., Unsworth, M.H., 1990. Principles of Environmental Physics. Arnold, London.
Paulson, C.A., 1970. The mathmatical representation of wind speed and temperature profiles in the unstable atmospheric surface layer. J. Appl. Meteorol. 9, 857–861.
Penman, H.L., 1949. The dependence of transpiration on weather and soil conditions. J. Soil Sci. 1, 74–89.
Prince, D.T., Black, T.A., 1989. Estimation of forest transpiration and CO2 uptake using the Penman–Monteith equation and a physiological photosynthesis model. IAHS Publ. No. 177, pp. 213–227.
Rodwell, J.S. (Ed.), 1993. British Plant Communities. Cambridge University Press, Cambridge.
Schulze, E.D., Kelliher, F.M., Korner, C., Lloyd, J., 1994. Relationships among maximum stomatal conductance, ecosystem surface conductance, carbon assimilation rate and plant nitrogen nutrition: a global ecology scaling exercise. Annual review of ecological systems 25, 629–660.
Sellers, P.J., Randall, D.A., Collaz, G.J., Berry, J.A., Field, C.B., Dazlich, D.A., Zhang, C., Collelo, G.D., Bounoua, L., 1996. A revised land surface parameterization (SiB2) for atmospheric GCMs. Part I: model formulation. J. Climate 9, 676–705. Shuttleworth, W.J., Gash, J.H.C., Lloyd, C.R., McNeil, D.D.,
Moore, C.J., Wallace, J.S., 1988. An integrated
micrometeoro-logical system for evaporation measurements. Agric. For. Meteorol. 43, 295–317.
Stewart, J.B., 1988. Modelling surface conductance of a pine forest. Agric. For. Meteorol. 43, 19–35.
Stewart, J.B., Verma, S.B., 1992. Comparison of surface fluxes and conductances at two contrasting sites within the FIFE area. J. Geophys. Res. 97, 18623–18628.