Forest floor CO
2
fluxes estimated by eddy covariance and
chamber-based model
Ivan A. Janssens
∗, Andrew S. Kowalski, Reinhart Ceulemans
Department of Biology, University of Antwerp (UIA), Universiteitsplein 1, B-2610 Antwerpen, Belgium
Received 20 August 1999; accepted 17 June 2000
Abstract
An intercomparison study of two methods for estimating forest soil CO2efflux was conducted during a 3-week period in
summer. An empirical model established from nearly 2 years of chamber measurements predicted that the soil CO2efflux
ranged from 1.2 to 1.4mmol m−2s−1. This small range was due to the lack of variability in the model parameters (soil
temperature and moisture) during the study period. Eddy covariance measurements showed more variability and diurnal dependence. Turbulent fluxes of CO2during the day apparently were influenced by the presence of a moss layer on the
forest floor; the combined effects of moss photosynthesis and respiration reduced the turbulent fluxes by an average of 0.6mmol m−2s−1 relative to the modeled soil efflux. At night, the eddy fluxes of CO2agreed well with the modeled soil
efflux; however, the turbulent fluxes were highly variable (standard deviation exceeding the mean), due to the imperfect sampling conditions associated with the nocturnal boundary layer. These results illustrate the different processes measured by the two methods, and highlight some of the limitations of the eddy covariance technique for estimating soil CO2efflux.
Finally, they demonstrate the need for more long-term intercomparison studies, covering a broader range in soil temperature and moisture. © 2001 Elsevier Science B.V. All rights reserved.
Keywords: Eddy covariance; Empirical model; Pinus sylvestris; Scots pine; Soil CO2efflux
1. Introduction
The global carbon budget must be better understood if we are to address potential climate changes resulting from anthropogenic activity. Important gaps in our un-derstanding of the global carbon budget include uncer-tainties about carbon cycling within forest ecosystems
∗Corresponding author. Present address: Research School of
Biological Sciences, Australian National University, GPO Box 475, Canberra, ACT 2610, Australia. Tel.: +61-2-6262-9690; fax: +61-2-6249-4919. Correspondence address: Department of Biology, University of Antwerp (UIA), Belgium. Tel.:
+32-3-820-22-55; fax:+32-3-820-22-71. E-mail addresses: [email protected], [email protected] (I.A. Janssens).
(Vitousek et al., 1997), of which soil CO2efflux is an important component (Raich and Schlesinger, 1992). Accurate measurement of soil CO2efflux is thus nec-essary for a thorough understanding of carbon cycling in forests and of below-ground metabolic activity.
Soil CO2efflux is the result of two main processes: the production of CO2 in the soil and its transport from the soil to the atmosphere. Soil respiratory ac-tivity releases large amounts of CO2 into the soil pore space. This leads to high CO2concentrations in the soil air, where total storage may equal or exceed the atmospheric CO2storage in forests. The transport of CO2 from the soil into the atmosphere is mainly driven by two mechanisms: diffusion and mass flow (Kimball and Lemon, 1971). Whereas the diffusive
flux is driven by the concentration gradient between the soil and the atmosphere, the mass flow is the result of air motion. Soil CO2 efflux can therefore only be accurately measured by a system that does not alter the soil respiratory processes, the concen-tration gradient and the flow of air across the soil surface.
Chamber-based methods are most frequently used to estimate soil CO2 efflux due to low cost and ease of use (Edwards, 1982; Norman et al., 1992; Fang and Moncrieff, 1996; Goulden and Crill, 1997; Rayment and Jarvis, 1997; Janssens and Ceulemans, 1998). They are, however, often criticized because they are weak at sampling spatial variability within forests and because they are subject to uncertainties associated with the so-called chamber effects (Mosier, 1990). Chambers may disturb the soil environment and alter CO2 and pressure gradients, turbulent fluctuations, and air flow. They may thus interfere with both production and transport of CO2. Modern chamber systems (Norman et al., 1992; Fang and Moncrieff, 1996; Iritz et al., 1997; Rayment and Jarvis, 1997) have eliminated most of these effects, but mass flow across the soil surface, as well as the motion and pressure of air around and within the chamber still remain problems.
Given the uncertainty related to chamber measure-ments, many alternative techniques have been applied to estimate soil CO2 efflux. These include the eddy covariance technique, the gradient-flux method, the 222Rn method and others (Rosenberg et al., 1983; Baldocchi et al., 1986, 1997; Denmead and Raupach, 1993; Dugas, 1993; Uchida et al., 1997). Unfortu-nately, these alternative techniques are often more expensive and difficult to apply, and although they are not subjected to “chamber effects”, they involve a wide array of assumptions and prerequisites. Also the eddy covariance technique has a number of lim-itations that affect its suitability to measure soil CO2 efflux (see Section 2), but nonetheless appears to be well suited for continuous measurement of soil CO2 efflux in homogeneous and flat forests without un-dergrowth. This approach is advantageous in that it does not disturb the soil environment and integrates over a large surface area, and initial investigations have suggested that the method holds some promise for estimation of soil fluxes (Baldocchi and Meyers, 1991; Baldocchi et al., 1997).
Despite the long history of measurements and the development of a large variety of techniques, no method has so far been recognized as the standard or reference technique for measuring soil CO2fluxes (Nakayama, 1990; Norman et al., 1992; Rayment and Jarvis, 1997). Uncertainties related to both chamber and eddy covariance flux measurements motivate a comparison of these totally independent methods. As the presence of operators making chamber mea-surements would affect the eddy fluxes, no direct measurement comparison is possible. Hence, a model based on the chamber measurements is a good al-ternative. Process-based models may be preferable because they provide insight into underlying root and microbial activity. However, empirical models usually fit the measured chamber data more accurately and are better suited for validation of flux measurements. The objectives of this study were: (i) to examine the feasibility of measuring soil CO2 efflux in a Bel-gian Scots pine forest by eddy covariance, and (ii) to compare the eddy fluxes with the outcome of a simple empirical model based on chamber measure-ments. This paper describes the chamber and eddy flux measurements, and discusses the model perfor-mance and its comparison with the eddy covariance measurements.
2. Materials and methods
2.1. Site description
The study was conducted in an even-aged, 69-year old Scots pine (Pinus sylvestris L.) stand in the Bel-gian Campine region (51◦18′33′′N, 4◦31′14′′E), in the context of the European ECOCRAFT and EU-ROFLUX projects. The 2-ha pine stand was part of a 150-ha mixed coniferous/deciduous plantation — De Inslag — in Brasschaat (de Pury and Ceulemans, 1997; Gond et al., 1999; Janssens et al., 1999a), and is a level-II observation plot of the European program for intensive monitoring of forest ecosystems, managed by the Institute for Forestry and Game Management, Flanders, Belgium.
Table 1
Daytime (7:30–19:30 h) eddy covariance data for the sample daysa
Sample day Sample size (No. half hours) Mean CO2flux (mmol m−2s−1) S.D. Soil temperature (◦C)
3/7/98 16 0.77 0.06 15.2
4/7/98 8 0.81 0.31 14.7
9/7/98 6 1.05 0.23 15.0
10/7/98 22 0.74 0.44 15.7
13/7/98 7 1.10 1.04 16.8
14/7/98 13 0.64 0.19 14.5
15/7/98 14 0.77 0.25 15.9
16/7/98 25 0.58 0.36 15.6
17/7/98 23 0.34 0.33 15.3
18/7/98 4 0.03 0.16 14.3
20/7/98 7 0.78 0.48 19.1
aFor each sampling period, total sample size, mean CO2flux, standard deviation (S.D.) and mean soil temperature are presented.
experiment (3–20 July 1998) were very homogeneous (Tables 1 and 2), with mainly gray and drizzly weather. Apart from some shallow drainage ditches, the study site has an almost flat topography, is very gently slop-ing (0.3%), and is at an elevation of 16 m (Baeyens et al., 1993). In 1995, tree density was 556 trees ha−1, with a mean height of 20.6 m and a mean diameter at breast height (1.3 m) of 0.27 m (Cermak et al., 1998). Tree crowns had a mean depth of 3.7 m, and the canopy had a projected surface area of 65% (Van den Berge et al., 1992) and a leaf area index varying between 1.8 and 2.4 (Gond et al., 1999). All undergrowth was com-pletely removed in 1993, giving way to a dense moss layer dominated by Hypnum cupressiforme Hedw., Dicranium scoparium Hedw., Polytrichum commune L. and Dicranella heteromalla (Hedw.) Schimp.
The stand has a moderately wet sandy soil with high hydraulic conductivity and is rarely saturated (Baeyens et al., 1993). However, due to the presence of a clay layer at a depth of 1–2 m, the site is poorly drained and soil moisture generally fluctuates around field capacity (Janssens et al., 1999a). More detailed information
Table 2
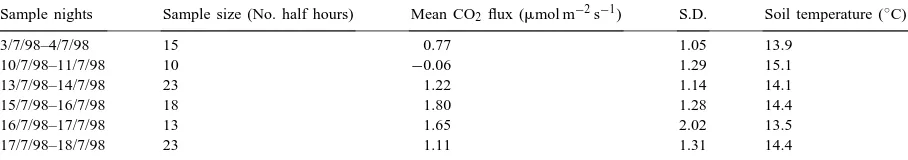
Nighttime (20:00–7:00) eddy covariance data for the sample nightsa
Sample nights Sample size (No. half hours) Mean CO2 flux (mmol m−2s−1) S.D. Soil temperature (◦C)
3/7/98–4/7/98 15 0.77 1.05 13.9
10/7/98–11/7/98 10 −0.06 1.29 15.1
13/7/98–14/7/98 23 1.22 1.14 14.1
15/7/98–16/7/98 18 1.80 1.28 14.4
16/7/98–17/7/98 13 1.65 2.02 13.5
17/7/98–18/7/98 23 1.11 1.31 14.4
aFor each sampling period, total sample size, mean CO2flux, standard deviation (S.D.) and mean soil temperature are presented. on the soil, vegetation and local climatic conditions can be found in Baeyens et al. (1993), Cermak et al. (1998), Janssens et al. (1999b) and Kowalski et al. (1999).
2.2. Chamber measurements of soil CO2efflux
systematically allowed a maximum [CO2] increase of 50 ppmv inside the chamber headspace, and a maxi-mum duration of 2 min. The soda lime technique (Ed-wards, 1982) was selected because it produces daily means without requiring the presence of an operator during nighttime. In a laboratory experiment in which both techniques were compared, the soda lime tech-nique was found to underestimate soil CO2efflux, es-pecially at higher flux rates (Janssens and Ceulemans, 1998). We therefore corrected the soda lime results for this underestimation at higher flux rates using the calibration function obtained in this laboratory study. After correction, both techniques agreed very well in situ (Janssens et al., 2000).
2.3. Empirical model
Based on the chamber measurements of soil CO2 efflux, a simple empirical model of the form Y =
f (T )∗f (Ψ )was developed, where Y is the CO2 ef-flux, T the soil temperature (measured at a depth of 5 cm in the mineral soil) andΨ is the soil moisture (measured by TDRs at a depth of 25 cm in the mineral soil) (Janssens et al., 1999a). The first factor of the equation describes the temperature response and was taken from the BRESP model produced by Schlentner and van Cleve (1985),
Y =a+
1
b+c−((T−10)/10)
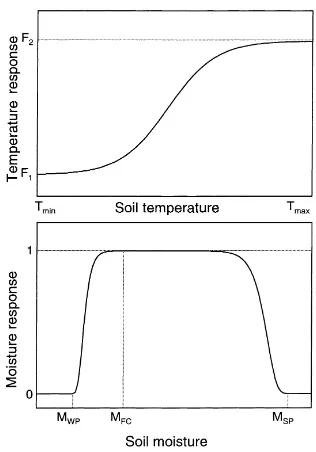
It is a sigmoid function that starts as a regular Q10 function (Fig. 1), in which a is the lower limit of soil CO2efflux, a+1/b the maximum flux, and c is the Q10related parameter. T is the soil temperature in◦C. The second factor of the equation describes the moisture response (Fig. 1), and consists of two su-perimposed Gompertz functions (asymmetric sigmoid function with asymptotes at 0 and 1) scaled between 0 and 1 by subtracting 1,
Y =exp{−e(p−q∗Ψ )} +exp{−e(r−(s−t∗Ψ ))} −1
where p, q, r, s and t are parameters andΨ is the vol-umetric soil moisture content (%). The first Gompertz function is parameterized to describe drought stress. The second part describes water stress near satura-tion, but was not relevant for the data presented here. Therefore, the model was simplified to:
Fig. 1. (Top) The model’s response of soil CO2fluxes to temper-ature (see text for discussion). F1indicates the lower limit of soil CO2 efflux reached at Tmin. F2 indicates the upper limit and is reached at Tmax. (Bottom) Simulated impact of soil moisture on soil CO2 efflux (see text for discussion). MWP indicates wilting point, MFC indicates field capacity and MSP indicates saturation point.
Y =exp{−e(p−q∗Ψ )}
All parameters of both the temperature and the mois-ture functions were fitted to the measurements by means of a nonlinear least-squares fitter (Origin, Mi-crocal Software, USA). Best fit was obtained with the following parameter values:a =0.15,b=0.787,
c=100.76,p=10 andq=1.2.
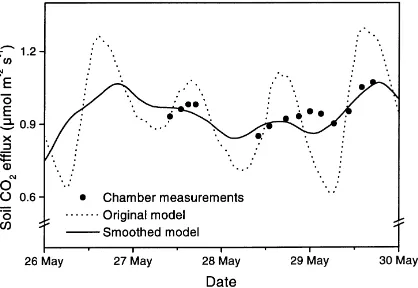
Fig. 2. Comparison of soil chamber measurements and model output from 26 May 1997 to 30 May 1997. Best fit (solid line) was obtained by smoothing the original model (dotted line) over a 20 h period. The chamber measurements (n= 7) are closed chamber IRGA results.
2.4. Eddy flux measurements
The eddy covariance instrumentation consisted of a sonic anemometer (Metek USAT-3, Germany) and an IRGA (LI-6262, LI-COR, USA). Data were col-lected at 10 Hz. The sonic was mounted at a height of 1.65 m above the forest floor; the sample intake for the IRGA was located immediately below the sonic (dis-tance of less than 30 cm). Air was sampled at a rate of 6.2 l min−1 through a Gelman Acro 50 1.0mm filter
(P/N 4258), into a 4 m Teflon tube of 4.33 mm (inner diameter) and heated to avoid condensation. A subse-quent filter (Ballston 300-01961) conditioned the air prior to sampling by the IRGA.
Fluxes were computed based on a 30 min averaging period. Time series of winds were delayed to account for time lag in between wind and gas sampling. Tur-bulent fluctuations were determined as the difference between the time series and a digital recursive filter approximating a running mean, with a filter time con-stant of 50 s as described by McMillen (1988). The co-ordinate system for the fluxes was rotated such that the x-axis is aligned with the mean wind for the averaging period (v¯ = ¯w =0). The surface-normal flux (w′c′)
was used as the estimate of surface gas exchange. Within 25 m around the eddy covariance system, sparse grass and saplings were removed. In contrast with the chamber measurements, however, the moss layer remained untouched. Data were rejected
when-ever the operators were present within 30 m of the sampling system, when the CO2concentration was out of the range of the IRGA and whenever the change in CO2 concentration from one half-hour to the next exceeded 10 ppmv. This effectively screened the data for stationarity and helped to limit the importance of any unmeasured storage term. Total data availability during the experiment was less than expected, due to quality checking as described above, recurring failure of the laptop, and a plumbing problem. Daytime data were available for 11 days, while nighttime data were available for only 6 days (Tables 1 and 2).
The eddy covariance technique is characterized by a number of limitations that affect its suitability to measure soil CO2efflux. Some of these are discussed here, but the list is hardly exhaustive. The net flux in the lower atmosphere is a result of exchange be-tween the atmosphere and the underlying surface el-ements. These elements include not only the soil but also understorey vegetation and those portions of tree boles below the measurement height, all of which respire. Eddy flux measurements should be made in homogeneous turbulence. Under the canopy, a sam-pling location may be systematically biased. Mea-surements could be (intermittently) influenced by the wakes of individual boles or surface elements. Local fluxes can also be biased by the presence of thermals associated with the heterogeneous sub-canopy radia-tion regime. Finally, decreased levels of turbulence be-low the canopy, especially at night or in weak winds, can lead to artifacts associated with inhomogeneity and/or advection.
3. Results and discussion
3.1. Model performance
Fig. 3. Comparison of soil chamber measurements and model output for 1997. The solid line represents the unsmoothed model. The chamber measurements (n = 16) are corrected soda lime results. Error bars indicate 1 S.D.
when the soil was frozen, and early June, when flux rates peaked (Janssens et al., 1999a).
Soil CO2 efflux measurements with the closed chamber IRGA system during spring 1997 and dur-ing the course of this experiment indicated that the diurnal fluctuations were very small. This observa-tion was consistent with other studies (Kursar, 1989; Janssens et al., 1998), and is probably related to the small changes in soil temperature under forest canopies. Typical ranges for diurnal changes in soil CO2efflux at the site were ±10% around the mean. After smoothing, fluxes estimated by the model were always within 5% of the measured flux (Fig. 2).
Due to the homogeneous weather conditions, only small fluctuations in the soil fluxes were ob-served during the course of the experiment. The mean model output for the entire 3-week period was 1.27mmol m−2s−1, and ranged between 1.15 and
1.39mmol m−2s−1. This mean soil CO2 efflux was
not significantly different from the measured fluxes
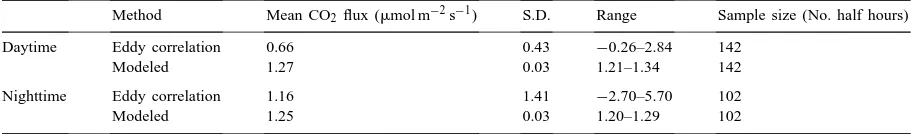
Table 3
Comparison of daytime and nighttime fluxes as estimated by the eddy flux system and the modela
Method Mean CO2 flux (mmol m−2s−1) S.D. Range Sample size (No. half hours)
Daytime Eddy correlation 0.66 0.43 −0.26–2.84 142
Modeled 1.27 0.03 1.21–1.34 142
Nighttime Eddy correlation 1.16 1.41 −2.70–5.70 102
Modeled 1.25 0.03 1.20–1.29 102
aMean CO2 flux for the entire experiment, standard deviation (S.D.), range of the fluxes and sample size are presented. Negative values indicate downward fluxes.
Fig. 4. Diurnal plots of eddy covariance and modeled CO2fluxes. Each eddy flux data point is the mean of all measurements obtained during the entire experiment for that time period. Also in the model output, only those time periods with available eddy flux data were incorporated. Error bars indicate 1 S.D. Positive values are upward fluxes.
during the same period in 1996 and 1997 (0.94 and 1.31mmol m−2s−1, respectively).
3.2. Eddy covariance measurements
Mean daytime CO2 flux, averaged over all avail-able half-hourly data between 7:30 and 19:30 h, was 0.66mmol m−2s−1 (Table 3). This flux was
considerably smaller than the nighttime mean of 1.16mmol m−2s−1 (Fig. 4), but was not statistically
photosynthetic activity of the dense moss layer at the forest floor. Similar diurnal differences at the moss surface were reported by Goulden and Crill (1997) for a boreal black spruce forest in Canada. They found that in summer, moss photosynthesis repre-sented 20–50% of total forest photosynthesis, and took up most of the CO2 respired in the soil. As day/night differences in soil temperature were small (Tables 1 and 2), we assumed that total photosyn-thetic CO2 uptake by the mosses could be crudely approximated from the day/night difference in gas exchange. The result was a considerable mean uptake of 0.5mmol m−2s−1 (Table 3), which was also
con-sistent with the data reported by Goulden and Crill (1997).
From the available daytime and nighttime eddy flux data (Tables 1 and 2), it is clear that variability was significantly larger at night. Unpredictable fluctuations in the nocturnal flux data are often reported (Greco and Baldocchi, 1996; Valentini et al., 1996) and may be related to incomplete mixing during periods of diminished and/or intermittent turbulence, which are common in canopies. In these conditions, the turbulent flux at the measurement height is not directly related to the soil efflux. When there is no turbulence, there is no turbulent flux, regardless of soil respiratory activ-ity. Other atmospheric processes, not directly detected by an eddy flux system, become important. Storage, advection, and molecular transport may establish het-erogeneous and three-dimensional gradients of CO2. The observed variability in the measured fluxes may therefore be explained by episodic turbulent mix-ing across these variable gradients. Application of a threshold in friction velocity did not reduce this variability.
The eddy flux data did not reveal large spatial vari-ability between the different wind directions. This was consistent with chamber measurements of soil CO2 efflux made around the eddy flux system (data not shown). The flux data were also not correlated with soil temperature, even considering nighttime data only, when moss photosynthesis did not occur.
3.3. Comparison of eddy fluxes and model
Literature data on technique comparisons for mea-suring soil CO2efflux involving eddy covariance are very scarce. Norman et al. (1997) compared the eddy
covariance technique with a closed chamber IRGA system. On one specific day they found a nice agree-ment between both techniques, but on another day their eddy flux result was only half the flux mea-sured by the closed chamber system. After adjusting their eddy covariance results for the understorey photosynthesis both systems agreed better, although the eddy flux result was characterized by a much larger temporal variability than the chamber system (Norman et al., 1997). The latter phenomenon was also observed in this study. Variability in the model output was small (0.03mmol m−2s−1, Table 3) due
to the limited range of soil temperature and moisture over the course of the comparison. The model variabil-ity was dominated by the long-term temperature trend over the measurement period and diurnal variations were eliminated largely by the smoothing operation (see Section 2.3). The eddy covariance measurements were far more variable, a result which was consistent with the large fluctuations in eddy fluxes (even for daily averages) observed above a boreal jack pine for-est floor (Baldocchi et al., 1997). Variability in such fluxes results from natural geophysical variability in the flow and turbulence (Wesely and Hart, 1985), and appears to be inherent to below-canopy eddy flux measurements.
(Skre and Oechel, 1979; Oechel and van Cleve, 1986). Thus, we did not observe differences in the overall mean nighttime flux estimated by both techniques (Table 3).
4. Conclusions
Soil chambers and eddy covariance are two meth-ods for measuring different aspects of forest carbon cycling, each with advantages and disadvantages. Chamber methods give an estimate of soil–atmosphere interactions in specific locations. Eddy fluxes inte-grate surface–atmosphere exchanges over larger spa-tial areas. The difference between surface and soil can be large, particularly when understorey vegetation is significant.
To avoid interference between the two methods, an empirical model simulated the chamber measurements for comparison against the eddy fluxes. During the in-tercomparison, the chamber/model approach predicted soil CO2 effluxes of 1.3±0.1mmol m−2s−1. Diurnal
variations in the efflux were small relative to changes over the 3-week sampling period. The eddy covariance measurements showed much more variability, and also a diurnal dependence believed to be governed by both biological and atmospheric processes. Daytime turbu-lent fluxes of CO2were lower than the modeled soil ef-flux by an average of 0.6mmol m−2s−1, probably due
to the effects of moss photosynthesis. Nighttime eddy fluxes of CO2 agreed with the modeled soil efflux, but showed a larger variability that is consistent with the characteristic inhomogeneity and intermittency of nocturnal turbulence.
With the appropriate data analysis and quality checking, the eddy covariance method appears to be well suited to measure below-canopy gas exchange at this site. This intercomparison illustrates the dif-ference between processes measured by this method in comparison with soil chamber measurements. The influence of moss, which did not affect the chamber measurements, appears to have caused the difference between the fluxes measured by the two methods. Al-though not often modeled or accounted for explicitly, moss may be an important player in carbon cycling for some forests. When eddy covariance is used to estimate soil CO2efflux, large uncertainties must be accepted at night. Further intercomparison studies are
needed to illustrate the agreement between the two methods for a wider range of soil temperature and moisture conditions.
Acknowledgements
This work contributes to the GCTE Core project of the IGBP and was funded by the EC Fourth Framework Programme on Environment and Climate Research ‘EUROFLUX’ (Contract No. ENV4-CT95-0078). Special thanks to Andreas Ibrom and Kai Morgenstern (Institut für Biokliomatologie, Univer-sität Göttingen, Germany) for the loan of the sonic anemometer, supporting electronics, and data logging software. The authors acknowledge the input of two anonymous reviewers, whose comments improved the quality of the paper, as well as the Institute for Forestry and Game Management, Flanders, Belgium, for logistic support at the site. Fred Kockelbergh helped to design and construct the plumbing and heating systems. IAJ is a Post-doctoral Fellow of the Fund for Scientific Research Flanders (FWO).
References
Baeyens, L., Van Slycken, J., Stevens, D., 1993. Description of the soil profile in Brasschaat. Institute for Forestry and Game Management, Geraardsbergen, Belgium.
Baldocchi, D.D., Meyers, T.P., 1991. Trace gas exchange above the floor of a deciduous forest 1. Evaporation and CO2 efflux. J. Geophys. Res. 96, 7271–7285.
Baldocchi, D.D., Verma, S.B., Matt, D.R., Anderson, D.E., 1986. Eddy-correlation measurements of carbon dioxide efflux from the floor of a deciduous forest. J Appl. Ecol. 23, 967–976. Baldocchi, D.D., Vogel, C.A., Hall, B., 1997. Seasonal variation
of carbon dioxide exchange rates above and below a boreal jack pine forest. Agric. For. Meteorol. 83, 147–170. Cermak, J., Riguzzi, F., Ceulemans, R., 1998. Scaling up from
the individual tree to the stand level in Scots pine. I. Needle distribution, overall crown and root geometry. Annal. Sci. For. 55, 63–88.
de Pury, D.G.G., Ceulemans, R., 1997. Scaling-up carbon fluxes from leaves to stands in a patchy coniferous/deciduous forest. In: Mohren, G.M.J., Kramer, K., Sabaté, S. (Eds.), Impacts of Global Change on Tree Physiology and Forest Ecosystems. Kluwer Academic Publishers, Dordrecht, pp. 263–272. Denmead, O.T., Raupach, M.R., 1993. Methods for measuring
Edwards, N.T., 1982. The use of soda-lime for measuring respiration rates in terrestrial ecosystems. Pedobiologia 23, 321– 330.
Fang, C., Moncrieff, J.B., 1996. An improved dynamic chamber technique for measuring CO2 efflux from the surface of soil. Funct. Ecol. 10, 297–305.
Gond, V., de Pury, D.G.G., Veroustraete, F., Ceulemans, R., 1999. Seasonal variation of leaf-area index, leaf chlorophyll and water content scaled up to fAPAR to estimate the carbon balance of a temperate multi-layer, multi-species forest. Tree Physiol. 19, 673–679.
Goulden, M.L., Crill, P.M., 1997. Automated measurements of CO2 exchange at the moss surface of a black spruce forest. Tree Physiol. 17, 537–542.
Greco, S., Baldocchi, D.D., 1996. Seasonal variations of CO2 and water vapour exchange rates over a temperate deciduous forest. Global Change Biol. 2, 183–197.
Iritz, Z., Lindrot, A., Gärdenäs, A., 1997. Open ventilated chamber system for measurements of H2O and CO2fluxes from the soil surface. Soil Technol. 10, 169–184.
Janssens, I.A., Ceulemans, R., 1998. Spatial variability in forest soil CO2efflux assessed with a calibrated soda lime technique. Ecol. Lett. 1, 95–98.
Janssens, I.A., Barigah, S.T., Ceulemans, R., 1998. Soil CO2efflux rates in different tropical vegetation types in French Guiana. Annal. Sci. For. 55, 671–680.
Janssens, I.A., Meiresonne, L., Ceulemans, R., 1999a. Mean soil CO2 efflux from a mixed forest: temporal and spatial integration. In: Ceulemans, R., Veroustraete, F., Gond, V., Van Rensbergen, J. (Eds.), Forest Ecosystem Modelling, Upscaling and Remote Sensing. SPB Academic Publishing, The Hague, pp. 19–33.
Janssens, I.A., Sampson, D.A., Cermak, J., Meiresonne, L., Riguzzi, F., Overloop, S., Ceulemans, R., 1999b. Above- and below-ground phytomass and carbon storage in a Belgian Scots pine stand. Annal. For. Sci. 56, 81–90.
Janssens, I.A., Kowalski, A.S., Longdoz, B., Ceulemans, R., 2000. Assessing forest soil CO2efflux: an in situ comparison of four techniques. Tree Physiol. 20, 23–32.
Kimball, B.A., Lemon, E.R., 1971. Air turbulence effects upon soil gas exchange. Soil Sci. Soc. Am. Proc. 35, 16–21. Kowalski, A.S., Overloop, S., Ceulemans, R., 1999. Eddy fluxes
above a Belgian, Campine forest and their relationship with predicting variables. In: Ceulemans, R., Veroustraete, F., Gond, V., Van Rensbergen, J. (Eds.), Forest Ecosystem Modelling, Upscaling and Remote Sensing. SPB Academic Publishing, The Hague, pp. 3–17.
Kursar, T.A., 1989. Evaluation of soil respiration and soil CO2 concentration in a lowland moist forest in Panama. Plant and Soil 113, 21–29.
McMillen, R.T., 1988. An eddy correlation technique with extended applicability to non-simple terrain. Boundary Layer Meteorol. 43, 231–245.
Mosier, A.R., 1990. Gas flux measurement techniques with special reference to techniques suitable for measurements over large
ecologically uniform areas. In: Bouwman, A.F. (Ed.), Soils and the Greenhouse Effect. Wiley, Chichester, pp. 289–301. Nakayama, F.S., 1990. Soil respiration. Remote Sensing Rev. 5,
311–321.
Norman, J.M., Garcia, R., Verma, S.B., 1992. Soil surface CO2 fluxes and the carbon budget of a grassland. J. Geophys. Res. 97, 18845–18853.
Norman, J.M., Kucharik, C.J., Gower, S.T., Baldocchi, D.D., Crill, P.M., Rayment, M., Savage, K., Striegl, R.G., 1997. A comparison of six methods for measuring soil–surface carbon dioxide fluxes. J. Geophys. Res. 102, 28771–28777.
Oechel, W.C., van Cleve, K., 1986. The role of bryophytes in nutrient cycling in the taiga. In: van Cleve, K., Chapin III, F.S., Flanagan, P.W., Viereck, L.A., Dyrness, C.T. (Eds.), Forest Ecosystems in the Alaskan Taiga. Springer, New York, pp. 121–137.
Raich, J.W., Schlesinger, W.H., 1992. The global carbon dioxide flux in soil respiration and its relationship to vegetation and climate. Tellus 44B, 81–99.
Rayment, M.B., Jarvis, P.G., 1997. An improved open chamber system for measuring soil CO2effluxes of a Boreal black spruce forest. J. Geophys. Res. 102, 28779–28784.
Rosenberg, N.J., Blad, B.L., Verma, S.B., 1983. Microclimate. The Biological Environment. Wiley, New York, p. 495.
Ryan, M.G., Lavigne, M.B., Gower, S.T., 1997. Annual carbon cost of autotrophic respiration in boreal forest ecosystems in relation to species and climate. J. Geophys. Res. 102, 28871– 28884.
Schlentner, R.E., van Cleve, K., 1985. Relationships between soil CO2 evolution from soil, substrate temperature, and substrate moisture in four mature forest types in interior Alaska. Can. J. For. Res. 15, 97–106.
Skre, O., Oechel, W.C., 1979. Moss production in a black spruce Picea mariana forest with permafrost near Fairbanks, Alaska, as compared with two permafrost-free stands. Holarct. Ecol. 2, 249–254.
Uchida, M., Nojiri, Y., Saigusa, N., Oikawa, T., 1997. Calculation of CO2 flux from forest soil using 222Rn calibrated method. Agric. For. Meteorol. 87, 301–311.
Valentini, R., De Angelis, P., Matteucci, G., Monaco, R., Dore, S., Scarascia Mugnozza, G.E., 1996. Seasonal net carbon dioxide exchange of a beech forest with the atmosphere. Global Change Biol. 2, 199–207.
Van den Berge, K., Maddelein, D., De Vos, B., Roskams, P., 1992. Analyse van de luchtverontreiniging en de gevolgen daarvan op het bosecosysteem. AMINAL/RUG, Belgium (in Dutch).
Vitousek, P.M., Mooney, H.A., Lubchenco, J., Melillo, J.M., 1997. Human domination of earth’s ecosystems. Science 277, 494– 499.