POLINSAR COHERENCE-BASED REGRESSION ANALYSIS OF FOREST BIOMASS
USING RADARSAT-2 DATASETS
Jenia Singh, Shashi Kumar, S.P.S Kushwaha
Indian Institute of Remote Sensing, ISRO Dehradun, 248001, India
([email protected], [email protected], [email protected])
Commission VI, WG VIII/7
KEY WORDS: Backscatter, Complex coherence, Forest biomass, Polarimetric Interferometric SAR (POLINSAR).
ABSTRACT:
Forests play a pivotal role in synchronizing earth’s carbon cycle by absorbing carbon from the atmosphere and storing it in the form of biomass. Researchers today are trying to understand the climatic variations, especially those occurring due to destruction of forest and its corresponding biomass loss. Hence, quantification of various forest parameters such as biomass is imperative for evaluating the carbon. The objective of this research was to exploit the potential of C-band Radarsat-2 Polarimetric Interferometric Synthetic Aperture Radar (PolInSAR) technique for analysing the relationship between complex coherence and field-estimated aboveground biomass. Association between the backscatter and the aboveground biomass was also established in the process. To serve our objective, Radarsat-2 interferometric pair dated 4thMarch, 2013(master image) and 28th March, 2013 (slave image) were procured for the Barkot Reserve Forest region of Dehradun, India. Field sampling was done for 30 plots (31.62m x 31.62m) and stem diameter and tree height were measured in each plot. The study emphasized on the application of POLINSAR coherence instead of using conventional method of relying on backscatter values for retrieving forest biomass. Coherence matrices were utilized for generating complex coherence values for different polarization channels and were regressed against field estimated aboveground biomass. Results indicated a negative linear relationship between complex coherence and aboveground biomass with the cross – polarized coherence showing the highest R2 value of 0.71. Further, the backscatter mechanism when studied with respect to aboveground biomass indicated a positive linear relationship between backscatter values and field estimated aboveground biomass with R2 value of 0.45 and 0.61 for slave and master image respectively. The results suggest that PolInSAR technique, in combination with different modelling approaches, can be adopted for estimating forest biomass.
1. INTRODUCTION
The long term net carbon flux between terrestrial ecosystems and the atmosphere has been dominated by changes in forest area and changes in forest biomass per hectare (Houghton, 2005).Terrestrial biosphere serves as the crucial component in carbon cycle with most of the carbon present in forest. Forests contain about 50% of the world’s terrestrial organic carbon stocks, locking up 335-365 Gt of carbon each year, thus making them a potential carbon source. Changes in this component brought about by various anthropogenic activities such as land use change, together with fossil fuel burning are assumed to be dominant drivers of the climate change. However the status and dynamics of the terrestrial biosphere are least understood with lack of information about forest biomass posing as the most uncertain element in the carbon cycle(IPCC,2000).This uncertainty in quantification of forest biomass can be resolved with the integrationof ground data, ecological and vegetation models together with earth observation data. Efforts have been made to characterize and quantify forest biomass using remote sensing which offers comprehensive spatial and temporal coverage capability, thereby proving to be a promising tool in aboveground biomass estimation. Synthetic aperture radar (SAR) has been preferred over optical datasets for estimating forest biomass. SAR overcomes the following constraints posed by optical dataset 1) It is intricate to retrieve parameters from mixed stands.2) Loss of sensitivity by reflectance data to forest parameters after total coverage of the canopy.3) Inability to penetrate through the vegetation and clouds (Le Toan et.al., 1992).Many studies have reported correlations between SAR
backscatter and forest stand parameters such as age, basal area, height and biomass(Wu et.al.,1987,Hussin et.al.,1991 and Dobson et.al.,1992)) and have successfully demonstrated that SAR data can be used to discriminate different forest types(Cimino et.al., 1986) as well as SAR image at L band is proportional to the aboveground biomass of the forest stand. Previous researches have analysed the potential of single and dual polarized SAR data in aboveground biomass and other bio-physical parameters quantification(Kushwaha et.al.,2000 and Pandey et.al.,2010).While if fully polarimetric dataset is employed in the study it allows to extract information on all scattering parameters(surface, double bounce and volume scattering) from a single SAR resolution cell. Three basic approaches namely backscatter, coherence and phase based are utilized for biomass mapping from SAR. Backscatter mechanism increases with increasing forest biomass, but this function saturates at a wavelength dependent biomass density, which limits its usefulness for biomass mapping (Imhoff,1995).Coherence which does not saturates till 350t/ha, proves to be a potential approach for quantifying bio-physical parameters. Present study intends to exploit the potential of fully polarimetric C-band dataset for analyzing the relationship between complex coherence and field estimated aboveground biomass. Also association between the backscatter and the aboveground biomass is established in the process. For accomplishment of the stated objectives, SAR fully polarimetric data in Single Look Complex (SLC) format is decomposed for extraction of the polarimetric information in all scattering mechanisms like Bragg’s surface scattering, double bounce scattering and Fresnel’s volume scattering. The study employs
four component decomposition technique proposed by Yamaguchi et.al., 2005and three component Freeman Durden decomposition from the coherence matrix. Complex coherence values of different polarization channels were also retrieved from polarimetric interferometric SAR coherence matrix. In this paper relationshipexisting between complex coherences of different polarization channels and aboveground biomass from POLINSAR data is described. The study is motivated by application of complex coherence.
2. STUDY AREA 2.1 Test site description
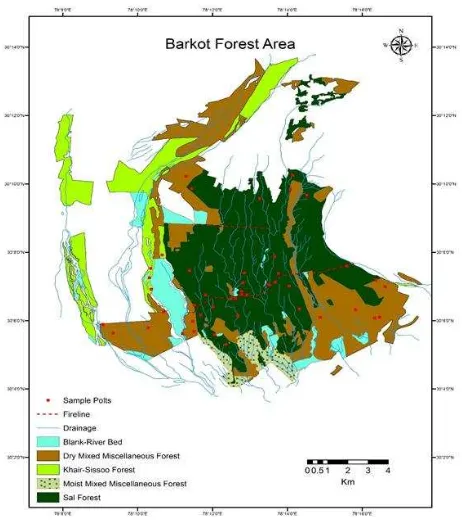
The study has been carried out in Barkot Reserve Forest (78.16°-78.28°E and 30.06°-30.17°N), a subtropical moist deciduous forest located in Doon valley in Uttrakhand State of India (Fig.1).Barkot Reserve forest covers an area of around 1800 km2. The study area comprises of variable forest density classes with natural Sal (Shorea robusta) mixed forest and the teak (Tectona grandis) plantations. Besides these Chamror (Ehretia laevis Roxb.), Sagaun (Tectona grandis L.f.), Rohini (Mallotus philippensis), Amaltash (Cassia fistula L.), Bel (Aegle marmelos (L) Correa) and Jamun (Syzgium cumini(L.)Skeels) are also found in the test site. The vegetation canopy is diverse and species composition, canopy density and height vary substantially across the extent of the Barkot Reserve Forest resulting in heterogeneity in scattering properties. The total biomass carbon content varies from 80 t/ha to 250 t/ha. A total of 30 field plots of size 31.62m x 31.62m have been covered in whole test site. Circumference at breast height (CBH) and the tree height was measured for different species present within the study area.
Figure 1. LULC Map of Barkot Forest Area. Source: Forest Department, Uttrakhand, India
2.2 SAR Data used
Radarsat-2 satellite covering Barkot Reserve Forest has been used in the study. Two scenes of Radarsat-2 quad pol data in
SLC format of level 1.1 were acquired for date 4th March, 2013 (master image) and 28th March, 2013(slave image). Mode of acquisition for the images was fine quad polarization. Table 1. displays the specifications of the data.
Description Master Image Slave Image
Wavelength(cm) 5.55 5.55
Frequency Band C Band C Band
Incidence Angle (°) 39.28 39.28 Centre Latitude(°) 30.1707 30.1685 Centre Longitude(°) 78.1866 78.1840
Table 1. Radarsat-2 data specifications
3. METHODOLOGY
Accomplishment of the intended objectives involved field data processing and satellite data processing.
3.1 Field data processing
Field data comprised of measurement of tree height and CBH for each tree in the sample plots of size 31.62m x 31.62m. Sampling plots were planned using stratified random sampling method. The CBH was converted to diameter at breast height (DBH) using the circumference formula. The stem volume of each tree was calculated using the species- specific volume equations from the Forest Survey of India (Forest Survey of India, 1996).Quarter girth formula was used for the species for which specific volume equations were not present. Stem volume was calculated using the Equation (1) given below:
(1)
Where Vqg is the stem volume, g refers to the circumference at breast height, d is the diameter of the tree, and h is the height. Finally AGB was calculated using stem volume and species specific gravity values (Limaye et.al., 1956).The equation to calculate AGB is given as: backscattering properties of the earth features can be described using 2 x 2 scattering matrix. Scattering matrix can compute the strength, polarization and polarization signature of a scattered wave for any polarization of an incident wave at every image pixel (CCRS, Tutorial). Precise baseline was estimated for conversion of interferometric phase into surface heights. Normal baseline for the data pair was found to be 78 m with a critical baseline of 3857.57m. Because of the inability of scattering matrix to extract information about complex multiple targets in a single resolution cell, second order derivatives of scattering matrix – coherence matrix has been implemented. These second order derivatives are obtained from Pauli and Lexicographic basis scattering vectors (Anfinsen et.al., 2008).The coherence matrix is obtained by multiplying the Pauli basis vector with its complex conjugate transpose ( Neumann,2009) as shown in Equation (3).
(3)
Where is a Pauli basis vector defined mathematically by Equation (4):
√ [
] (4)
[
] (5)
Equation (5) represents the vectorized form of two scattering matrices of master and slave images which are further used in creation of coherence matrix [T6] as shown below:
[ ] [
]
(6)
T11 and T22 are the polarimetric coherency matrices generated for master and slave images. Ω12 and Ω12ϯ are the cross-correlation matrices which describe the polarimetric and interferometric association that exist between two polarimetric images. Complex coherences are retrieved from the product of magnitude of complex coherence and phase factor. Phase factor is the phase difference between master and slave images and is given as:
(7)
Complex coherence for different polarization combinations can be obtained using Equation (8).
√
=
√
(8)
are unitary projection vectors and , are scalar scattering coefficients. Coherence generated from above stated equations is in complex form and therefore the magnitude of coherence was extracted from amplitude images.
√ (9)
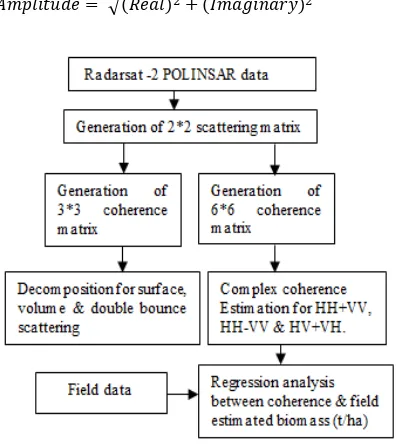
Figure 2. Methodology adopted
Coherence values extracted from images were used for regressing against field calculated AGB. The second order coherence matrix generated was used as an input for decomposition of data into different scattering mechanism. Depending upon distribution and orientation of scatterers, polarimetric response from a target is measured in terms of surface scattering, double bounce scattering and volume scattering. Comparison has been drawn out between Yamaguchi four Component decomposition and Freeman Durden three component decomposition for the study area.
4. RESULTS AND DISCUSSIONS
In the comparative study between two polarimetric decompositions, over estimation of volume scattering has been observed in Freeman Durden three component decomposition then compared to four component Yamaguchi decomposition.(Fig.3a). In Yamaguchi decomposition double bounce scattering was more prominent (Fig.3b) because of an added fourth component, a helix scattering power term, which often appears in complex urban areas (Yamaguchi et.al.,2005).
(a) (b)
Figure 3. (a) Freeman Durden polarimetric decomposition, (b) Yamaguchi Four Component polarimetric decomposition. (Red- double bounce scattering, Green- volume scattering,
Blue- surface scattering)
Backscatter mechanism when studied with respect to aboveground biomass showed a positive linear relationship between backscatter values and the field estimated aboveground biomass with a coefficient of determination(R2) of 0.45 and 0.68 for slave and master images respectively(Fig 4a & 4b). The increasing trend of backscatter values with increasing biomass can also be seen in the study by Santoro et.al., 2006.
(a)
Figure 4. (a) Forest backscatter vs. aboveground biomass for slave image procured on 28th March 2013
(b)
Figure 4. (b) Forest backscatter vs. aboveground biomass for master image
The relationship between forest backscatter and aboveground biomass calculated from field data for both the data sets shows a positive correlation. SAR backscatter is a sum of surface, double bounce and volume scattering; hence increase in volume scattering will also result in overall increase in total backscatter. Analysis showed that correlation coefficient of master image turns out to be higher (0.82) than that of the slave image (0.67).
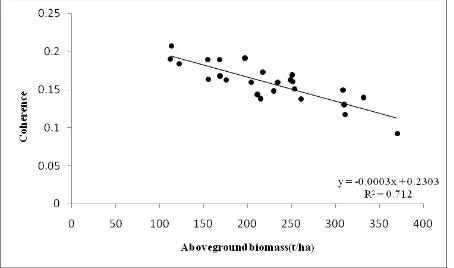
The generated coherence matrix has been utilized for retrieving complex coherence for different polarization channels. These complex coherences were investigated and regressed against the field estimated aboveground biomass. Results indicated a negative linear relationship between complex coherence and aboveground biomass. Forests are natural medium with lower coherence values as their orientation changes frequently and natural phenomenon like rain make them unstable scatterers (Wagner et.al., 2000). The R2 values of 0.204. 0.126, and 0.71 were obtained for coherence contributed by surface scatterers (HH+VV),double bounce scatterers(HH-VV),and the volume scatterers(HV+VH).The R2 value of HV+VH complex coherence component was found to be relatively higher than other polarization components (Fig.5) and seems to be the most suitable polarization channel for different forest bio-physical parameter retrieval.
Figure 5. Total coherence vs. aboveground biomass for HV+VH polarimetric channel.
5. CONCLUSIONS
The main objective of the study was to develop an understanding of relationship existing between different
polarization channel’s complex coherence components and field estimated aboveground biomass (t/ha) using POLINSAR data. It was seen that that an increase in biomass paralleled a decrease in total forest coherence. The cross-polarized complex coherence channel gave the highest coefficient of determination (R2) of 0.71, as compared to co- polarized channel values, which concludes the potential of cross polarized channel in forest and vegetation mapping. In addition to the study of complex coherence, association between backscatter and aboveground biomass was also studied. It was observed that an increase in AGB values corresponded with an increase in total backscatter values, especially with the volume scattering. The results recommend that the use of fully polarimetric data in combination with POLINSAR coherence and various modelling approaches can serve as a promising tool for assessing forest bio- physical parameters.
6. REFERENCES
Anfinsen, S. N., Doulgeris, A. P., & Eltoft, T., 2008. Estimation of the equivalent number of looks in polarimetric SAR imagery. In Geoscience and Remote Sensing Symposium, 2008. IGARSS 2008. IEEE International (Vol. 4, pp. IV-487). IEEE.
Canada Centre for Remote Sensing, Tutorial: Radar Polarimetry, Educational Resources for Radar Remote Sensing. [Online], Available:
http://www.ccrs.nrcan.gc.ca/resource/tutor/gscarcd/pdf/gscard Last accessed 25th October 2014.
Cimino, J., Brandani, A., Casey, D., Rabassa, J., & Wall, S. D., 1986. Multiple incidence angle SIR-B experiment over Argentina: mapping of forest units. Geoscience and Remote Sensing, IEEE Transactions on, (4), 498-509.
Dobson, M. C., Ulaby, F. T., LeToan, T., Beaudoin, A., Kasischke, E. S., & Christensen, N., 1992. Dependence of radar backscatter on coniferous forest biomass. Geoscience and Remote Sensing, IEEE Transactions on, 30(2), 412-415.
Forest Survey of India, Volume Equations for Forests of India, Nepal and Bhutan, Ministry of Environment and Forests, Dehra Dun, India., 1996, pp. 1-249.
Houghton, R. A., 2005. Aboveground forest biomass and the global carbon balance. Global Change Biology, 11(6), 945-958.
Hussin, Y. A., Reich, R. M., & Hoffer, R. M., 1991. Estimating splash pine biomass using radar backscatter. Geoscience and Remote Sensing, IEEE Transactions on, 29(3), 427-431
.
Imhoff, M. L., 1995. Radar backscatter and biomass saturation: ramifications for global biomass inventory. Geoscience and Remote Sensing, IEEE Transactions on, 33(2), 511-518.
Le Toan, T., Beaudoin, A., Riom, J., & Guyon, D., 1992. Relating forest biomass to SAR data. Geoscience and Remote Sensing, IEEE Transactions on, 30(2), 403-411.
Limaye,V.D., & Sen,B.R.,1956. Weight and Specific Gravity of Indian Woods.Forest Research Institute, Indian Forest Records, vol. I–VI, Dehradun, India.
Neumann,M.,2009. Remote sensing of vegetation using multi-baseline polarimetric SAR interferometry: theoretical modelling and physical parameter retrieval. University of Rennes 1, France.
Pandey, U., Kushwaha, S. P. S., Kachhwaha, T. S., Kunwar, P., & Dadhwal, V. K., 2010. Potential of Envisat ASAR data for woody biomass assessment. Tropical Ecology, 51(1), 117.
Santoro, M., Eriksson, L., Askne, J., & Schmullius, C., 2006. Assessment of stand‐wise stem volume retrieval in boreal forest from JERS‐1 L‐band SAR backscatter. International Journal of Remote Sensing, 27(16), 3425-3454.
Kushwaha,S.P.S.,Dwivedi,R.S.,& Rao,B.R.M., 2000. Evaluation of various digital image processing techniques for detection of coastal wetlands using ERS-SAR data. International Journal of Remote Sensing, vol. 21, pp. 565-579
Wagner, W., Vietmeier, J., Schmullius, C., Davidson, M., Le Toan, T., Quegan, S., & Gaveau, D., 2000. The use of coherence information from ERS tandem pairs for determining forest stock volume in SIBERIA. In Geoscience and Remote Sensing Symposium, 2000. Proceedings. IGARSS 2000. IEEE 2000 International (Vol. 4, pp. 1396-1398). IEEE.
Watson, R. T., Noble, I. R., Bolin, B., Ravindranath, N. H., Verardo, D. J., & Dokken, D. J., 2000. Land use, land-use change and forestry: a special report of the Intergovernmental Panel on Climate Change. Cambridge University Press.
Wu, S. T., 1987. Potential application of multipolarization SAR for pine-plantation biomass estimation. Geoscience and Remote Sensing, IEEE Transactions on, (3), 403-409.
Yamaguchi, Y., Moriyama, T., Ishido, M., & Yamada, H., 2005. Four-component scattering model for polarimetric SAR image decomposition. Geoscience and Remote Sensing, IEEE Transactions on, 43(8), 1699-1706.