SPATIO-TEMPORAL URBAN CHANGE ANALYSIS AND THE ECOLOGICAL
THREATS CONCERNING THE THIRD BRIDGE IN ISTANBUL CITY
A. Akın*a, S. Aliffi*b, F. Sunar*c
*a Bursa Technical University, Department of Urban and Regional planning, Bursa, Turkey, [email protected] *b Polytechnic of Turin, Department of Environment, Land and Infrastructure Engineering, Turin, Italy,
*c Istanbul Technical University, Department of Geomatics Engineering, Istanbul, Turkey, [email protected]
Commission VII, WG 5
KEY WORDS: Istanbul, Urban Sprawl, MCA, CA Markov.
ABSTRACT:
Urban growth is a complex dynamical process associated with landscape change driving forces such as the environment, politics, geography and many others that affect the city at multiple spatial and temporal scales. Istanbul, one of the largest agglomerations in Europe and the fifth-largest city in the world in terms of population within city limits, has been growing very rapidly over the late 20th century at a rate of 3.45%, causing to have many environmental issues. Recently, Istanbul’s new third bridge and proposed new routes for across the Bosphorus are foreseen to not only threaten the ecology of the city, but also it will give a way to new areas for unplanned urbanization. The dimensions of this threat are affirmed by the urban sprawl especially after the construction of the second bridge and the connections such as Trans European Motorway (TEM).
Since the spatial and temporal components of urbanization can be more simply identified through modeling, this study aims to analyze the urban change and assess the ecological threats in Istanbul city through the proper modeling for the year 2040. For this purpose, commonly used urban modeling approach, the Markov Chain within Cellular Automata (CA), was selected to simulate urban/non-urban growth process. CA is a simple and effective tool to capture and simulate the complexity of urban system dynamic. The key factor for a Markov is the transition probability matrix, which defines change trend from past to today and into the future for a certain class type, and land use suitability maps for urban. Multi Criteria Analysis was used to build these suitability maps. Distance from each pixel to the urban, road and water classes, plus the elevation, slope and land use maps (as excluded layer) were defined as factors. Calibration data were obtained from remotely sensed data recorded in 1972, 1986 and 2013. Validation was performed by overlaying the simulated and actual 2013 urban maps and Kappa Index of Agreement was calculated. The results indicate that the urban expansion will influence mainly forest areas during the time period of 1972–2040.
1. INTRODUCTION
Urban growth is a complex dynamical process associated with landscape change driving forces such as the environment, politics, geography and many others that affect the city at multiple spatial and temporal scales. Istanbul, one of the largest agglomerations in Europe and the fifth-largest city in the world in terms of population within city limits, has been growing very rapidly over the late 20th century at a rate of 3.45%, causing to have many environmental issues. The management of a proper growth of such city is never simple, there are many parameters affecting its development. As a crucial prerequisite for better land use planning, information on existing land use patterns and changes over time is essential (Bagan & Yamagata, 2012; Koomen, et.al., 2007). In other words, information concerning past, current, and future growth plays an important role in the decision-making process (Patino & Duque, 2013; Schneider & Woodcock, 2008). Parallel to the advancement of geographic information systems (GIS) and remote sensing, many significant contributions in this field have been made (Bhatta et al., 2010; Patino & Duque, 2013). Using these two advanced techniques, the land use/land cover change (Overmars & Verburg, 2006) can relate to urban growth models (Mahiny & Clarke, 2012; Estoque & Murayama, 2012; He et al., 2013; Arsanjani, et.al, 2013).
There are two complementary issues for implementing appropriate actions for better planning strategies; (i) monitoring growth which helps to develop an understanding of past trends and growth patterns; (ii) simulation-based modeling which provides insights into possible future developments.
This study will focus on the urban sprawl of Istanbul and analyze the consequences of one of the important projects included in numerous national investment programs, namely the “Third Bosphorus Bridge”. This new bridge planned to be erected on the North boundaries of Istanbul, threatens the natural forest areas in the northern part of the city. In this study, the urban growth related to the consequences of this new bridge will be foreseen through an urban simulation-based modeling approach. In the modeling, the Markov Chain model in the frame of Cellular Automata (CA) approach which is simple and effective approach to capture and simulate the complexity of land use/land cover and urban system dynamics, is used.
future development pressure points, and to implement appropriate actions for the negative environmental impacts upon the northern parts of Istanbul, where most forest areas and water basins are contained.
2. STUDY AREA
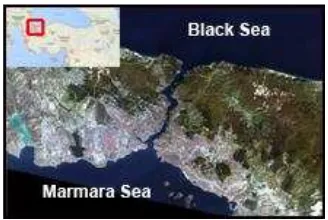
Being the only city in the world connecting two continents (Europe and Asia), Istanbul has always had a strategic importance as the cultural, economic and political heart of Turkey. The city, having an area of 5.343 km², is situated in the north west of Turkey with a population, in 2013, of 14.160.467, increased by 2.2% compared to the previous year (TUIK, 2013). For the computational efficiency, the area covers the Durugöl and the Büyükçekmece water reservoirs on the left side, and the Ömerli dam in the right side are taken into consideration as a study area (Figure 1).
Figure 1: The satellite image and map of the study area (Landsat 8 image, 30/7/2013).
3. MATERIAL
In order to perform the change detection and the simulation-based modeling of the urban growth of Istanbul, three different dates (t1, t2 and t3), related to the important transportation infrastructures connecting the Asian and European side (i.e. the First Bosphorus Bridge, the Second Bosphorus Bridge and the planned Third Bosphorus Bridge), were chosen. In the selection of the satellite images to be used, the construction dates of these bridges were taken in the consideration, hence the satellite data were chosen as close as possible to these dates. Since the area to be analyzed are around 93km x 63km in size, the Landsat images, as being a medium spatial resolution data and having a large archive in USGS, were chosen in the analysis. Dates of the construction of the bridges and the satellite images used are given in the Table 1. As seen from the table, similar acquisition periods were considered due to the seasonal changes that would affect both the classification and change detection processes. The quality of the 1972 image data is rather low; however it was the only dataset in the USGS archive. Furthermore, some additional maps such as DEM, slope, road and urban maps were used as an initial input data in the simulation-based modeling. Besides, the Istanbul municipality base map (CDP) was used for the evaluation of the current urban development and the digitization of some areas needed in the modeling
Acquisition date 15/11/1972 24/10/1986 19/11/2013
4. METHOD
4.1 Preprocessing
Images from different dates, or from different sensors, have to be registered to a common coordinate system in order to be evaluated together. This coordinate system can be one of the images, used as a reference, or can be a map projection. Since all Landsat images downloaded from the archive were already orthorectified, as a first step, the study area (3100 x 2100 pixels - 3339 km2 in total) is subsetted from all the Landsat image dataset used. Due to having a different spatial resolution than the other image data, the Landsat 1 image is resampled to 30 m to be conformed to the same resolution with LT5 and LC8 imagery.
4.2 Classification
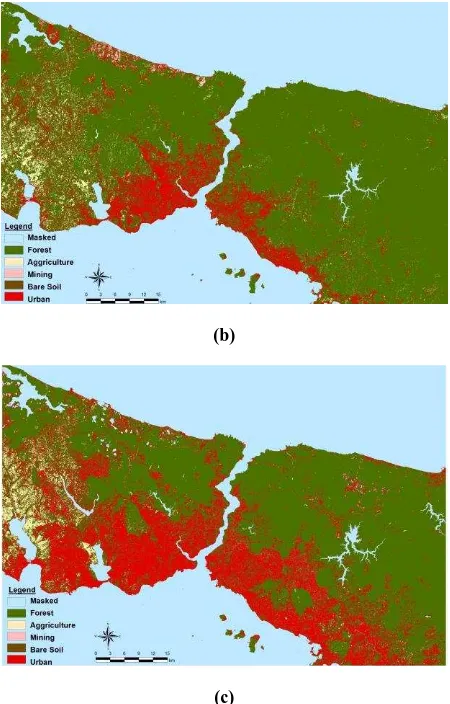
For the multitemporal thematic land use/cover mapping, the Maximum Likelihood classifier, one of the most popular methods of classification in remote sensing, is used in the classification process. As a statistical classifier, a pixel with the maximum likelihood is classified into the corresponding class (Swain and Davis, 1978). The likelihood is defined as the posterior probability of a pixel belonging to that class. For mathematical reasons, a multivariate normal distribution is applied as the probability density function. For more information, Richards and Jia (2006) can be referred. For all dates five general thematic classes were considered; settlements, agricultural areas, forest areas, stone quarries and bare soil. Water bodies in the study area are masked for the computational efficiency.
4.3 Classification Accuracy
The overall classification accuracies were determined from the error matrix by calculating the total percentage of pixels correctly classified. Since this assessment takes only the diagonal of the matrix into account, the Kappa coefficient (Janssen and Vanderwel 1994), which is based on all the elements in the confusion matrix, was also calculated.
The ancillary data such as historical maps, aerial photos, Google Earth images, NDVI images were used in the quantitative analysis for an overview of past development trends and validation of urban class. Overall land use/cover classification accuracy levels for the two dates range from 80% to 90%, with Kappa indexes of agreement ranging from 0.80 to 0.85. Its low radiometric quality and the limited reference maps for 1972 dataset caused having rather much lower classification accuracy.
change in rapidly urbanizing regions; however calibrating such models to real situations is highly problematic (De Almeida et al., 2003). Even so, there is a growing trend to use CA to simulate and predict complex geographical phenomena. In general, CA are implemented through a sequence of processes bounded by transition rules which can be heuristically defined according to the intuitive understanding of the process of geographical phenomena (Li & Liu, 2006).
Components of a CA model are: (i) reference set of cells, usually a raster grid of pixels covering an urban area; (ii) a set of states associated with the cells, which can be in the set {urban, not urban} or more detailed land uses such as {urban, forest, agricultural, wetlands, water}, and such that all cells have a state at any given time; (iii) a set of rules that govern state changes over time; (iv) an update mechanism, in which rules are applied to the state at one time period to yield the states of the same cells in the next time period; and (v) an initial condition of the framework (Clarke, 2008).
4.4.1 CA-Markov Model
Markov Chains have been used to model changes in land use and land cover change at a variety of spatial scales and have several assumptions (Parzen, 1962; Haan, 1977; Stewart, 1994). The key factor for a Markov chain is the transition stochastic process, and different categories are the states of a chain (Weng, 2002). It generates a sequence of random but related events. However, for each area in a real situation, the probability to change in another category, not only is a function of the characteristics of that area, but also of the neighbourhood area. The resulting probabilities were summarized in a transition probability matrix, not directly transferable to spatial representations (Moghadam & Helbich, 2013). Hence, in order to add the spatial character to the model, Markov is integrated into the CA approach. Ultimately, CA component of the CA-Markov model allows the transition probabilities of one pixel to be a function of the neighbouring pixels (Araya & Cabral, 2010).
Another important issue for Markov analysis is defining the multivariate spatial variables. Since Markov model needs defined land use suitability maps for each class, the Multi Criteria Analysis (MCA) was used to build these suitability maps.
4.5 Multi Criteria Analysis (MCA)
MCA analysis is a generic term for all methods that aid decision makers in formally structuring multi-faceted decisions and evaluating the alternatives (Greenel et al., 2011). This structured approach for supporting decision-making, especially when dealing with more than one conflicting criterion (factors), allows relative importance to be placed upon each criterion by the user (Lai et al., 2008). With MCA, the complex problems are dealt by breaking the problems into smaller pieces. After weighting some considerations and making judgments about smaller components, the pieces are reassembled to present an overall picture (i.e. generate transition potential maps (suitability maps)) to the decision making.
Integrating various spatial variables to derive the overall probability of land use developments for each pixel is crucial for the establishment of the multivariate spatial model. In this
study, distance from each pixel to the urban, road, DEM, slope, third bridge route and new airport and land use maps (as excluded layer) were defined as factors. Water resources (the reservoir and distribution channels), green belts and existing urban settlements, military areas were defined as limits. The weighting factor was determined according to the historical land use change data based on expansion pattern and transformations. To predict the spatial pattern of change, the variables were first standardized between the values of 0-255 then weighted by Fuzzy approach based on their influence on urban growth. This approach evaluates the fuzzy set membership function of each pixel. Various fuzzy membership curves, including Sigmoidal (urban distance) and Linear (road distance.), J-shaped (water distance) were chosen for scaling the spatial variables. These functions are controlled by four points, ordered from low to high on the measurement scale;and they have generally to deal with an important trade-off between the accuracy and the interpretability of the model (Farahbod & Eftekhari, 2012). When dealing with the huge volume of data, it is necessary to optimize the MCA models. In this context, Geographic Information Systems (GIS) can provide an appropriate context for data analysis, which is useful tool integration with MCA methods, especially for solving spatial problems in urbanism.
5. RESULTS
Multi-temporal change analysis of urban areas permits the quantification of growth over time. In this study, this analysis is performed by classification of the three Landsat TM dataset separately using a supervised classification technique taking all bands except the thermal band. For the study each field was assigned to 5 land use/cover classes including sides of the Bosphorus. In 1972, the urbanization was lied to close the Bosphorus strait, however, with the construction of the first and second highways crossing the First and the Second Bosphorus bridges, the urbanization has risen to the west direction, parallel these connections.
(b)
(c)
Figure 2: LULC classification maps. (a) 1972. (b) 1986. (c) 2013.
Taking into the earlier experiences into consideration, high importance is given to the new Northern Marmara Highway to be connected with the new Third Bosphorus Bridge and also the other transportation infrastructures, therefore they all were included in the road layer for generating the suitability maps.
The prediction of the 2040 land cover/land use is obtained according to the transition probability matrix based on the historic change trends and land use suitability maps acquired by MCA. In this study, distances from each pixel to each factor were utilized to create the suitability maps necessary to run the model. In order to simulate the complexity of urban system dynamic, the weights in Table 2have been chosen in order to give more importance to the border of the city and its connections.
Table 2: MCA weighting values of spatial variables for urban development.
Land use Weighting values
Urban distance 0.2500
Road distance 0.2000
DEM 0.1000
Slope 0.1000
Land use 0.1500
3.Bridge and airport 0.2000
In the simulation-based modeling, 41-year distance data (1986-2013 2040) were used for the prediction of the urban growth. Prediction maps were derived using different
transition probability matrices. Two transition matrices were constructed from the cross-tabulation of the land use/cover maps (that is, the 1972–1986 and 1986–2013 land use/cover maps). The time intervals used for calibration were 14 and 27 years for the 1972–1986 transition matrix, and the 1986–2013 transition matrix, respectively. Consequently, transition probabilities were normalised to annual time steps as demonstrated by Pastor, et.al. (1993) in order to take account of differences in the lengths of the two time periods.
Dynamic adjustments of transition probabilities and transition potential map thresholds were implemented in the Markov-cellular automata model and weights of the factors for each class were adjusted according to KIA values to improve the modelling for 5 land use classes. Various factors were tested and statistically the most informative factors were considered.
Monte Carlo iteration value was used with year-based increments and a standard 5 by 5 filter was chosen. As a result of filter application a new image was created where each pixel's value is based on its neighbouring pixels.
Prediction accuracy of the model was derived by comparing the predicted and the actual map of urban dynamics on a pixel basis for 2013 by using 1972–1986 transition matrices based on the Kappa statistic. Current urban extent was the key factor for the comparison. The Markov-cellular automata's overall simulation success is 69% for 2013. The Markov Chain approach led to a new urban area of 323 km2
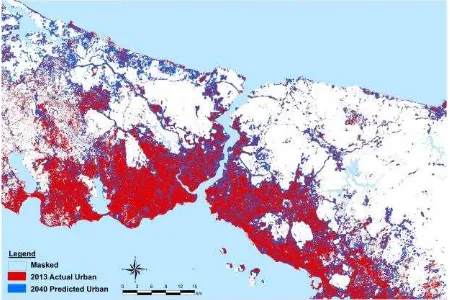
for predicted 2013 (1986-2013) and 558 km2 (2013-2040) for 2040 maps. The observed urban change area for the 1986-2013 map was calculated as 560 km2 (Figure 3). Prediction map for 2040 is given in the Figure 4.
Figure 3: Changes in LULC classes.
The change detection and future prediction results (Figure 3 and 4) showed that there is a growing trend toward urban areas at the expense of forest and as a result, land degradation activities will continue. Approximately 429 km2 of new urban area will be expected to gain mainly from the forest areas around the city center. Second considerable transformation is detected as bare soil to urban with an expected area of 100 km2. Most of the newly urbanized pixels were transitions from outward growth at the urban edge and the empty parcels in the city center (Figure 5).
Figure 5: Urban change for 2013-2040 time period.
For the term future predictions, it is better to use long-term probability matrix in order to recognize and distinguish LUC characteristics and changes especially in an inconstant environment. However, Istanbul is continuously growing city, therefore has highly dynamic, complex and multifunctional urban structure. Since the lack of an appropriate ground truth data for 1972 classification, some of classification mistakes were observed and hence 1986-2013 time period was used for 2040 urban prediction map causing the lower Kappa accuracy and under estimation for 2013 urban prediction.
From the calibration point of view, Markov Chain is considered somewhat subjective due to the preparation of suitability maps using the weighting values which was need to be defined by the user. Once the proper weighting values are managed based on expert knowledge, the detailed information about LULC change is acquired and the model performance can be improved. Also, the rates of the observed change during the calibration are assumed to be stable with the Markov method.
6. CONCLUSIONS
In this study, spatio-temporal urban sprawl analyses was performed in the city of Istanbul, during the time period of 1972–2040, through the evaluation of the change detection analysis using a CA-Markov model approach based on classified multi-temporal Landsat images.
Simulation based models, like CA-Markov based on remote sensing data, is essential to evaluate the changes /developments occurred in the area. The transition probabilities calculated from the 3 Landsat-derived land use/cover maps using the Markov chain analysis showed that the urban expansion will affect (i) all the locations whereby new access routes are created by new road connections, (ii)
the boundaries and buffer zone, especially in both around the forests and the water catchment basins.
The model validation accuracy is found as 69%, which was less than expected. Some causes that affected to the result can be explained by;
the radiometric quality of the Landsat 1972 data,
the lack of in-situ data for Landsat 1972 and 1986 data,
the spatial resolution Landsat images (30m; i.e. mixed classes),
heterogeneous landscape and complex urban structure of Istanbul.
This ongoing research focuses the changes that will be caused by the construction of the new Bosphorus bridge in Istanbul on a general scale, however the environmental and socio-economic factors, which are not considered in the CA modeling, are needed to make a more detailed analysis on LULC change in the urban areas. In the future, the other models such as logistic regression models is planned to test and to compare the results achieved in this study.
REFERENCES
Araya, Y.H., Cabral, P., 2010. Analysis and Modeling of Urban Land Cover Change in Setúbal and Sesimbra, Portugal, Remote Sensing, 2, 1549-1563.
Arsanjani, J.J., Helbich, M., Kainz, W., Darvishi, A., 2013. Integration of Logistic Regression, Markov Chain and Cellular Automata Models to Simulate Urban Expansion - The Case of Tehran, International Journal of Applied Earth Observation and Geoinformation, 21, 265-275.
Bagan, H., Yamagata, Y., 2012. Mapping Fifty Global Cities Growth Using Time-Series Landsat Data, SPIE Asia-Pacific Remote Sensing 2012, Kyoto.
Bhatta, B., Saraswati, S., Bandyopadhyay, D., 2010. Urban Sprawl Measurement from Remote Sensing Data. Applied Geography, 30, 731-740.
Clarke, C.K., 2008. Mapping and Modelling Land Use Change: An Application of the SLEUTH Model, In: C. Pettit, W. Cartwright, I. Bishop, K. Lowell and D. Pullar, Eds., Landscape Analysis and Visualisation, Springer Berlin, Heidelberg, 353-366.
De Almeida, C.M., Batty, M., Monteiro, A.M.V., Camara, G., Soares-Filho, B.S., Cerqueirac, G.C., Pennachin, C.L., 2003. Stochastic Cellular Automata Modeling of Urban Land Use Dynamics: Empirical Development and Estimation, Computers, Environment and Urban Systems, 27, 481–509.
Estoque, R. C., Murayama, Y., 2012. Examining the Potential Impact of Land Use/Cover Changes on the Ecosystem Services of Baguio City, the Philippines: A Scenario-Based Analysis, Applied Geography, 35(1-2), 316-326.
Farahbod, F., Eftekhari, M., 2012. An Evolutionary Approach For Learning Rule Weights In Fuzzy Rule-Based Classification Systems, International Journal of Fuzzy Logic Systems, 2(3), DOI 10.5121/ijfls. 2012.23011.
Haan, C.T., 1977. Statistical Methods in Hydrology, The Iowa University Press, Iowa, U.S.A.
He, J., Liu, Y., Yu, Y., Tang, W., Xiang, W., Liu, D., 2013. A Counterfactual Scenario Simulation Approach for Assessing the Impact of Farmland Preservation Policies on Urban Sprawl and Food Security in a Major Grain-Producing Area of China, Applied Geography, 37, 127-138.
Janssen, L.L.F., Vanderwel, J.M., 1994. Accuracy Assessment of Satellite Derived Land-Cover Data: A Review, Photogrammetric Engineering & Remote Sensing, 60, 419–426.
Koomen, E., Stillwell, J., Bakema, A., Scholten, H.J, 2007. Modelling Land-Use Change, Springer.
Lai, E., S. Lundie, S., Ashbolt, N.J., 2008. Review of Multi-Criteria Decision Aid for Integrated Sustainability Assessment of Urban Water Systems, Urban Water Journal, 5(4), December, 315–327.
Li, X., Liu X., 2006. An Extended Cellular Automaton Using Case-Based Reasoning for Simulating Urban Development in a Large Complex Region, International Journal of Geographical Information Science, 20(10), November, 1109-1136.
Mahiny A.S., Clarke K. C., 2012. Guiding SLEUTH Land-Use/Land-Cover Change Modeling Using Multicriteria Evaluation: Towards Dynamic Sustainable Land-Use Planning, Environment and Planning B: Planning and Design 39(5), 925 – 944.
Moghadam, H.S., Helbich, M., 2013. Spatiotemporal Urbanization Processes in The Megacity of Mumbai, India: A Markov Chains-Cellular Automata Urban Growth Model, Applied Geography, 40(140-149).
Overmars, K. P., Verburg, P. H., 2006. Multilevel Modeling of Land Use from Field to Village Level in the Philippines, Agricultural Systems, 80, 435-456.
Parzen, E., 1962. On Estimation of a Probability Density Function and Mode, 33(3), 1065-1076.
Patino, J. E., & Duque, J. C., 2013. A Review of Regional Science Applications of Satellite Remote Sensing in Urban Settings. Computers, Environment and Urban Systems, 37, 1-17.
Pastor, J., Bonde, J., Johnston, C., Naiman, R.J., 1993. Markovian analysis of the spatially dependent dynamics of beaver ponds. In R. H. Gardner (Ed.), Predicting spatial effects in ecological systems. Lectures on mathematics in the life sciences, 23 (5–27). Providence, RI: American Mathematical Society.
Ramachandra, T.V., Aithal, B.H., 2012. Spatio-Temporal Pattern of Landscape Dynamics in Shimoga, Tier II City, Karnataka State, India, International Journal of Emerging Technology and Advanced Engineering, 2(9), September, 563-576.
Richards, J. A., Jia, X., 2006. Remote Sensing Digital Image Analysis: An Introduction, Springer, 4th Edition.
Schneider, A., Woodcock, C. E., 2008. Compact, Dispersed, Fragmented, Extensive? A Comparison of Urban Growth in Twenty-Five Global Cities Using Remotely Sensed Data, Pattern Metrics and Census Information, Urban Studies, 45, 659-692.
Stewart, W.J., 1994. Introduction to the Numerical Solution of Markov Chains, Princeton University Press, Princeton, NJ.
Swain, P.H., Davis, S.M., 1978. Remote Sensing: The Quantitative Approach. McGraw-Hill, New York.
TUİK, 2013. Turkish Statistical Institute, http://www.turkstat.gov.tr/