FLOOD MAPPING USING INSAR COHERENCE MAP
Slim Selmia, Wajih Ben Abdallaha, Riadh Abdelfattaha,b
aCOSIM Lab, University of Carthage, Higher School Of Communications of Tunis Route de Raoued KM 3.5, Cite El Ghazala Ariana 2083 - Tunisia, email:[email protected]
b
D´epartement ITI, T´el´ecom Bretagne, Institut de T´el´ecom, Technopˆole Brest-Iroise CS 83818 29238 Brest Cedex 3 - France, email:[email protected]
KEY WORDS:Flood detection, SAR Data, InSAR coherence map.
ABSTRACT:
Classic approaches for the detection of flooded areas are based on a static analysis of optical images and/or SAR data during and after the event. In this paper, we aim to extract the flooded zones by using the SAR image coupled with the InSAR coherence. A new formulation of the ratio approach for flood detection is given considering InSAR coherence. Our contribution is to take advantage from the coherence map provided using the InSAR pairs (one before and one after the event) to enhance the detection of flooded areas. We explore the fact that the coherence values during and after the flood are mainly differents on the flooded zones and we give a more suitable flood decision rule using this assumption. The proposed approach is tested and validated in the case of the flood taken place in 2005in the region of Kef in Tunisia.
1. INTRODUCTION
Earth has experienced in recent years, several natural disasters that have an environment impact as well as various aspects of hu-man life (Zhou et al., 2000). One of these remarkable events is floods. In Tunisia, the risk of floods affects about two out of three municipalities (of the Directorate General of Water Resources, 2005). It is therefore necessary to provide objective and com-prehensive information about the area before, during and after this hydrological event(Zhou et al., 2000). To guide support ef-fectively and to provide quantifiable estimates of affected infras-tructure and land extent, remote sensing techniques are used to measure and monitor floods (Andreoli and Yesou, 2007). Indeed, remote sensing data integration allows calculation and rapid as-sessment of water levels, damages and flood risk by area (Zhou et al., 2000), (Andreoli and Yesou, 2007).
In this study, two main methods based on SAR (Synthetic Aper-ture Radar) data, for the extraction of flooded areas are studied and compared. We then propose an optimization of the more accurate one: the ratio approach (Andreoli and Yesou, 2007). The first method is developed by NEST (Next ESA, all rights reserved, n.d.) and it is based on the determination of a mask from the color composite images taken before and during the flood. Andreoli and Yesou developed an approach based on the texture filtering (Andreoli and Yesou, 2007) and the detection of the change through the bands ratio (Andreoli and Yesou, 2007). In order to overcome the problem of decorrelation due to the landslide caused by the flood, we used the InSAR coherence as an additional information for texture filtering. Thus, flood map-ping using ETM+ optical data is considered as a ”ground truth” (Van Leer and Galantowicz, n.d.) for the validation and compari-son of these methods.
2. FLOODS IN NORTHWESTERN OF TUNISIA
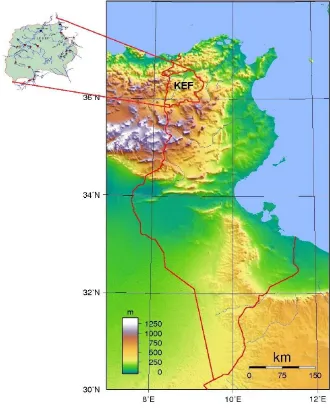
We are interested in the region of Kef in the north-west of Tunisia Fig. 1. This region is knowing for having a semi-arid climate and it becomes inaccessible after floods. This will make very difficult the task of research looking for exploring the test site within field campaign after a flooding.
Figure 1: Location of the study area (36◦10′55′′N,8◦42′52′′E).
According to the Tunisian hydrological calendar, published by the Ministry of Agriculture and Water Resources (of the Direc-torate General of Water Resources, 2005), February is the month of greatest rainfall. Table 1 shows data on precipitation in2005. Floods in Kef is taken place between February14thand15th2005.
Researchers took more then2months (until April) in order to get on the test site. This mainly due to the landslides caused by the flooding.
In order to get a priori estimation of the flood mappping, we pro-pose to explore different approaches based on SAR data. In this paper, flood mapping using optical data will serve as reference for the validation of results given from SAR approaches.
3. FLOOD MAPPING USING OPTICAL DATA
A classic way to detect the flooded areas is based on the analy-sis of the optical images. The main idea is to test different pro-cessing satellite data to extract thematic land such as principal
The International Archives of the Photogrammetry, Remote Sensing and Spatial Information Sciences, Volume XL-7, 2014 ISPRS Technical Commission VII Symposium, 29 September – 2 October 2014, Istanbul, Turkey
This contribution has been peer-reviewed.
Table 1: The amount of rain in 2005 in three rainfall stations in the region of Kef.
Station Jan Feb Mar Apr May Jun Jul
Mellegue 41.0 65.0 34.8 53.0 8.0 23.6 4.8 Zebida 42.0 68.0 22.8 34.0 0.0 14.0 4.0 K. Khasba 42 63.0 27.0 40.0 6.0 77.0 47.0
component analysis, the colored composition, multispectral clas-sification and the band ratio4/3(Roque et al., 2013). Because the Kef test site is mainly composed of soil, vegetation and water (Roque et al., 2013), we opted for the choice of the band ratio 4/3since it maximizes classes separability (of Environment and of Life Branch, 2006).
The use of Landsat ETM+ tool for images processing and analy-sis has identified the most relevant elements of the landscape and draw up land using maps (Fig. 2).
Figure 2: Optical image of river Mellegue taken by Landsat ETM+ satellite on Mai 2005 with band ratios 4/3.
The pixels having values below1.76denote the surfaces of water. Among water regions, some aren’t related to flooding (overflow from the river due to the high flood waters and stagnant rain). By examining the optical images taken over the region of Kef in Tunisia on Marsh and May2005, we can detect the flooded ar-eas. The resulting map shows the areas that are affected during the crisis. This will save for us as a ground truth for validation of the developed approach. During the flood(in February) and im-mediately after the flood, optical data are not exploitable. Then, SAR data in such situation are more adapted for flood mapping.
4. FLOOD MAPPING USING SAR DATA
The radar data set used in this paper is provided by Envisat-2 satellite covering northwest of Tunisia and taken between Febru-ary2005(during the flood) and May2005(after the flood).
4.1 Methodology
The methodology of radar data processing consists of three steps (Andreoli and Yesou, 2007)(Silveira and Heleno, 2009):
• Geo-location of radar images
• Radiometric processing
• Image interpretation and information extraction.
For our study, we used the Lee filter (Lee et al., 1998) to reduce speckle noise and NEST tool (Next ESA, all rights reserved, n.d.) to process image data and metadata. The radar sensors have a high sensitivity to the dielectric constant and the surface rough-ness of observed objects. If we assume that a free water surface has a very low roughness, we can consider it as specular reflector. Thus, water is distinguished with a very low image backscatter (Roque et al., 2013)(Silveira and Heleno, 2008).
4.1.1 Detection of flood using a mask To measure the extent of floods, the permanent water surfaces shouldn’t be considered. Otherwise, we will get erroneous results. This implies that we need to hide some pixels and expose others. Before creating a mask, the RGB image will be used where the red band denotes the crisis image (February), the green band denotes the archive 1 and the blue band is or the archive 2 (Next ESA, all rights re-served, n.d.). From these images, we can see pixels associated with flooded areas colored in purple. Knowing these values, and based on histograms of images taken before and after the floods, thresholds could be defined. Therefore, the permanent water sur-faces could be detected using these thresholds. Using these data, we can notice that the pixel values, in the case of the crisis image (14February), are below thresholds (from250to350) but in the case of the picture archive, the same pixels values are between 400and600. So the flooded areas satisfy the condition ofN
mask (Fig. 3):
Figure 3: Flooded area (in red) around river Mellegue generated with Envisat satellite image on Mars 2005 using NEST method.
N:
It<350
It+1>550 (1)
whereItandIt+1are the Envisat images taken during and after
the flood event repectively.
4.1.2 Detection of flooding using the ratio method The chang-ing detector chosen for this method is based on the improvement of the ratio that includes two levels of analysis (Roque et al., 2013), the macro-scale analysis based on a first ratior1in order
to highlight changes of large homogeneous areas and combined with a second ratior2obtained from two raw images that
high-light key changes, while keeping a thematic accuracy of the raw data (Roque et al., 2013)(Rignot and van Zyl, 1993).
r1=
I1,t+1
I1,t
r2=
I2,t+1
I2,t
(2)
where:
I1,t:Texturally filtered image at a time t.
The International Archives of the Photogrammetry, Remote Sensing and Spatial Information Sciences, Volume XL-7, 2014 ISPRS Technical Commission VII Symposium, 29 September – 2 October 2014, Istanbul, Turkey
This contribution has been peer-reviewed.
I1,t+1:Texturally filtered image at a time t+1.
I2,t:Original image at a time t.
I2,t+1:Original image at a time t+1.
5. PROPOSED APPROACH : FLOOD DETECTION USING RATIO AND CHOERENCE MAP
This approach combined the ratior and consistencyγof radar imagesItandIt+1to determine any changes between areas and
therefore the extraction of flooded zones. In fact, sinceγ mea-sured the similarity degree between these two images, any changes occured during the flood event could be detected if the value of
γis small. In this proposed appraoch, our main contribution is to explore this assumption by using the coherence information be-tweenIt andIt+1to improve the flood detection. In our study,
the sar images are acquired with the Envisat satellite, taken dur-ing and after the flood event.
The coherence image is simply the module of this complex coef-ficientγ(Giordano et al., 2005) .
γ=
This is actually a picture of correlation between the two images
It andIt+1. Indeed, if two pixels are completely decorrelated,
the coefficient|γ|tends to0. In the opposite scenario, coherence approaches1.Nis the number of pixels whose analysis window is equal to3(Liu et al., 2001). We propose to mode the change detection coefficient as given by the following expression:
Cr=
There are three possible cases:
Case 1: If the area undergoes no change thenrandγare close to 1so the values ofCris around1.
Case 2: If the area undergoes negative changes (flooded areas) thenγtends to0andr >>1so the values ofCrshould be
sig-nificant.
Case 3: If the area undergoes positive changes (non flooded ar-eas) thenγtends to0andr <<1so the values ofCr are less
significant.
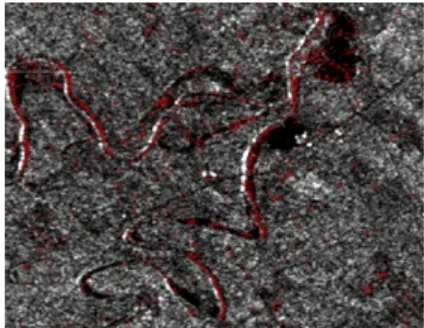
Whites areas, that appears in the changes detection coefficient im-ageCr(Fig. 4), are flooded. Thus, flooded areas satisfy the
con-ditionCr> s1wheres1is a threshold to be determined.
Thresh-old was chosen to minimize MSE (mean square error) between imageCrand optical image, considered as land truth (Fig. 5).
M SE= 1
whereIoprepresents flooded areas mapping extracted from
opti-cal data.
6. EXPERIMENTAL RESULTS AND DISCUSSIONS
Exploited satellite database includes two ETM+ multispectral scenes: Marsh14th,2005in the raw, and May1st,2005during the off
;
Figure 4: Change detection result usingCrin the case of Envisat
images .
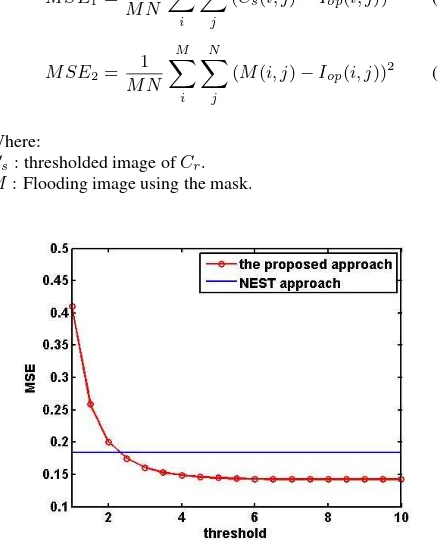
flooding. We have calculated theM SE1 between flooding
im-ages determinate from optical data (Fig. 6-(a)), considered as a reference image, and change detection image. The relationship between the threshold values and the obtained MSEs is shown in Fig. 5. M SE1decrease when the threshold increases.
Start-ing from a particular threshold, we obtainM SE1 = 0.15and
M SE2= 0.18using mask method.
M: Flooding image using the mask.
;
Figure 5: Relationship between the threshold values and the MSE of the NEST and the proposed approaches.
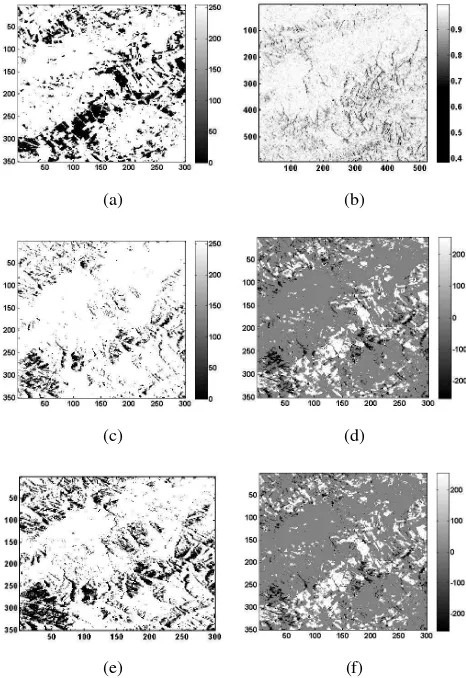
Fig. 6-(a) shows the flooded zones in area 1 of the Kef test site in 2005extracted using ETM+ optical data. Since each pixel of the ETM+ image is30×30meters and the number of flooded pixel is 42104, the surface of the flooded area is calculated as following:
Sop= 42104×30×30 = 37.89km2 (8)
The International Archives of the Photogrammetry, Remote Sensing and Spatial Information Sciences, Volume XL-7, 2014 ISPRS Technical Commission VII Symposium, 29 September – 2 October 2014, Istanbul, Turkey
This contribution has been peer-reviewed.
Thus, flooded zones represent about 14.22% of the total land area. Moreover, the spatial resolution of SAR images is12.5×
12.5meters. The flooding surfacesS1andS2obtained from the
mask method and from the method of change detection area re-spectively are:
S1 = 30.65km 2
,S2= 40.74km
2
(9)
This means that the flooded zone covers11.5%of the total land area for the method of mask and15.28%for the method of change detection.
(a) (b)
(c) (d)
(e) (f)
Figure 6: Flooded areas in black : (a) optical method, (b) coher-ence map, (c) mask method, (d) the differcoher-ence image(a)−(c), (e) the proposed approach and the difference image(a)−(e).
7. CONCLUSION
The results presented in this paper demonstrate the relevance of the combination of satellite imagery (optical and radar) for map-ping flooded areas. Indeed, processing and analysis of a multi-temporal series of optical data, ETM+, and SAR data of the study area, acquired in different seasons, have identified a set of ele-ments that can inform land uses in the area: vegetation units, soil and water. Furthermore, the multitemporal comparison between images was used to measure the surfaces of flooded areas around the river Mellegue and the impact of flooding on other region of the North-west of Tunisia. In this study, the ratio4/3of optical bands allows the classification of land occupation. Furthermore, we have combined the ratio of SAR bands and the coherence in
order to extract flooded areas more precisely.
As future work, we can use the elevation information of the soil, provided from the Digital Elevation Model (DEM) of the area of interest, to prevent the flooded zones with low elevation.
REFERENCES
Andreoli, R. and Yesou, H., 2007. Large scale change detec-tion techniques dedicated to flood monitoring using envisat wide swath mode data. Geoscience and Remote Sensing Symposium, 2007. IGARSS 2007. IEEE International pp. 2382–2385.
Giordano, F., Goccia, M. and Dellepiane, S., 2005. Segmenta-tion of coherence maps for flood damage assessment. In: Image Processing, 2005. ICIP 2005. IEEE International Conference on, Vol. 2, IEEE, pp. II–233.
Lee, J.-S., Papathanassiou, K. P., Ainsworth, T. L., Grunes, M. R. and Reigber, A., 1998. A new technique for noise filtering of sar interferometric phase images. Geoscience and Remote Sensing, IEEE Transactions on 36(5), pp. 1456–1465.
Liu, J. G., Black, A., Lee, H., Hanaizumi, H. and Moore, J. M., 2001. Land surface change detection in a desert area in alge-ria using multi-temporal ers sar coherence images. International Journal of Remote Sensing 22(13), pp. 2463–2477.
Next ESA, all rights reserved, n.d. http://nest.array.ca/.
of Environment, T. D. G. and of Life Branch, Q., 2006. Regional action program for fighting against desertification in the region of KEF. Ministry of Equipment, Land-Use Planning and Sustainable Development.
of the Directorate General of Water Resources, P., 2005. Annu-aire hydrologique de tunisie 2004-2005.
Rignot, E. J. and van Zyl, J. J., 1993. Change detection tech-niques for ers-1 sar data. Geoscience and Remote Sensing, IEEE Transactions on 31(4), pp. 896–906.
Roque, D., Afonso, N., Fonseca, A. and Heleno, S., 2013. Build-ing a database of flood extension maps usBuild-ing satellite imagery. Proccedings of the ESA Living Planet Symposium, Edinburgh September 9.
Silveira, M. and Heleno, S., 2008. Water/land segmentation in sar images using level sets. In: Image Processing, 2008. ICIP 2008. 15th IEEE International Conference on, IEEE, pp. 1896–1899.
Silveira, M. and Heleno, S., 2009. Classification of water regions in sar images using level sets and non-parametric density estima-tion. In: Image Processing (ICIP), 2009 16th IEEE International Conference on, IEEE, pp. 1685–1688.
Van Leer, K. W. and Galantowicz, J., n.d. Comparisons of flood affected area derived from modis and landsat imagery. pp. 1–8.
Zhou, G., Luo, J., Yang, C., Li, B. and Wang, S., 2000. Flood monitoring using multi-temporal avhrr and radarsat im-agery. Photogrammetric Engineering and Remote Sensing 66(5), pp. 633–638.
The International Archives of the Photogrammetry, Remote Sensing and Spatial Information Sciences, Volume XL-7, 2014 ISPRS Technical Commission VII Symposium, 29 September – 2 October 2014, Istanbul, Turkey
This contribution has been peer-reviewed.