NOISE FILTERING OF REMOTELY SENSED IMAGES USING ITERATIVE
THRESHOLDING OF WAVELET AND CURVELET TRANSFORMS
Rizwan Ahmed Ansari, B. Krishna Mohan
Centre of Studies in Resources Engineering, Indian Institute of Technology Bombay, Mumbai, India [email protected], [email protected]
KEY WORDS: Multi-resolution analysis, wavelet transform, curvelet transform, additive noise, noise filtering, fixed thresholding, iterative thresholding.
ABSTRACT:
This article presents techniques for noise filtering of remotely sensed images based on resolution Analysis (MRA). Multi-resolution techniques provide a coarse-to-fine and scale-invariant decomposition of images for image interpretation. The multi-resolution image analysis methods have the ability to analyze the image in an adaptive manner, capturing local information as well as global information. Further, noise being one of the biggest problems in image analysis and interpretation for further processing, is effectively handled by multi-resolution methods. The paper aims at the analysis of noise filtering of image using wavelets and curvelets on high resolution multispectral images acquired by the Quickbird and medium resolution Landsat Thematic Mapper satellite systems. To improve the performance of noise filtering an iterative thresholding scheme for wavelets and curvelets is proposed for restoring the image from its noisy version. Two comparative measures are used for evaluation of the performance of the methods for denoising. One of them is the signal to noise ratio and the second is the ability of the noise filtering scheme to preserve the sharpness of the edges. By both of these comparative measures, the curvelet with iterative threshold has proved to be better than the others. Results are illustrated using Quickbird and Landsat images for fixed and iterative thresholding.
1. INTRODUCTION
In recent past, advancements in observing the Earth from space have led to a new class of images with very high spatial resolution. These high resolution images contain detailed information about the properties of various objects. For different purposes, remote sensing images are used to extract some features, detect the presence of various phenomena, and for interpretation. These applications require high signal-to-noise ratio (SNR) to get correct results and better performance. The data that are contaminated with noise can degrade the interpretation and hamper extraction of useful information.
A large number of noise filtering algorithms are present in the literature. There are a number of benchmark non-linear filters like median filters, Wiener filters, Min/Max filters; adaptive filters like Lee filters (Lee, 1981), Frost filters (Frost et al., 1980) and sigma filters, along with linear filters like low-pass and high-pass filters. While many techniques are present for denoising, wavelet denoising is the technique used due to its added advantage of localization in frequency as well as spatial domain and multi-scale, multi-resolution analysis (Chen and Bui, 2003; Chen and Kegl, 2007; Dabov et al. 2007). Amongst the numerous wavelets available to use, the most commonly used are the family of Daubechies wavelets (Daubechies, 1992), the bi-orthogonal wavelets.
Wavelet transform showed great effect when dealing with one and two-dimensional signals with point singularity features. However, for the two-dimensional image, the main characteristics were characterized by the edges. Wavelets can only capture limited directional information due to its poor orientation selectivity (Cand`es and Donoho, 2000). By decomposing the image into a series of high-pass and low-pass filter bands, the wavelet transform extracts directional details that capture horizontal, vertical, and diagonal details. However,
these three linear directions are limiting and might not capture enough directional information in remotely sensed images. Wavelet transform coefficients are not the best and the most sparse to describe the image edge singular features. In order to avoid this shortcoming of wavelet transform and process images of high dimension more effectively, Cand`es and Donoho (2000) introduced curvelet transform, combining the directional filtering and multi-scale ridgelet transform (Cand`es and Donoho, 1999), which makes curvelets useful for noise filtering of images. Its anisotropic characteristic is advantageous to the edge expression, especially to the curve singularities of two dimensional signals.
In this paper, first some basic ideas of wavelet, ridgelet and curvelet transforms are discussed. Next, a model noise filtering problem is considered for remotely sensed imagery with Gaussian noise, and existing methods of thresholding followed by proposed method of iterative thresholds for denoising are described. Finally the results with various performance measures are discussed with interpretations and direction of future work is presented.
2. MULTIRESOLUTION ANALYSIS TECHNIQUES
2.1 Wavelet Transforms
The application of multi-resolution analysis (MRA) for image analysis and interpretation has become very popular in recent past. A multi-resolution technique can provide a coarse-to-fine and scale-invariant decomposition for image interpretation. Therefore it is effective to analyze an image starting from the global view of the coarse resolution and then gradually increasing the resolution to a more local view.
According to algorithm in (Mallat, 1989), the input image is convolved with low-pass and high-pass filters associated with a mother wavelet and down-sampled. Four images (each one with half the size of the original image) are obtained, corresponding to high frequencies in the horizontal direction and low frequencies in the vertical direction (HL), low frequencies in the horizontal direction and high frequencies in the vertical direction (LH), high frequencies in both directions (HH) and low frequencies in both directions (LL). The last image (LL) is a low-pass version of the original image, and is called as the singularities. Wavelets can only capture limited directional information due to its poor orientation selectivity. By decomposing the image into a series of high-pass and low-pass filter bands, the wavelet transform extracts directional details that capture horizontal, vertical, and diagonal details. However, these three linear directions are limiting and might not capture enough directional information in remotely sensed images.
Wavelets do not isolate the smoothness along the edges, and thus more suitable for reconstruction of sharp point singularities than lines or edges. These shortcomings are addressed by ridgelet transform introduced in (Cand`es and Donoho, 1999), where a line singularity is mapped into a point singularity using Radon transform. Then, the wavelet transform is used to handle the point singularity. The result is an efficient representation for 2-D functions with piecewise smooth regions separated by a line singularity. Ridgelet analysis may be considered as wavelet analysis in the Radon domain because Radon transform translates singularities along lines into point singularities, for which the wavelet transform is known to provide a sparse representation (Fadili and Starck, 2007)
The algorithm of the Discrete Ridgelet Transform (DRT) is depicted in Fig. 2. The DRT of an image of size n × n is an image of size 2n × 2n, introducing a redundancy factor equal to 4 (Welland, 2003).
2.3 Curvelet Transforms
The ridgelet transform is optimal at representing straight-line singularities. This transform with arbitrary directional selectivity provides a key to the analysis of higher dimensional singularities. But, the ridgelet transform is only applicable to objects with global straight-line singularities, which are rarely observed in remotely sensed images (Woodcock and Strahler 1987). In order to analyze local line or curve singularities, a natural idea is to consider a partition for the image, and then to apply the ridgelet transform to the obtained sub-images. This block ridgelet based transform, which is named curvelet transform, was first proposed in (Cand`es and Donoho, 2000). Curvelet basis functions can be viewed as a local grouping of wavelet basis functions into linear structures so that they can capture the smooth discontinuity curve more efficiently as illustrated in Fig. 3.
Fig. 3: Non-linear approximation of a 2-D piecewise smooth signals (Do and Vetterli 2002)
Curvelets partition the frequency plane into dyadic coronae and (unlike wavelets) sub-partition those into angular wedges which again display the parabolic aspect ratio. Hence, the curvelet transform refines the scale-space viewpoint by adding an extra factor, orientation, and operates by measuring information about an object at specified scales and locations but only along specified orientations.
Fig. 2: Discrete ridgelet transform (Cand`es and Donoho, 1999)
Fig. 1: Structure of 3 level wavelet decomposition
The curvelet transform has gone through two major revisions (Donoho and Duncan, 2000). The first version (Cand´es and Donoho, 2000) used a complex series of steps involving the ridgelet analysis of the radon transform of an image. Their performance was very slow; therefore, an improved version was developed known as Fast Discrete Curvelet Transform (FDCT) (Cand`es et al., 2006). In this new method, the use of the ridgelet transform as a preprocessing step of curvelet was discarded, thus reducing the amount of redundancy in the transform and increasing the speed considerably.
According to Cand`es et al. (2006), two implementations of orientation parameter, and a spatial location parameter. For numerical computations we need to discretize the continuous curvelet transform, since we usually work with discrete data sets in applications. As shown by Cand`es and Donoho (2003), a discrete version of the continuous curvelet transform can be derived by a suitable sampling at the range of scales, orientations and locations. In this paper, an implementation of this algorithm with wrapping function is used.
2.3.1 Fast Discrete Curvelet Transform via Wrapping
The new implementation of curvelet transform based on Wrapping of Fourier samples takes a 2D image as an input in
the form of a Cartesian array f [m, n], where 0 ≤ m<M,0 ≤ n<N
where M and N are the dimensions of the array. The following are the steps of applying wrapping based FDCT algorithm
4) Apply IFFT to the processed curvelet coefficients
Fig. 4: Construction of Fast Discrete Curvelet Transform (Cand`es et al., 2006)
Discrete curvelet transform in the spectral domain utilizes the advantages of FFT. During FFT, both image and curvelet at a contains curvelet coefficients in ascending order of the scales and orientations.
3. NOISE FILTERING
Noise represents the unwanted information which deteriorates the quality of the image. A remotely sensed optical image is mainly corrupted by noise which is modelled as additive Gaussian noise. Multiscale transform based noise filtering is achieved by hard-thresholding of the transform coefficients.
3.1 Hard thresholding
The denoising method with hard thresholding is as follows (Starck, Candès, and Donoho 2002);
Estimate the noise standard deviation σ in the input
image.
Calculate the wavelet and curvelet transforms of the input image. Get a set of bands wj, each band contains Nj coefficients and corresponds to a given resolution level.
Calculate the noise standard deviation σj for each band j
of the transformed coefficients.
For each band j: Calculate the maximum of the band and multiply each coefficient.
Reconstruct the image from the modified coefficients.
As described in (Starck, Cand`es and Donoho 2002), threshold at 3σjl for all levels and 4σjl at finest scale is selected. σjl is the noise level of a coefficient at scale j and angle l (equal to the noise level times the L2 norm of the corresponding transform).
3.2 Proposed method of iterative threshold
The fixed thresholding (3σ or 4σ) method does not give the
maximum Signal to Noise Ratio (SNR) while donoising, to obtain the optimum results in terms of SNR and Mean Squared Error (MSE), an iterative thresholding method is proposed.
The problem is to decide the threshold value to be chosen for noise removal at each scale. Each coefficient of the transformed image is considered as a threshold value and the final SNR of the reconstructed image is calculated by performing hard thresholding on noisy image in the transform domain followed by respective reconstruction.
On comparing of the SNR values obtained, the threshold value giving the highest SNR is chosen. Therefore at a given resolution (scale) of the transformed image, a unique set of threshold values is created from which the optimum threshold is selected.
The selection of coefficient value as threshold is done at each resolution in different high frequency sub-bands so that for SNR calculations, coefficients in the particular detailed sub-band only are considered instead of all the coefficients in all the sub-bands at a given resolution.
2 D data Freq. data
Therefore for a given sub-band of the wavelet or curvelet transformed image, a unique set of threshold values is created from which the optimum threshold is selected. Since lesser are the number of elements in the unique set, the lesser number of computations are required to successfully denoise the image. Thus, the unique set is formed of only the existing coefficient values present in the specific band of the wavelet or curvelet transformed image. Then hard thresholding is done as
( , )
( , ) ; if ( , )
= 0 ; otherwise
h i j
h i j
h i j
Threshold
(1)
Inverse wavelets, curvelets transforms are then taken. This algorithm is repeated for different wavelet families of Daubechies and Bi-orthogonal filters. For selected remotely sensed data, bi-orthogonal filters of wavelets are used in this paper. This algorithm is repeated for high and medium resolution images with different levels of noise.
In this approach computational load increases as the algorithm runs more number of times (in contrast to fixed thresholding) to obtain the thresholds, however it gives the optimum SNR.
4. RESULTS AND ANALYSIS
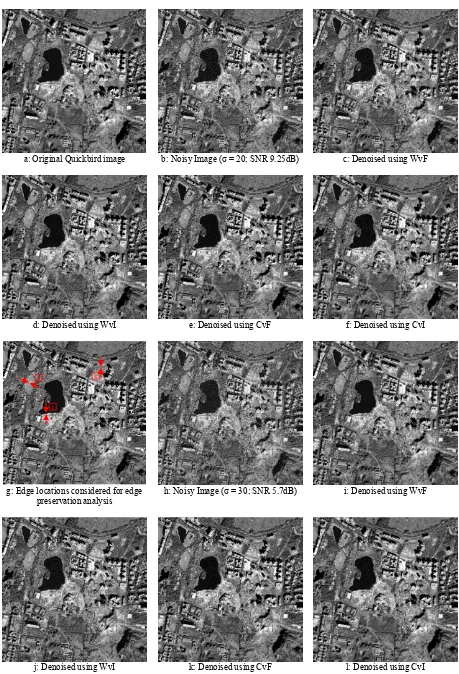
To evaluate the performance of these algorithms for noise filtering, sample high resolution Quickbird image (1024x1024) of Powai area of Mumbai city and Landsat Thematic Mapper (TM) image (512x512) of Mumbai city are used. To create the effect of noise of varying amounts, zero mean white Gaussian noise with various standard deviations (σ = 10, 15, 20, 25 and 30) was added to the input images, and input to the denoising filters are developed and then denoised by fixed threshold and optimal threshold by iterative method using wavelet and curvelet transforms. In addition to visual observations, objective measures like Signal to Noise Ratio (SNR), Peak SNR (PSNR) and Mean Squared Error (MSE) are used to evaluate the preservation capability (Figures 5 and 6).
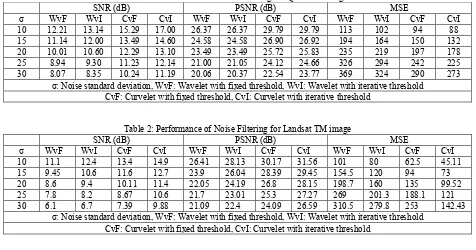
It is observed that for Quickbird image, with σ = 10, curvelet with iterative threshold (CvI) gives SNR of 17dB (3.86 dB higher than wavelet with iterative threshold (WvI), and 1.71 dB higher than curvelet with fixed threshold (CvF)) and MSE of 88 (14 less than wavelet) (Table 1). For Landsat TM image also, curvelet performs better than wavelet with improvement in SNR, PSNR and MSE (Table 2).
It is expected that as denoising is performed, edges get blurred, so the denoising mechanism should be such that while removing the high frequency content related to noise, the actual edge information should be retained, so it is expected that mean difference across the edge should remain the same before and after denoising. Also, to have intra-class variance minimum and interclass variance maximum, mean to standard deviation ratio should be improved after denoising, or in worst case it should remain same as before denoising. This analysis is done for both the images with two different levels of noise.
From the original image, three edges are chosen to measure the edge preservation while noise filtering. For this purpose one very strong edge (edge 1 in Quickbird image (Fig. 5g)), one line edge (edge 2 in Fig. 5g) and a weak edge (edge 3 in Fig. 5g) are considered as testing points for edge preservation. Mean and standard deviation across edges are considered as objective measures of performance for edge preserving capacity while denoising.
Table 1: Performance of Noise Filtering for Quickbird image
SNR (dB) PSNR (dB) MSE
σ: Noise standard deviation, WvF: Wavelet with fixed threshold, WvI: Wavelet with iterative threshold
CvF: Curvelet with fixed threshold, CvI: Curvelet with iterative threshold
Table 2: Performance of Noise Filtering for Landsat TM image
SNR (dB) PSNR (dB) MSE
σ: Noise standard deviation, WvF: Wavelet with fixed threshold, WvI: Wavelet with iterative threshold
CvF: Curvelet with fixed threshold, CvI: Curvelet with iterative threshold
a: Original Quickbird image b: Noisy Image (σ = 20; SNR 9.25dB) c: Denoised using WvF
d: Denoised using WvI e: Denoised using CvF f: Denoised using CvI
g: Edge locations considered for edge preservation analysis
h: Noisy Image (σ = 30; SNR 5.7dB) i: Denoised using WvF
j: Denoised using WvI k: Denoised using CvF l: Denoised using CvI Fig. 5: Denoising of Quickbird image of Powai area in Mumbai
1
2 3
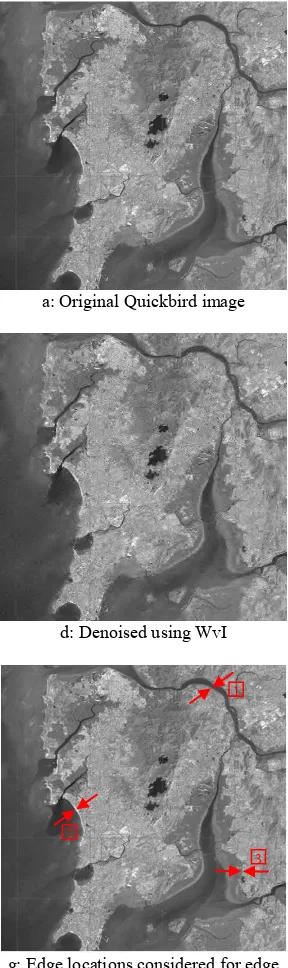
a: Original Quickbird image b:Noisy Image (σ = 15; SNR 7.9dB) c: Denoised using WvF
d: Denoised using WvI e: Denoised using CvF f: Denoised using CvI
g: Edge locations considered for edge preservation analysis
h: Noisy Image (σ = 25; SNR 3.5dB) i: Denoised using WvF
j: Denoised using WvI k: Denoised using CvF l: Denoised using CvI
Fig. 6: Denoising of Landsat TM image of Mumbai 1
2
3
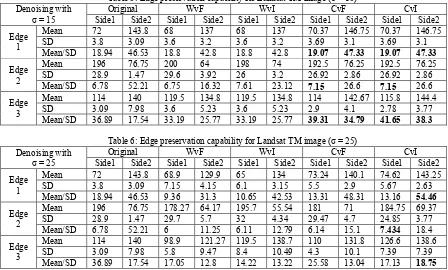
Table 3: Edge preservation capability for Quickbird image (σ = 10)
Table 4: Edge preservation capability for Quickbird image (σ = 30) Denoising with
Table 5: Edge preservation capability for Landsat TM image (σ = 15)
Denoising with
Table 6: Edge preservation capability for Landsat TM image (σ = 25) Denoising with curvelet based denoising, standard deviation across the edge is reduced and mean difference remained almost same as expected, which in turn has improved the mean to standard deviation ratio in both the sides of the edge. Similar improvement on both the sides of edges 2 and 3 is observed. For edge 1, wavelet also gives better result (as compared to
original) but curvelet outperforms the wavelets by giving more mean to standard deviation ratio.
When noise level is increased to σ = 30, from Table 4, for edges 1 and 2, it is observed that curvelet gives higher mean to standard deviation ratio than original whereas wavelet degrades the edges. For side 1 of edge 3, again curvelet performs better
than wavelet. For side 2, though as compare to original (with 35.61) mean to standard deviation ratio reduces slightly, curvelet with 29.96 is better than wavelet which gives the ratio of 29.5.
For Landsat TM image with σ = 15, it is observed from Table 5,
curvelet gives better results as compare to wavelets for edges 1 & 3, and for side 1 of edge 2. But when the noise is increased to
σ = 25, it is observed that curvelet gives better results on only
side of all the edges. Though on the other side of edges, mean to standard deviation ratio is less as compared to original but more than that of obtained by wavelets, therefore curvelet with proposed thresholding performs better in this case as well.
5. CONCLUSIONS
From experimental results, it is found that the curvelet transform outperforms the wavelet transform in terms of SNR, PSNR, MSE and the curvelet denoised images appear visually sharper than the wavelet denoised images. The curvelet transform with proposed iterative thersholding provides high SNR and PSNR values and can filter out Gaussian white noise from remotely sensed images more efficiently than the fixed thresholding method.
For high resolution image of Quickbird, curvelet gives promising results in terms of edge preservation even when noise level is increased. For medium resolution Landsat TM image, curvelets preserve more edge information at low noise levels but when noise level is increased edge quality degrades. The proposed iterative thresholding (in both wavelets and curvelets) significantly improves the SNR and PSNR in comparison with fixed thresholding method but marginally improves edge preservation capability. Therefore, curvelets with iterative thresholding brings two fold advantages both in terms of higher SNR and better edge preservation
From the experimental results it is observed that the denoising by the curvelet with proposed scheme is more effective than wavelets, and it is more applicable to high resolution images as low and medium resolution images are less prone to sensor noise. As future work, these methods can be combined with adaptive scales of MRA and variance stabilization of thresholds to further improve the performance of noise filtering.
REFERENCES
Cand`es E. J. and D. L. Donoho, 1999. Ridgelets: a key to higher dimensional intermittency? Philosophical Transactions of the Royal Society, 357(1760), pp. 2495–2509.
Cand`es E. J. and D. Donoho, 2000. Curvelets, multi-resolution representation, and scaling laws, Proc. SPIE, 4119(1).
Cand`es E. J. and D. Donoho, 2003. Continuous curvelet transform: II. Discretization and frames, Appl. Comput. Harmon. Anal., vol. 19, pp. 198-222.
Cand`es E. J., L. Demanet, D. Donoho, and L. Ying, 2006. Fast discrete curvelet transform. SIAM: Multi-scale Modelling and Simulation, 5(3), 861–899.
Chen G. Y. and Bui T.D., 2003. Multiwavelet Denoising using Neighbouring Coefficients, IEEE Signal Processing Letters, Vol. 10, no. 7, 211–214.
Chen G. Y. and B. Kegl, 2007. Image Denoising with Complex Ridgelets, Pattern Recognition, Vol. 40, No. 2, pp. 578-585.
Dabov K., A. Foi, V. Katkovnik, and K. Egiazarian, 2007. Image denoising by sparse 3D transform-domain collaborative filtering,IEEE Transactions on Image Procesing, vol. 16, no. 8, pp. 2080-2095.
Daubechies I., 1992. Ten lectures on wavelets, Philadelphia, PA: SIAM.
Do M. and M. Vetterli, 2002. Contourlets: a directional multi-resolution image representation. International Conference on Image Processing. 1, pp. 1–357.
Donoho D. and M. Duncan M., 2000. Digital curvelet transform: strategy, implementation, and experiments, AeroSense 2000, pp. 12–30.
Fadili M, J. Starck et al., 2007. Curvelets and Ridgelets. Encyclopedia of Complexity and Systems Science, 3, pp. 1718– 1738.
Frost V. S., J. A. Stiles, K. S. Shanmugan, and J. C. Holtzman, 1980. A model for radar images and its application to adaptive digital filtering of multiplicative noise, IEEE Trans. Pattern Anal. Machine Intell., vol. PAMI-4.
Lee, 1981. Refined filtering of image noise using local
statistics,” Comput. Graph. Image Process., vol. 15(4).
Mallat S., 1989. A theory for multi-resolution signal decomposition: The wavelet representation, IEEE Trans. Pattern Anal. Machine Intell., vol. 11, pp. 674–693.
Starck J., E. Candès, and D. Donoho, 2002. The curvelet transform for image denoising, IEEE Transactions on Image Processing, vol. 11, no. 6, pp. 670–684.
Welland G., 2003. Beyond wavelets. Academic Press, vol. 10. Woodcock C.E., and A.H. Strahler, 1987. The factor of scale in remote sensing. Remote Sensing of Environment, vol. 21, no. 3, pp. 311–332.