Comparing intensive, extensified and organic grassland farming in
southern Germany by process life cycle assessment
Guido Haas
∗, Frank Wetterich, Ulrich Köpke
Institute of Organic Agriculture, University of Bonn, Katzenburgweg 3, D-53115 Bonn, Germany
Received 8 October 1999; received in revised form 11 February 2000; accepted 24 March 2000
Abstract
To reduce the environmental burden of agriculture, suitable methods to comprehend and assess the impact on natural resources are needed. One of the methods considered is the life cycle assessment (LCA) method, which was used to assess the environmental impacts of 18 grassland farms in three different farming intensities — intensive, extensified, and organic — in the Allgäu region in southern Germany. Extensified and organic compared with intensive farms could reduce negative effects in the abiotic impact categories of energy use, global warming potential (GWP) and ground water mainly by renouncing mineral nitrogen fertilizer. Energy consumption of intensive farms was 19.1 GJ ha−1and 2.7 GJ t−1milk, of extensified and
organic farms 8.7 and 5.9 GJ ha−1along with 1.3 and 1.2 GJ t−1milk, respectively. Global warming potential was 9.4, 7.0
and 6.3 CO2-equivalents ha−1and 1.3, 1.0 and 1.3 CO2-equivalents t−1milk for the intensive, extensified and organic farms,
respectively. Acidification calculated in SO2-equivalents was high, but the extensified (119 kg SO2ha−1) and the organic
farms (107 kg SO2ha−1) emit a lower amount compared with the intensive farms (136 kg SO2ha−1). Eutrophication potential
computed in PO4-equivalents was higher for intensive (54.2 kg PO4ha−1) compared with extensified (31.2 kg PO4ha−1) and
organic farms (13.5 kg PO4ha−1). Farmgate balances for N (80.1, 31.4 and 31.1 kg ha−1) and P (5.3, 4.5 and−2.3 kg ha−1)
for intensive, extensified and organic farms, respectively, indicate the different impacts on ground and surface water quality. Analysing the impact categories biodiversity, landscape image and animal husbandry, organic farms had clear advantages in the indicators number of grassland species, grazing cattle, layout of farmstead and herd management, but indices in these categories showed a wide range and are partly independent of the farming system. © 2001 Elsevier Science B.V. All rights reserved.
Keywords: Life cycle assessment; Agriculture; Intensive; Extensive; Organic; Grassland; Dairy farming
1. Introduction
Because intensification of agricultural production processes has led to environmental burdens, discus-sions about sustainable farming are taking place. Agriculture today must be environmentally and eco-logically sound and aligned with public values, e.g. positive landscape image and appropriate animal
wel-∗Corresponding author. Tel.:+49-228-73-76-02;
fax:+49-228-73-56-17.
E-mail address: [email protected] (G. Haas).
fare. Converting conventional or intensive agriculture to organic and extensive farming addresses these concerns.
Efficient methods combining suitable indicators are needed to comprehend and assess agricultural impacts on the environment. Life cycle assessment (LCA) is a method to compile a complete inventory, to evalu-ate and to assess all relevant environmental impacts. Initially developed for assessing the environmental impact of industrial plants and production processes, LCAs in agriculture have been mainly carried out for single crops or production processes (Ceuterick, 1996,
1998; Wegener Sleeswijk et al., 1996; Audsley et al., 1997).
The central objective of this study was to use and adapt the LCA method for assessing all rele-vant environmental impacts on the whole farm level to compare different farming production systems. A process-LCA of 18 grassland farms in three different farming intensities — intensive, organic and exten-sified (farmed intensively before, but compared to international farming practice are still producing on a high intensity level) — was carried out in 1998 (Wetterich and Haas, 1999).
2. Materials and methods
2.1. Farming in the region
The investigation took place near the city of Kempten, in the Allgäu region, which is located south-west of the German state Bavaria. The area is part of a subalpine hilly region. It is a well-known region for recreation and vacations offering many possibilities for outdoor activities (e.g. hiking, swimming in lakes and skiing). Good climate (annual mean temperature is 6.9◦C and precipitation is 1274 mm) and soil
con-ditions (FAO: Eutric Cambisols and Humic Fluvisols, both partly Gleyic but usually drained) promote an intensive use of the permanent grassland. Small dairy farms with an average size of 20 ha, 23 dairy cows and an average annual milk performance of 6060 kg
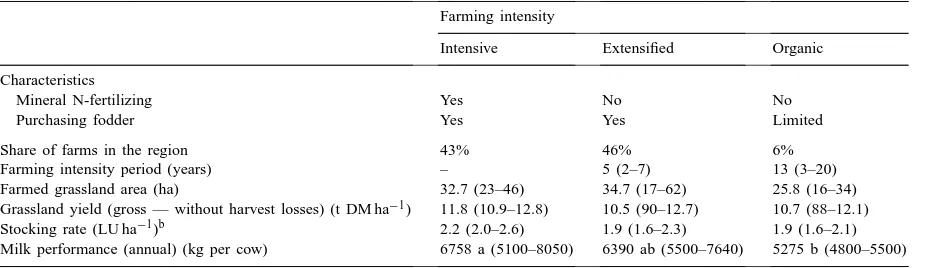
Table 1
Data for analyzed dairy farms of life cycle assessment in the Allgäu regiona
Farming intensity
Intensive Extensified Organic
Characteristics
Mineral N-fertilizing Yes No No
Purchasing fodder Yes Yes Limited
Share of farms in the region 43% 46% 6%
Farming intensity period (years) – 5 (2–7) 13 (3–20)
Farmed grassland area (ha) 32.7 (23–46) 34.7 (17–62) 25.8 (16–34)
Grassland yield (gross — without harvest losses) (t DM ha−1) 11.8 (10.9–12.8) 10.5 (90–12.7) 10.7 (88–12.1)
Stocking rate (LU ha−1)b 2.2 (2.0–2.6) 1.9 (1.6–2.3) 1.9 (1.6–2.1)
Milk performance (annual) (kg per cow) 6758 a (5100–8050) 6390 ab (5500–7640) 5275 b (4800–5500)
aMean of farming system, range in brackets. Values followed by letters indicate mean significant difference (MSD) of 1148.5 kg per
cow; other parameters are not significant.
bLU: livestock-unit (each 500 kg liveweight).
per cow are predominant. Grassland is cut for indoor feeding, ensiling, grass drying or hay and grazed five times a year.
After a pre-selection of 35 farms with local advi-sors, six representative farms for each of the three farming intensities (Table 1) according to the regional agri-environmental program of Bavaria were selected and analyzed in detail by practical investigation on the farms and a farmer questionnaire, as well as by consultations together with advisors and local experts (e.g. water authorities).
The questionnaire covered all basic agricultural production data about farm structure, main produc-tion processes in detail, performance, yield, quality, input and output massflow (e.g. fodder, straw, fertil-izer, cattle, milk, diesel). Questions were answered by the farmers by interviewing them during an intensive farm visit of about 4 h, on which main farm buildings (particularly assessment of housing system and condi-tion), layout of farmstead, equipment, machinery, and infrastructure in general were examined. In following visits starting at the beginning of May, 50–60% of the main and characteristic grassland areas of each farm were investigated for biodiversity and landscape image before first cut.
2.2. Methodology of life cycle assessment
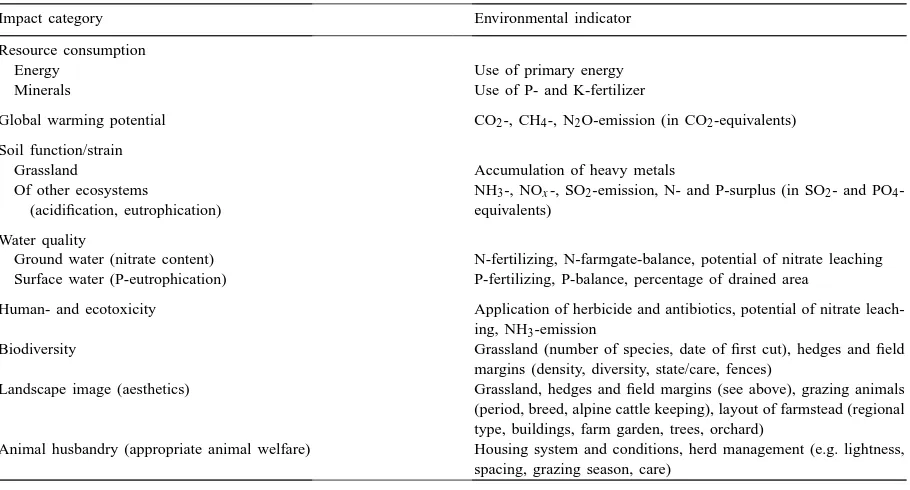
Table 2
Impact categories and indicators of life cycle assessment in the Allgäu region
Impact category Environmental indicator
Resource consumption
Energy Use of primary energy
Minerals Use of P- and K-fertilizer
Global warming potential CO2-, CH4-, N2O-emission (in CO2-equivalents)
Soil function/strain
Grassland Accumulation of heavy metals
Of other ecosystems
(acidification, eutrophication)
NH3-, NOx-, SO2-emission, N- and P-surplus (in SO2- and PO4
-equivalents)
Water quality
Ground water (nitrate content) N-fertilizing, N-farmgate-balance, potential of nitrate leaching Surface water (P-eutrophication) P-fertilizing, P-balance, percentage of drained area
Human- and ecotoxicity Application of herbicide and antibiotics, potential of nitrate leach-ing, NH3-emission
Biodiversity Grassland (number of species, date of first cut), hedges and field margins (density, diversity, state/care, fences)
Landscape image (aesthetics) Grassland, hedges and field margins (see above), grazing animals (period, breed, alpine cattle keeping), layout of farmstead (regional type, buildings, farm garden, trees, orchard)
Animal husbandry (appropriate animal welfare) Housing system and conditions, herd management (e.g. lightness, spacing, grazing season, care)
Geier, 2000; Haas et al., 2000). According to specific agri-environmental indicators (OECD, 1997; Rudloff et al., 1999) the impact on biodiversity, landscape im-age and animal welfare, topics that have high public awareness and are governed by the agri-environmental policies of the European Union have to be taken into account. Additionally site-specific and regional as-pects (e.g. typical regional layout of the farmstead) were included in the framework (Table 2).
The amount of fossil energy used in direct (e.g. diesel, according to agricultural planning data; KTBL, 1994, 1997) and indirect (e.g. fertilizers) forms was calculated based on the consumption of primary energy factors for Germany (Patyk and Reinhardt, 1997). Energy need for grass drying (per t DM) amounts to 100 kWh electricity and 3200 kWh of natural gas. Purchased fodder was calculated with 678.5 MJ t−1fresh matter (average of the 18 analyzed
farms) and purchased concentrates 2500 MJ t−1. The
assumptions of emitted climate relevant trace gases were based on the data from Crutzen et al. (1986); Boumann et al. (1991); Kirchgessner et al. (1991); Gibbs and Woodbury (1993); Heyer (1994); Patyk and Reinhardt (1997); Rück et al. (1997) and Mosier and Kroeze (1998). The global warming potential (GWP)
was computed according to the CO2-equivalent
fac-tors by IPCC (1996) for CO2: 1, CH4: 21 and N2O:
310, period of time 100 years. The emission of am-monia was assumed as 28% nitrogen of the stored and applied farmyard manure (BLBP, 1997a, p. 12). To calculate the acidification potential of the differ-ent trace gases the SO2-equivalent factors for SO2:
1, NOx: 0.7 and NH3: 1.89 derived from Reinhardt
(1997) and for calculating the eutrophication poten-tial the PO4-equivalent factors for NOx: 0.13, N: 0.42
and P 3.06 derived from Heijungs et al. (1992, p. 87) were used.
The components of the farmgate balance for N and P were the input by mineral fertilizers, the purchase of fodder, straw and animals and the output of the sold milk, animals, silage and hay. N2-fixation was
included in the farmgate N balance and assumed to be 30 kg N t−1(DM) of white clover Trifolium repens
L. after Weissbach (1997). The total yield portion of white clover was assessed while investigating the number of species in the grassland areas. The poten-tial nitrate leaching balance per ha was approximated by adding atmospheric deposition of 20 kg N ha−1
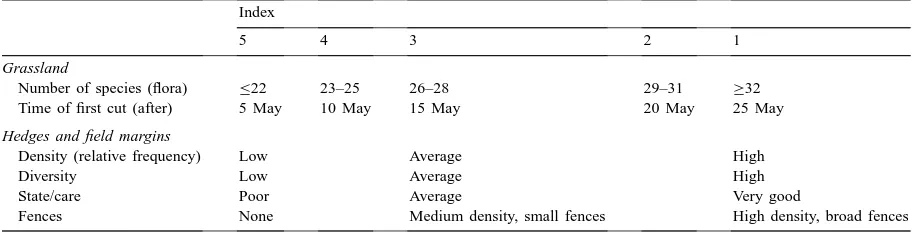
(calcu-Table 3
Estimation of the impact category biodiversity of life cycle assessment in the Allgäu regiona
Index
5 4 3 2 1
Grassland
Number of species (flora) ≤22 23–25 26–28 29–31 ≥32
Time of first cut (after) 5 May 10 May 15 May 20 May 25 May
Hedges and field margins
Density (relative frequency) Low Average High
Diversity Low Average High
State/care Poor Average Very good
Fences None Medium density, small fences High density, broad fences
a1: very good; 3: average of region; 5: unsatisfactory.
lated as two-times of the N2O-N emission) of the
farm-gate balance surplus.
Estimation schemes based on self-defined criteria and assumptions were used in the impact categories biodiversity (Table 3), landscape image and animal husbandry. The scientific basis for the indicators of these impact categories were derived from the much more detailed but time-consuming methods by Frieben (1998) for biodiversity and for animal welfare by Sundrum et al. (1994) and Sundrum (1997). Index 3 was defined as the estimated typical and character-istic average of all farms in the region, whereas the range was created by the random sample of the 18 analyzed farms.
Beyond the biotic elements the existence of fences was evaluated in the impact category of biodiversity (Table 3), because they create small biotopes; plant species and fauna were detected, which in a permanent grassland region only exist underneath a fence. Land-scape image in the Allgäu region is mainly influenced by agriculture. Diversity of grassland, especially flowering plants, as well as structured grassland areas through hedges and fences cause a pleasant impres-sion for the people. Care and layout of the farmsteads, which are usually exposed single locations or groups of farms in the countryside, and the grazing cattle were evaluated as characteristic elements of the region in the landscape image category (Table 2). The pres-ence of the grazing cattle, and therefore the fpres-ences, depends on the length of the grazing period and typ-ical look (breed, horned, cow bells). Alpine young cattle keeping in the summer time was estimated as a positive indicator, because it ensures the characteristic alpine mountain meadows in southern Germany.
The farmed area was the geographical coverage. Considerations were restricted to the year 1997; single or rare events (for example each 10 years) compared with other years were excluded. Most impacts were referenced to the LCA functional unit ha of farmed grassland. Some abiotic categories also were related to the produced units of milk (in kg) (see Haas et al., 2000). The functional unit for the categories of bio-diversity, landscape image and animal husbandry was the whole farm.
The impact on human- and eco-toxicity, accumula-tion of heavy metals and the consumpaccumula-tion of mineral resources as a result of agriculture in the Allgäu region are low. Therefore, the methods used and re-sults achieved in these categories are not presented. In case of no substantial deviation from the normal distribution and homogeneity of variance, the results for the abiotic impact categories were tested for sig-nificance using the PROC GLM procedure for the analysis of variance with a completely randomized design of three farming systems with six replications (farms) by using the SAS statistical package (SAS Institute Inc., Cary, NC, 1996). Differences between the means (MSD) were analyzed using the Tukey test at the alpha 5% level.
3. Results and discussion
3.1. Resource consumption
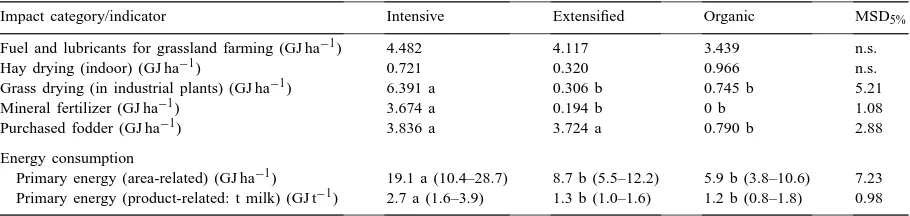
Table 4
Inventory of the impact category primary energy consumption of life cycle assessment in the Allgäu regiona
Impact category/indicator Intensive Extensified Organic MSD5%
Fuel and lubricants for grassland farming (GJ ha−1) 4.482 4.117 3.439 n.s.
Hay drying (indoor) (GJ ha−1) 0.721 0.320 0.966 n.s.
Grass drying (in industrial plants) (GJ ha−1) 6.391 a 0.306 b 0.745 b 5.21
Mineral fertilizer (GJ ha−1) 3.674 a 0.194 b 0 b 1.08
Purchased fodder (GJ ha−1) 3.836 a 3.724 a 0.790 b 2.88
Energy consumption
Primary energy (area-related) (GJ ha−1) 19.1 a (10.4–28.7) 8.7 b (5.5–12.2) 5.9 b (3.8–10.6) 7.23
Primary energy (product-related: t milk) (GJ t−1) 2.7 a (1.6–3.9) 1.3 b (1.0–1.6) 1.2 b (0.8–1.8) 0.98
aMean and range (in brackets) of farming system. Differences between the means (MSD) were tested using the Tukey test at the alpha
5% level indicated by different letters or as not significant (n.s.).
(Table 4). In contrast, organic farms need only one-third of area-related energy input and only half of the product-related energy that intensive farms need. Besides fuel and lubricants for grassland farming, additional energy was calculated to compute the total amount of fossil energy needed, used either for hay drying (electricity for ventilators, fuel oil for heating the ventilation air) or for grass drying in small local industrial plants, managed by farmers’ cooperatives, producing grass pellets (electricity, natural gas and diesel). With both drying processes high fodder qual-ities for high performing dairy cows are achieved. Five intensive and only one extensified and organic farm perform grass drying.
Compared with the intensive farms a reduction of 55 and 69% area-related along with 52 and 56% product-related energy use for the extensified and organic farms, respectively, is realized. Because of lower fodder purchases the organic farms need less area-related energy compared with extensified farms. Conventional farms in Germany use approximately 19.4 GJ ha−1 and organic farms around 6.8 GJ ha−1
(65% less, Haas et al., 1995). For mixed farming in the Hamburg region conventional farms uses 16.3 GJ ha−1
and organic farms 6.8 GJ ha−1 (58% less, according
Geier et al., 1998). Although the methods and fig-ures to quantify the energy used in these studies dif-fer slightly, the energy use in the Allgäu region with permanent grassland farming is high compared with mainly arable farming in the Hamburg region and for German farms on average. The product-related energy use calculated by Cederberg and Mattsson (1998) for Swedish dairy farms is 2.85 and 2.4 GJ t−1 milk for
conventional and organic farming, respectively, which
is twice as much energy as the organic farms in the Allgäu region (1.2 GJ t−1) need, but different
calcula-tion methods were used.
3.2. Global warming potential
Differences in CO2-emissions are caused by
these different uses of fossil energy. The CH4- and
N2O-emissions are comparably low, but due to the
high GWP of these trace gases their climate relevance is much higher (Table 5). The area-related GWP decreases for intensive (9.4 t CO2ha−1), extensified
(7.0 t CO2ha−1) and organic farms (6.3 t CO2ha−1),
accordingly. For product-related energy use the ex-tensified farms (1.0 t CO2ha−1) cause the significant
lowest GWP, whereas intensified and organic farms (1.3 t CO2ha−1) have the same emissions. Lower
CO2- and N2O-emissions of the organic farms are
compensated by a higher emission of CH4per unit of
produced milk because of lower milk performance.
3.3. Soil functions: eutrophication and acidification
In the Allgäu region eutrophication and acidifi-cation stress the forest and fen soils and their re-lated ecosystems. Acidification is almost exclusively caused by ammonia emission from the cattle keeping (Table 6). Because of the lower stocking rate and a lower N-excretion (milk production is lower) the ex-tensified (119 kg SO2ha−1) and especially the organic
farms (107 kg SO2ha−1) emit a lower amount of
ammonia compared with the intensive farms (136 kg SO2ha−1), although it is still too much for sensitive
Table 5
Inventory of the impact category global warming potential of life cycle assessment in the Allgäu regiona,b
Impact category/indicator Intensive Extensified Organic MSD5%
CO2-emission 1.280 a 0.666 b 0.428 b 0.45
CH4-emission 5.102 a 4.535 ab 4.114 b 0.77
N2O-emission 3.017 a 1.808 b 1.776 b 0.65
Global warming potential
Area-related (t ha−1) 9.4 a (7.5–11.2) 7.0 b (5.7–8.0) 6.3 b (5.6–7.3) 1.66
Product-related (t t−1milk) 1.3 a (1.1–1.7) 1.0 b (0.9–1.2) 1.3 a (1.2–1.4) 0.22
aIn t CO
2-equivalents; mean and range (in brackets) of farming system.
bDifferences between the means (MSD) were tested using the Tukey test at the alpha 5% level indicated by different letters.
computed in PO4-equivalents is mainly indicated by
the N- and P-surplus (Table 6). It is significantly higher for intensive (54.2 kg PO4ha−1) compared
with organic farms (13.5 kg PO4ha−1), extensified
farms emit 31.2 kg PO4ha−1.
3.4. Water quality: N- and P-balances
With farmyard manure (mainly slurry) an average of 144 kg N ha−1is applied by intensive farms
com-pared to 128 and 117 kg N ha−1by extensified and
or-ganic farms, respectively (28% of ammonia losses are already extracted). Intensive farms use 68 kg N ha−1
of mineral fertilizer additionally. The average portion of white clover was 5.8, 10 and 15.5% for intensive, extensified and organic farms, respectively.
Table 6
Inventory of the impact category eutrophication and acidification of life cycle assessment in the Allgäu regiona,b
Impact category/indicator Intensive Extensified Organic MSD5%
Acidification (in SO2-equivalents)
SO2-emission 1.1 a 0.7 b 0.3 c 0.31
NOx-emission 6.1 a 4.6 a 2.6 b 1.94
NH3-emission 129 a 113 ab 104 b 21.68
Sumb 136 a (119–145) 119 ab (96–143) 107 b (94–118) 23.01
Eutrophication (in PO4-equivalents)
Nox-emission 1.13 a 0.86 a 0.48 b 0.36
N (farmgate balance)c 33.6 a 13.4 b 13.1 b 15.0
P (farmgate balance)c 19.5 16.9 0 n.s.
Sumb 54.2 a (17.8–90.1) 31.2 ab (0.6–48.6) 13.5 b (7.4–19.0) 28.3
aIn kg ha−1; mean and range (in brackets) of farming system.
bDifferences between the means (MSD) were tested using the Tukey test at the alpha 5% level indicated by different letters or as not
significant (n.s.).
cCalculated eutrophication potential for N and P are based on the farmgate balances for these elements (see Tables 7 and 8), but only
positive N and P farm-balances were considered.
Farmgate balances for intensive farms result in av-erage 80 and 31 kg N ha−1for extensified and organic
farms (Table 7). Only as a rough calculated figure the nitrate leaching potential is 36 kg N ha−1for intensive
farms, whereas on average no nitrate leaching can be stated for the other farming intensities. In the Allgäu region the nitrate content in the ground water is gen-erally low (around 10–25 mg nitrate l−1). The soil and
subsoil conditions (humic) are considered to have a high denitrification potential.
The amount of total P-fertilizing is 34.6, 30.9 and 23.2 kg P ha−1 and P-farmgate balance is 5.3, 4.5
and−2.3 kg P ha−1for the intensive, extensified and
Table 7
Inventory of the impact category ground water quality (N-balance) of life cycle assessment in the Allgäu regiona
Indicator Intensive Extensified Organic MSD5%
A N-fertilizer 68.1 (35.5–100.7) 0 0
B Purchased fodder, straw and cattle 39.5 ab (23.5–65.2) 45.0 a (9.2–85.6) 11.9 b (2.3–19.6) 28.74 C Symbiotic N2 fixation 20.3 b (9.0–28.0) 31.7 b (20.0–48.0) 50.2 a (28.0–62.0) 14.92
D N-export 47.8 a (37.3–62.5) 45.3 a (39.0–56.8) 31.0 b (25.4–38.4) 11.07
T1 N-farmgate balanceb 80.1 a (40.4–115) 31.4 b (−3.8–66.2) 31.1 b (16.2–44.2) 36.21
E Atmospheric deposition 20.0 20.0 20.0 –
F Ammonia losses 55.9 (48.6–63.4) 49.6 (40.4–60.1) 45.4 (39.6–50.5) n.c.
G Denitrification 8.1 (6.9–9.1) 6.0 (4.8–7.4) 6.2 (5.0–7.0) n.c.
T2 Potential NO3-N-leachingc 36.0 a (2.9–63.5) 4.3 b (−37.4–25.8) −0.5 b (−9.2–6.8) 31.59
Total N-fertilizingd (mineral fertilizer and slurry) 212.5 a (166–255) 128.0 b (104–157) 116.7 b (102–130) 36.21
aIn kg N ha−1; mean and range (in brackets) of farming system. Differences between the means (MSD) were tested using the Tukey
test at the alpha 5% level indicated by different letters; not computed (n.c.) because calculations are based on rough figures.
bN-farmgate balance: T
1=A+B+C−D.
cNegative values for potential nitrate leaching are not very meaningful, but do show variation and differences between the systems
(T2=T1+E−F−G).
dValues for the total amount of fertilizing only serve as an additional indicator that is not part of the farmgate balance.
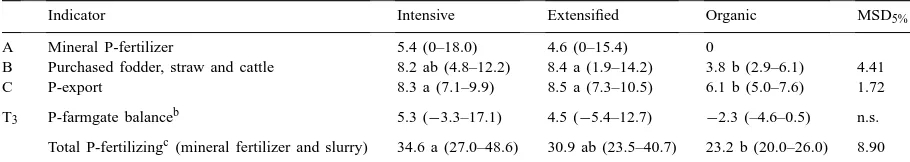
of about 0.41 kg P related to 1 ha farmed grassland in the catchment area, whereas the measured input was 1.6 kg P ha−1, causing clear P-eutrophication, which
is stated for several lakes with grassland farming in the catchment area in the Allgäu region. Besides the use of mineral P-fertilizer, the P-import of purchased fod-der — straw and cattle, amount to 1 kg P ha−1
max-imum — in intensive (8.2 kg P ha−1) and extensified
farms (8.5 kg P ha−1) doubles significantly compared
with the organic farms (3.8 kg P ha−1; Table 8), where
additional purchase of fodder is limited.
Table 8
Inventory of the impact category surface water quality (P-balance) of life cycle assessment in the Allgäu regiona
Indicator Intensive Extensified Organic MSD5%
A Mineral P-fertilizer 5.4 (0–18.0) 4.6 (0–15.4) 0
B Purchased fodder, straw and cattle 8.2 ab (4.8–12.2) 8.4 a (1.9–14.2) 3.8 b (2.9–6.1) 4.41
C P-export 8.3 a (7.1–9.9) 8.5 a (7.3–10.5) 6.1 b (5.0–7.6) 1.72
T3 P-farmgate balanceb 5.3 (−3.3–17.1) 4.5 (−5.4–12.7) −2.3 (–4.6–0.5) n.s.
Total P-fertilizingc(mineral fertilizer and slurry) 34.6 a (27.0–48.6) 30.9 ab (23.5–40.7) 23.2 b (20.0–26.0) 8.90
aIn kg P ha−1; mean and range of farming system. Differences between the means (MSD) were tested using the Tukey test at the
alpha 5% level indicated by different letters or as not significant (n.s.).
bP-farmgate balance: T
3=A+B−C.
cValues for the total amount of fertilizing only serve as an additional indicator that is not part of the farmgate balance.
3.5. Biodiversity
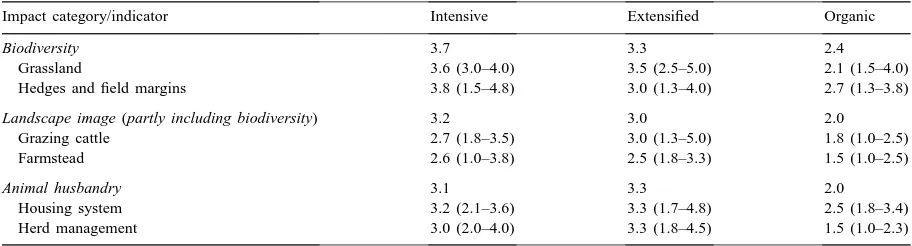
Table 9
Inventory of the impact category biodiversity, landscape image and animal husbandry of life cycle assessment in the Allgäu regiona
Impact category/indicator Intensive Extensified Organic
Biodiversity 3.7 3.3 2.4
Grassland 3.6 (3.0–4.0) 3.5 (2.5–5.0) 2.1 (1.5–4.0)
Hedges and field margins 3.8 (1.5–4.8) 3.0 (1.3–4.0) 2.7 (1.3–3.8)
Landscape image (partly including biodiversity) 3.2 3.0 2.0
Grazing cattle 2.7 (1.8–3.5) 3.0 (1.3–5.0) 1.8 (1.0–2.5)
Farmstead 2.6 (1.0–3.8) 2.5 (1.8–3.3) 1.5 (1.0–2.5)
Animal husbandry 3.1 3.3 2.0
Housing system 3.2 (2.1–3.6) 3.3 (1.7–4.8) 2.5 (1.8–3.4)
Herd management 3.0 (2.0–4.0) 3.3 (1.8–4.5) 1.5 (1.0–2.3)
aEstimation index: 1: very good, 3: average of the region, 5: unsatisfactory; mean of farming system, range in brackets.
three years ago to organic agriculture has a very low number of species (23) compared to the rest of the or-ganic farms (on average 30.2 plant species), as well as a very early first cut (around 15 May). The earliest first cut is carried out by extensified farms between 5 and 15 May, whereas intensified farms cut the first time in spring for silage around 10 May until 20 May. The organic grassland is cut around 20 May until 25 May (except one farm, see above). Cutting for grass drying by the intensive farms of about an average of 6 ha each starts around the beginning of May. Hedges and field margins are primarily influenced by the farmers’ atti-tude (e.g. personality, ecological understanding), indi-cated by the wide range of the indices. The presence of these indicators is predominantly independent of the farming system (Table 9).
3.6. Landscape image
In the impact category of landscape image the exten-sified farms show the shortest and the organic farms, the longest grazing season. Only the five organic farms do not dehorn the calves. No differences for breed (i.e. share of Brown Swiss) and alpine cattle keeping were found between the farming intensities. Nevertheless, there were some differences between the farms. The more positive scoring of organic farms for the indica-tor farmstead (Table 9) could not be explained by aim-ing for an attractive farmstead for direct marketaim-ing. Although there was usually one farm in each farming system that was exemplary for at least one indicator in the landscape image impact category, organic farms on average show a higher scoring (Table 9).
3.7. Animal husbandry
Animal housing systems also are slightly more positively scored in organic farms whereas herd man-agement of the organic farms is clearly more posi-tive compared to extensified and intensive farming (Table 9). In extensified farms grazing is strongly reduced or all year inside keeping and feeding is practised, which was negatively scored. More appro-priate housing systems would result in a more positive scoring for all farming intensities.
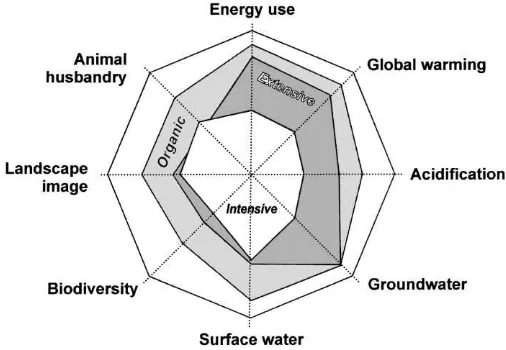
3.8. Impact of farming systems
Compared with extensified or organic farms, inten-sive farms show negative environmental impacts in the impact categories of energy consumption, global warming potential, soil functions of other ecosystems (acidification), surface water (P-eutrophication), bio-diversity and landscape image (Fig. 1). Extensified and organic farms reduce these negative effects in the energy consumption, global warming potential and ground water impact categories, because they renounce mineral nitrogen fertilizer. The impact on animal husbandry of extensified farms is slightly more negative compared with the intensive farms. Because fodder production is not as high as by inten-sive farming, extensified farms try to compensate by intensifying other production processes (e.g. earliest first cut of grassland, shortest or no grazing season to avoid grazing losses from indoor feeding).
Fig. 1. Inventory (schematic) of selected impact categories and indicators of life cycle assessment of the farming systems intensive, extensified and organic in the Allgäu region. Netline outside (=100%, positive)/centre of net (=0%, negative): estimation indices=1/5; energy use=3.5/30 GJ ha−1; CO
2-equivalents ha−1=5.5/12 t; SO2-equivalents ha−1=90/160 kg; farmgate surplus=20/120 kg N ha−1(ground
water) and−5/20 kg P ha−1(surface water).
landscape image and animal husbandry. P-eutrophica-tion of the lakes, diminishing biodiversity and char-acter of the landscape are the central environmental problems in the region. The impact in these categories does not directly relate to the stocking rate or the use of mineral fertilizers. Organic agriculture shows inher-ent ecological advantages of the production system, which in most of the indicators were significant com-pared with intensive farming.
4. Conclusions
Using the process-LCA method differences among the agricultural production intensities according to their environmental impact were identified and com-prehensively evaluated for their various effects on the environment. Therefore, LCA can be an important and efficient tool for ecological weak-point analyzes for farmers and advisors (Haas and Wetterich, 1999) as well as for politicians creating agri-environmental programs (Haas and Wetterich, 2000). Efficient mea-sures can be derived to establish an environmentally sound agricultural production system.
The study confirmed the suitability of LCA for comparing farms and farming systems, but further development of the LCA-methodology in
agricul-ture is required. In the fuagricul-ture the basis of evaluation should be reference data, limiting values, critical load limits or goals of environmental quality, if reliable data exist. The estimations made in the biotic and aesthetic subranges are more or less subjective, al-though the determined differentiation and order of rank can be reproduced. The definitions and clas-sifications chosen need to be standardized. Experts and local people should achieve consensus if further LCAs on a broader base will be undertaken in the region. This is obvious for the criteria and evaluation in the impact category of landscape image. However, because several impact categories and indicators must be monitored, only pragmatic and resource efficient approaches can be used.
Acknowledgements
The authors wish to thank Dr. Uwe Geier and Mrs. Denise Short for critical review and proof reading of the manuscript.
References
für Natur- und Umweltschutz. Verhandlungen der Gesellschaft für Ökologie 20, 375–383.
Audsley, A., Alber, S., Clift, R., Cowell, S., Crettaz, R., Gaillard, G., Hausheer, J., Jolliett, O., Kleijn, R., Mortensen, B., Pearce, D., Roger, E., Teulon, H., Weidema, B., van Zeijts, H., 1997. Harmonisation of environmental life cycle assessment for agriculture. Final report, Concerted Action AIR3-CT94-2028, European Commission DG VI, Brussels, Belgium.
BLBP (Bayerische Landesanstalt für Bodenkultur und Pflan-zenbau), 1997a. Datenvorgabe (Basisdaten) für die Erstellung des Vergleiches der Nährstoffzu- und -abfuhren nach §5 Düngeverordnung und Handformular zur Berechnung der Nährstoffzu- und -abfuhren, Stand Februar 1997, Eigenverlag, Freising/München, Germany.
BLBP (Bayerische Landesanstalt für Bodenkultur und Pflan-zenbau), 1997b. Boden-Dauerbeobachtungs-Flächen, Bericht nach 10jähriger Laufzeit 1985–1995, Teil II. Schriftenreihe der Bayerischen Landesanstalt für Bodenkultur und Pflanzenbau May 1997, Eigenverlag, Freising/München, Germany. Boumann, A.F., Van den Born, G.J., Swart, R.J., 1991. Land
use related sources of CH4 and N2O. Expert report document
12/1-a, 25–26 November 1991, Enquete-Commission of the German parliament on Protecting the Atmosphere of the Earth, Bonn, Germany, pp. 207–267.
Cederberg, C., Mattsson, B., 1998. Life cycle assessment of Swedish milk production — a comparison of conventional and organic farming. In: Ceuterick, D. (Ed.), Proceedings of the International Conference on Life Cycle Assessment in Agriculture, Agro-Industry and Forestry, Brussels, Belgium, 3–4 December 1998, pp. 161–167.
Ceuterick, D. (Ed.), 1996. In: Proceedings of the International Conference on Application of Life Cycle Assessment in Agriculture, Food and Non-Food Agro-Industry and Forestry, Brussels, Belgium, 4–5 April 1996.
Ceuterick, D. (Ed.), 1998. In: Proceedings of the International Conference on Life Cycle Assessment in Agriculture, Agro-Industry and Forestry, Brussels, Belgium, 3–4 December 1998.
Crutzen, P.J., Aselmann, I., Seiler, W., 1986. Methane production by domestic animals, wild ruminants, other herbivorous fauna, and humans. Tellus 38B, 271–284.
Frieben, B., 1998. Verfahren zur Bestandsaufnahme und Bewertung von Betrieben des Organischen Landbaus im Hinblick auf Biotop- und Artenschutz und die Stabilisierung des Agrarö-kosystems. Ph.D. Thesis, Verlag Dr. Köster, Berlin, Germany. Frieben, B., Köpke, U., 1996. Effects of farming systems on
biodiversity. In: Isart, J., Llerena, J.J. (Eds.), Proceedings of ENOF (European Network on Research in Organic Farming) Workshop on Biodiversity and Land Use: The Role of Organic Farming, Bonn, Germany, pp. 11–21.
Geier, U., 2000. Anwendung der Ökobilanzmethode in der Land-wirtschaft — dargestellt am Beispiel einer Prozess-Ökobilanz konventioneller und organischer Bewirtschaftung. Ph.D. Thesis, Verlag Dr. Köster, Berlin, Germany.
Geier, U., Köpke, U., 1998. Comparison of conventional and organic farming by process-life cycle assessment — a case study of agriculture in Hamburg. In: Ceuterick, D. (Ed.), Proceedings
of the International Conference on Life Cycle Assessment in Agriculture, Agro-Industry and Forestry, Brussels, Belgium, 3–4 December 1998, pp. 31–38.
Geier, U., Frieben, B., Haas, G., Molkenthin, V., Köpke, U., 1998. Ökobilanz Hamburger Landwirtschaft — Umweltrelevanz verschiedener Produktionsweisen, Handlungsfelder Hamburger Umweltpolitik. Verlag Dr. Köster, Berlin, Germany.
Gibbs, M.J.J., Woodbury, W., 1993. Methane emissions from live-stock manure. In: Van Amstel, A.R. (Ed.), Methane and Nitrous Oxide. RIVM Report, National Institute of Public Health and Environmental Protection, Bilthoven, The Netherlands, pp. 81–91.
Haas, G., Wetterich, F., 1999. Ökobilanz der Umweltwirkung landwirtschaftlicher Betriebe im Allgäu. Z. für Angew. Umweltforschung 12, 368–377.
Haas, G., Wetterich, F., 2000. Agrarumweltprogramm mit Ökobilanz im Allgäu zielorientiert gestalten. Berichte über Landwirtschaft 78, 92–105.
Haas, G., Geier, U., Schulz, D.G., Köpke, U., 1995. A comparison of conventional and organic agriculture. Part I. Climate relevant carbon dioxide emission from the use of fossil energy. Berichte über Landwirtschaft 73, 401–415 (in German).
Haas, G., Wetterich, F., Geier, U., 2000. Life cycle assessment framework in agriculture on the farm level. J. LCA, in press. Heijungs, R., Guinée, J.B., Huppes, G., Lankreijer, R.M., Udo de
Haes, H.A., Wegener Sleeswijk, A., 1992. Environmental life cycle assessment of products. Centre of Environmental Science, Leiden, The Netherlands.
Heyer, J., 1994. Methan. Studie im Auftrag der Enquetekommi-ssion des Deutschen Bundestages Schutz der Erdatmosphäre. Studienprogramm, Band 1, Landwirtschaft, Teilband I. Economica Verlag, Bonn, Germany.
IPCC (Intergovernmental Panel on Climate Change), 1996. Climate change 1995 — the science of climate change. University Press, Cambridge, UK.
ISO (International Standardization Organization), 1997. Environ-mental management — life cycle assessment — principles and framework — ISO-norm 14040:1997. European Committee for Standardization, Brussels, Belgium.
Kirchgessner, M., Windisch, W., Müller, H.L., Kreuzer, M., 1991. Release of methane and of carbon dioxide by dairy cattle. Agribiol. Res. 44 (2/3), 91–102.
Kohler, A., Abt, K., Zelesny, H., 1989. Das Grünlandgebiet des Allgäu aus der Sicht der Landschaftsökologie. Informationen für die Landwirtschaftsberatung in Baden-Württemberg Nr. 6, 49–71.
KTBL (Kuratorium für Technik und Bauwesen in der Land-wirtschaft), 1994. KTBL-Taschenbuch Landwirtschaft 1994/95, 17th Edition, Germany.
KTBL (Kuratorium für Technik und Bauwesen in der Landwirtschaft, Ed.), 1997. Datensammlung Betriebsplanung 1997/98, 15th Edition, Germany.
Mosier, A., Kroeze, C., 1998. A new approach to estimate emi-ssions of nitrous oxide from agriculture and its implications for the global N2O budget. Newsletter of the International
Neyer, H., 1999. Influence of landuse on the phosphorus export from grassland. Zeitschrift für Kulturtechnik und Landen-twicklung 40, 49–52 (in German).
OECD (Organisation for Economic Co-operation and Development), 1997. Environmental Indicators for Agriculture. Paris, France.
Patyk, A., Reinhardt, G.A., 1997. Düngemittel — Energie- und Stoffstrombilanzen. Verlag Vieweg, Braunschweig, Wiesbaden, Germany.
Pommer, G., Neyer, H., Jordan, F., 1997. Phosphorus burden of a prealpine lake with grasslands in the catchment basin. Agribiol. Res. 50 (4), 325–332 (in German).
Reinhardt, G.A., 1997. Bilanzen über die gesamten Lebenswege. In: Kaltschmitt, M., Reinhardt, G.A. (Hrsg.), Nachwachsende Energieträger — Grundlagen, Verfahren, ökologische Bilanz-ierung. Verlag Vieweg, Braunschweig, Wiesbaden, Germany, pp. 84–95.
Rück, F., Homevo-Agossa, C., Stahr, K., 1997. Significance of gaseous losses on the nitrogen balance in subalpine grasslands. In: Jarvis, S.C., Pain, B.F. (Eds.), Gaseous Nitrogen Emissions from Grasslands. CAB International, Oxon, New York, pp. 73–75.
Rudloff, B., Geier, U., Meudt, M., Schick, H.-P., Urfei, G., 1999. Development of indicators for the assessment of agricultural impacts on the environment. Federal Environmental Agency, Texte 42/99, Berlin, Germany, 252 pp. (in German). Schulz, H., 1992. Langjährige Veränderungen der
Grünland-bestände im Württembergischen Allgäu. In: AG Grünland und
Futterbau in der Gesellschaft für Pflanzenbauwissenschaften, 36. Jahrestagung, Stuttgart-Hohenheim, Tagungsband, Ger-many, 27–29 August 1992, pp. 14–24.
SETAC (Society of Environmental Toxicology and Chemistry), 1993. Guidelines for Life-Cycle Assessment: A Code of Practice. Brussels, Belgium.
Sundrum, A., 1997. Assessing housing conditions in terms of animal welfare — possibilities and limitations. In: Sorensen, J.T. (Ed.), Proceedings on Livestock Farming Systems — More Than Food Production, Foulum, Denmark, EAAP (European Association for Animal Production) Publication No. 89, pp. 238–246.
Sundrum, A., Andersson, R., Postler, G. (Eds.), 1994. Tierger-echtheitsindex — 200 1994 — ein Leitfaden zur Beurteilung von Haltungssystemen. Verlag Köllen, Bonn, Germany. Wegener Sleeswijk, A., Kleijn, R., van Zeijts, H., Reus,
J.A.W.A., Meeusen van Onna, M.J.G., Lenemann, H., Sengers, H.H.W.J.M., 1996. Application of LCA to agricultural products. Report 130, Centre of Environmental Science, Leiden University, Leiden, The Netherlands.
Weissbach, F., 1997. Zur Schätzung der Stickstoffbindung durch Weissklee auf Dauergrünland. In: AG Grünland und Futterbau in der Gesellschaft für Pflanzenbauwissenschaften, 41. Jahrestagung, Aulendorf, Tagungsband, Germany, 28–30 August 1997, pp. 250–253.