QUALITY TEST VARIOUS EXISTING DEM IN INDONESIA
TOWARD 10 METER NATIONAL DEM
Fahmi Amhara
a Geomatics Research Center, Geospatial Information Agency
Jl. Jakarta-Bogor Km. 46 Cibinong INDONESIA – [email protected] Commission IV
KEY WORDS: Quality Test, DEM, Indonesia,
ABSTRACT:
Indonesia has various DEM from many sources and various acquisition date spreaded in the past two decades. There are DEM from spaceborne system (Radarsat, TerraSAR-X, ALOS, ASTER-GDEM, SRTM), airborne system (IFSAR, Lidar, aerial photos) and also terrestrial one. The research objective is the quality test and how to extract best DEM in particular area. The method is using differential GPS levelling using geodetic GPS equipment on places which is ensured not changed during past 20 years. The result has shown that DEM from TerraSAR-X and SRTM30 have the best quality (rmse 3.1 m and 3.5 m respectively). Based on this research, it was inferred that these parameters are still positively correlated with the basic concept, namely that the lower and the higher the spatial resolution of a DEM data, the more imprecise the resulting vertical height.
1. INTRODUCTION
1.1 Background
Mapping of Indonesian Topography (RBI) is one of the main tasks of the Geospatial Information Agency (BIG). BIG is assigned to map RBI from small scale to large scale. One of the main elements in the map is hypsography which will describe the shape of the earth's surface. The earlier primary data sources are aerial photographs.
Along with the development of remote sensing technology, it is now available a wide range of data that can be used to obtain elevation data digitally, known as Digital Elevation Model (DEM). Some of this data has also been used by BIG in mapping the RBI. Some types of data are SRTM DEM, IFSAR, TerraSAR-X, ASTER-GDEM and LIDAR. The DEM data have been used for mapping on a scale of 1: 50,000 and 1: 25,000. Thus, the challenge today is on large-scale mapping, which is a scale of 1: 10,000, 1: 5,000, and even 1: 1000, which has been awaited by local government agencies and the public for detailed spatial plan. Large scale mapping would require DEM data with higher resolution and accuracy level anyway. This hi-res DEM is also required to ortho-process high-resolution satellite imagery (CSRT).
The research question is how the real-accuracy of each DEM is measured and how to integrate the entire DEM becomes a national DEM. A consolidated national DEM is an essential key to implement One Map Policy.
1.2 DEM
DEM data may be Digital Surface Model (DSM) and Digital Terrain Model (DTM). DSM covers the entire surface of the object (buildings, vegetation, etc.), while DTM represents the height above ground level (bare earth). DSM presents a surface that is obtained when the acquisition while DTM generated
from processing DSM so that its height just above the ground. Contours contained in the topographic maps generated from the data extraction using DTM (Petrie & Kennie, 1987).
DTM formation requires advanced process to lower the height of the surface to the terrain. Indonesia conventional topographical mapping using stereo plotting techniques by forming a 3D model of stereopair of aerial photographs or orthorectified radar image (ORRI) and its stereomate formed from the ORRI and DSM. Through this 3D model we creates hypsography elements like mass point, ridge line (break line), and the river's which shape DTM and contour (Li, Zhu, & Gold, 2005).
Currently, there are some well known global DEM available: SRTM, ASTER-GDEM, and TerraSAR-X.
SRTM mounted on the Space Shuttle and the earth's surface elevation data obtained with synthetic aperture radar (SAR) technology. SRTM utilizes radar interferometry to process data until a DEM. In radar interferometry, two radar images were acquired simultaneously required by two antennas. Two images that have these differences allow for the calculation of the elevation of the earth's surface. SRTM flown for 11 days at 11 to 22 February 2000, and collected data more than 80% of the earths land 60°N to 56°S. On SRTM there are two types of antenna panels, C-Band and X-Band. The C-Band will be processed by Jet Propulsion Laboratory (JPL), which provides global DEM and distributed through the USGS. X-Band will be processed and distributed by the German Aerospace Center (DLR), which resulted higher resolution DEM, but it does not have global coverage. Data C-Band is expected to have an accuracy of horizontal and vertical approach the 20 m and 16 m (error linear at 90% confidence), to release final data 1 arc-sec of the United States (NASA, 2005).
Vertical precision of SRTM DEM depends on the phase noise in radar, while the horizontal resolution depends on the ratio of The International Archives of the Photogrammetry, Remote Sensing and Spatial Information Sciences, Volume XLI-B4, 2016
signal-to-noise as a function of horizontal wavelength. Horizontal resolution of SRTM data is divided into: 1 arc-sec or 30 m (SRTM30) and 3 arc-sec or 90 m (SRTM90). SRTM30 data is only available for locations in the US while the SRTM90 data is available to the public free of charge (Gesch, 2005). NASA and METI Japan then released the second version GDEM (GDEM 2) in mid-October 2011. Some things improved from GDEM first version, such as the horizontal resolution is improved using a smaller kernel (5 x 5 after 9 x 9 in GDEM 1.0) as well as improvements the masking waters. GDEM 2 has a vertical accuracy of 20 m and 30 m horizontal accuracy at 95% confidence level. ASTER GDEM distributed in GeoTIFF format with geographic coordinate system. Horizontal datum used is WGS84, while the vertical datum is EGM96 (Athmania, 2014; Li, 2013; Forkuor, 2012)
TerraSAR-X is the first remote sensing satellite implemented in a public-private partnership business model and is the follow-up mission of SRTM. TerraSAR-X can be operated in spotlight, stripmap, and scanSAR-mode with two polarizations in some combination. Each mode has a different resolution. Stripmap mode has a resolution of 3 m x 3 m, spotlight mode 1 m x 1 m, while the scanSAR mode has a resolution of 16 m x 16 m ((Li, 2013).
DEM formation of TerraSAR-X Data can use interferometry or radargrammetry. Interferometry uses the phase difference of the two images with the same geometry, the repeat pass for 11 days or single pass simultaneously. The radargrammetry use two images with different geometry or the acquisition of a 3D
stereo reconstruction. If both methods were compared, SAR interferometry is more accurate than radargrammetry, but radargrammetry overcome the weaknesses of interferometry related temporal disconnection as a result of the repeat pass for 11 days (Raggam, 2010).
1.3 Accuracy of DEM Data
Accuracy DEM determined from the error in the spatial coordinates (X, Y, Z) points tested on the DEM. Validation accuracy DEM data can be done by comparing DEM tested and DEM referenced or by testing the amount of vertical errors of DEM using Ground Control Points (GCP) are obtained from field surveys (Mukherjee, 2013).
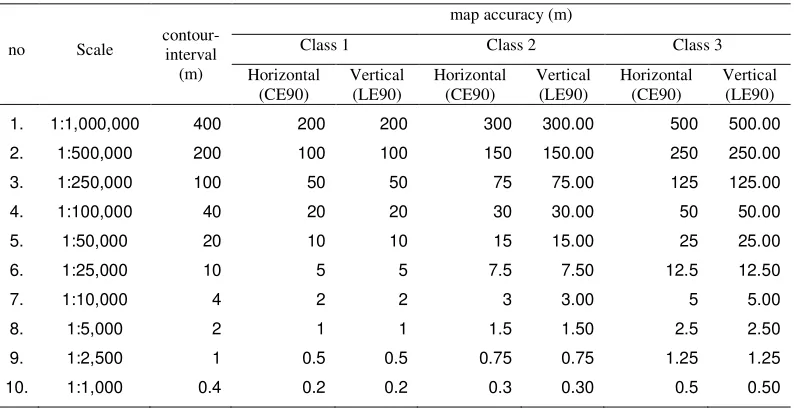
Indonesia has published a regulation about geometric accuracy of national topographic map (RBI) as shown in Table-1 and 2. Base map position accuracy value in Table 2 is the value for the accuracy Circular Error 90% (CE90) and Least Error (LE90) horizontal to vertical accuracy, which means that the position error does not exceed the value of the base map accuracy with 90% confidence level.
CE90 and LE90 value obtained by the following formula: CE90 = 1.5175 x RMSEr
LE90 = 1.6499 x RMSEz
** RMSE = Root Mean Square Error at position
Table 1. Geometric Accuracy of RBI maps.
no Scale contour-interval (m)
map accuracy (m)
Class 1 Class 2 Class 3
Horizontal (CE90)
Vertical (LE90)
Horizontal (CE90)
Vertical (LE90)
Horizontal (CE90)
Vertical (LE90)
1. 1:1,000,000 400 200 200 300 300.00 500 500.00
2. 1:500,000 200 100 100 150 150.00 250 250.00
3. 1:250,000 100 50 50 75 75.00 125 125.00
4. 1:100,000 40 20 20 30 30.00 50 50.00
5. 1:50,000 20 10 10 15 15.00 25 25.00
6. 1:25,000 10 5 5 7.5 7.50 12.5 12.50
7. 1:10,000 4 2 2 3 3.00 5 5.00
8. 1:5,000 2 1 1 1.5 1.50 2.5 2.50
9. 1:2,500 1 0.5 0.5 0.75 0.75 1.25 1.25
10. 1:1,000 0.4 0.2 0.2 0.3 0.30 0.5 0.50
Table 2. Geometrical Accuracy of RBI-maps according to Class
Accuracy Class 1 Class 2 Class 3
Horizontal 0.2 mm x scale numer 0.3 mm x scale numer 0.5 mm x scale numer Vertikal 0.5 x contour interval 1.5 x accuracy Class 1 2.5 x accuracy Class 1
1.4 DEM Data Accuracy Research
Various methods to validate the accuracy DEM data has been done in research. The research of the DEM can be considered a more thorough DEM reference and the other comparison to GPS measurement data. Some of the research that validates the accuracy of the DEM DEM by comparing with reference. The other research is to test the accuracy of the DEM is compared with that of GPS measurements, such as examines the data DSM TerraSAR-X with visual testing methods and statistical analysis,
Others use a combination of both, as Mukherjee et al. (2013) comparing DEM Cartosat, ASTER and SRTM, which tested the against DGPS point data and USGS DEM, which examines ASTER GDEM2 GPS measurements and SRTM in China (Mukherjee, 2013).
1.5 BIG NAS-DEM with National Coverage
BIG as the state organization which is responsible in making Basic Geospatial Information also required to be able to provide elevation datasets for the whole of Indonesia (Indonesian National Elevation Dataset / INED). However, not all types of data available in the BIG DEM cover all of Indonesia. BIG DEM has collected from various sources and acquisition year. Sometimes in one location there are a variety of DEM (Photogrammetry, SRTM30, Aster-GDEM, Stereoplotting-TerrasarX, IFSAR, Lidar, etc.). How to integrate the entire DEM to be a DEM-National? DEM data available for the whole area only SRTM90 data and Aster-GDEM. Information DEM data availability can be seen in Table 1. With both of these reasons, it is necessary to test the accuracy for each type of data existing DEM (Hoja & d’Angelo, 2010).
Tabel 3. DEM Data availlability at BIG
Data Resolution/Scale Format Captured Year Coverage
RBI 10K (old) 1:30.000 1994 Part of West Java
IFSAR .bil 1997 West Java
Foto Udara Digital 15 cm .tiff 2014 Bogor
LiDAR 4 points/m2 las 2014 Bogor
TERRASAR-X 9 m .bil 2010-2011 Java
ASTER-GDEM 15 M .dted Indonesia
SRTM30 (30) 30m .dted 1999-2000 Indonesia
SRTM90 (90) 90m .dted 1999-2000 Indonesia
2. MATERIAL & METHODS
2.1 Locus
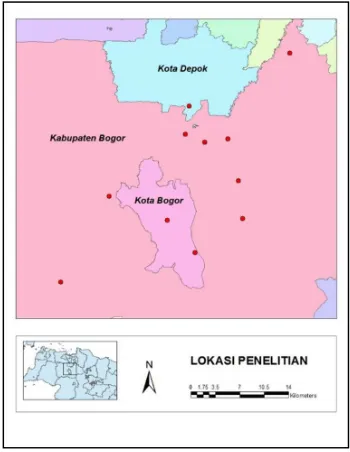
This research was conducted in the region around Cibinong, and Bogor. The choice of location this study considers what topography and accessibility as well as the range of CORS stations BAKO as reference for GPS measurements. The topography of the study area represent criteria that form the plains, hills and mountains. Associated with DEM data, this region represents an area with a low frequency, medium and high that will affect the accuracy of the data-tia each DEM data. In this case Cibinong region represents an area with flat topography, Bogor represent the hills and mountains. DEM data accuracy is determined by the topography and spatial resolution. Distribution of GPS measurement point in this study is shown in Figure 1.
There are 2 kinds of data, i.e. DEM data and GPS data field measurement results. DEM data used in this study consisted of ASTER-GDEM, IFSAR-DTM, TerraSAR-X (TSAR-X), SRTM30, SRTM90 and Topographic maps (RBI) which is based on Digital Aerial Photographs.
GPS measurement data with measurements performed in the field at some point determined as described in next section.
Fig 1. Distribution of GPS test point
2.2 Selecting GPS Test Point
The GPS Test point in the field is determined by the following criteria:
- a relative stable flat place which believed to be unchanged in the last 20 years; in certain place a steady inclined place is chosen.
- The measurement point spread evenly, a minimum of 10 points in the selected area.
2.3 Measurement Procedure
Measurements were made using CORS GPS Levelling with BIGs “BAKO” point as a reference. At the first measurement several observation for 15', 30', 60 'and 120' were made to find the optimal observation duration. It is found that duration of 15’ - 20’ gives the results that differ only 5 cm to data from 120’ duration. Standard deviation (sd-H) of the internal GPS is still under 4 mm. So it was decided the next observation is carried out for 30 minutes and is enough for the expected Z-accuracy. Measurements with this method is suitable for short-baseline measurement.
This brief static method relies on the process of rapid determination of phase ambiguity. Besides requiring the data processing software that is reliable and fast, short static method also requires a good satellite viewing geometry also. Accuracy (relative) position of the point obtained in using rapid static measurements are in the order of centimeters.
GPS data will be processed using DGPS methods (relative to any other point) where the results tied to the fixed observation stations CORS, which here is belonging to the Geospatial Information Agency (BAKO site code). To process the GPS data, a commercial software will be used.
2.4 DEM Accuracy Analysis
To get orthometrical height (H-orth), the measured ellipsoidal height (H-ell) will be corrected with geoid undulation using EGM2008-1 which is served at srgi.big.go.id and EGM1996 at www.unavco.org. Value undulations will refer to the WGS84 ellipsoid.
Fig 2. Calculation on SRGI website
To obtain Z-value at the test point in each DEM, the existing nearest cell coordinates will be extracted using ArcGIS software tools to Extract Value Points. This Z-value is normally already in orthometrical height. The deviation of Z-value (DEM) to the H-orth (GPS) will be calculated. From all test points, a RMS ( ) which indicates the accuracy of DEM will be calculated. Gunung Picung Zvalues does not exist because the RBI in the region are not available. The results of the processing tools in EGM96 datum (datum adjust GDEM ASTER and SRTM) is in Table-5.
3. RESULT & DISCUSSION
The following table-4 shows the H-orth at the test-points and its accuracy according the geoid model. Table-5 contains the Z-value of all test points in each DEM. And table-6 shows the Height-differences of Z-value in each DEM to the GPS meausred test points
Table 4. Calculation of elevation on EGM08 and EGM96
NO LOKASI LATITUDE LONGITUDE Hell
EGM08 EGM96 Δh
(EGM08-EGM96)
N Hort N Hort
1 Kota Wisata 6° 22' 33.43763" S 106° 57' 30.11776" E 80.3747 18.3606 62.0141 18.566 61.8087 0.2054
2 Sentul 6° 35' 21.11698" S 106° 53' 52.37036" E 331.9196 19.124 312.7956 18.777 313.1426 -0.3470
3 Kota Kembang 6° 26' 38.99122" S 106° 49' 43.88707" E 124.4043 18.1615 106.2428 18.320 106.0843 0.1585
4 Pemda Kab Bogor 6° 28' 50.01309" S 106° 49' 27.26370" E 147.3559 18.2628 129.0931 18.348 129.0079 0.0852
5 IPB Dramaga 6° 33' 39.60649" S 106° 43' 34.20247" E 199.1913 18.1469 181.0444 18.038 181.1533 -0.1089
6 Gunung Picung 6° 40' 16.00265" S 106° 39' 49.04604" E 601.2899 18.5502 582.7397 17.801 583.4889 -0.7492
7 Citeureup 6° 29' 12.26930" S 106° 52' 43.83558" E 144.1379 18.483 125.6549 18.527 125.6109 0.0440
8 Hambalang 6° 32' 27.04034" S 106° 53' 32.79216" E 466.4407 18.8025 447.6382 18.660 447.7807 -0.1425
9 Katulampa 6° 37' 59.40724" S 106° 50' 12.72371" E 367.1154 18.9719 348.1435 18.661 348.4544 -0.3109
10 Lap. Sempur 6° 35' 29.01435" S 106° 48' 02.24921" E 249.3444 18.5842 230.7602 18.431 230.9134 -0.1532
11 BIG-2 6° 29' 28.00350" S 106° 50' 56.08653" E 157.6958 18.3878 139.3080 18.444 139.2518 0.0562 The International Archives of the Photogrammetry, Remote Sensing and Spatial Information Sciences, Volume XLI-B4, 2016
Table 5. Z-value of all test points in each DEM
NO NAMA TITIK ASTER DTM TSAR-X SRTM30 SRTM90 RBI
1 Kota Wisata 62.9568 54.3649 61.0940 62.7958 60.6488 59.7946
2 Sentul 317.6590 298.8840 310.1740 308.9840 308.8190 303.3267
3 Kota Kembang 105.1530 106.3980 109.9335 106.9770 113.4260 105.8116
4 Pemda Kab. Bogor 125.0700 125.2190 132.7078 133.2970 131.4480 124.9148
5 IPB Dramaga 174.8660 181.5700 182.3449 180.4360 180.2380 175.1089
6 Gunung Picung 578.7800 566.1190 586.4632 582.7360 580.4970 N/A
7 Citeureup 123.7480 124.7050 129.9050 131.5870 132.2380 127.4523
8 Hambalang 453.5790 446.9700 449.6935 453.7130 470.2700 435.6485
9 Katulampa 350.1590 343.8810 345.8359 347.8530 349.5390 345.7264
10 Lapangan Sempur 222.0770 232.5440 236.2502 234.5100 241.0770 230.1532
11 BIG-2 130.2010 137.4450 139.9438 142.4530 142.2100 134.9438
Table 6. Height-differences of Z-value in each DEM to the GPS meausred test points
NO NAMA TITIK ASTER DTM TSAR-X SRTM30 SRTM90 RBI
1 Kota Wisata 1.148 -7.444 -0.715 0.987 -1.160 -2.014
2 Sentul 4.516 -14.259 -2.969 -4.159 -4.324 -9.816
3 Kota Kembang -0.931 0.314 3.849 0.893 7.342 -0.273
4 Pemda Kab. Bogor -3.938 -3.789 3.700 4.289 2.440 -4.093
5 IPB Dramaga -6.287 0.417 1.192 -0.717 -0.915 -6.044
6 Gunung Picung -4.709 -17.370 2.974 -0.753 -2.992 N/A
7 Citeureup -1.863 -0.906 4.294 5.976 6.627 1.841
8 Hambalang 5.798 -0.811 1.913 5.932 22.489 -12.132
9 Katulampa 1.705 -4.573 -2.619 -0.601 1.085 -2.728
10 Lapangan Sempur -8.836 1.631 5.337 3.597 10.164 -0.760
11 BIG -9.051 -1.807 0.692 3.201 2.958 -4.308
Mean 4.435 4.847 2.750 2.828 5.681 4.401
Maximum 9.051 17.370 5.337 5.976 22.489 12.132
Minimum 0.931 0.314 0.692 0.601 0.915 0.273
RMS 5.033 7.205 3.008 3.365 8.002 5.618
It is interesting that the best mean deviation which indicate the DEM-accuracy is achieved by TerraSAR-X data, while the worst is SRTM90. However, in all DEM there is extrem deviation, for instance 17.370 m in IFSAR DTM or 22.489 in SRTM. The extreme value found in the data SRTM90 Hambalang and Field Sempur, DEM RBI (Hambalang) and DTM (Sentul and Gunung Picung). The points of difference between the value has more than 10m with GPS measurement results, althoug the site of test points are normally flat enough. There are several factors that affect the accuracy of DEM, but in this discussion will be emphasized two things, the resolution and the shape of the earth's surface (which is represented in the tilt / slope).
Resolution is the main factor that makes precision SRTM90 and DEM RBI is relatively low. SRTM90 has a spatial resolution of 90m, while the RBI DEM about 100m. DEM RBI shaped contour with the method of interpolation triangulated Irregular Network (TIN), which is then converted to raster using tools TIN to Raster, so that the resulting resolution is the default of these tools.
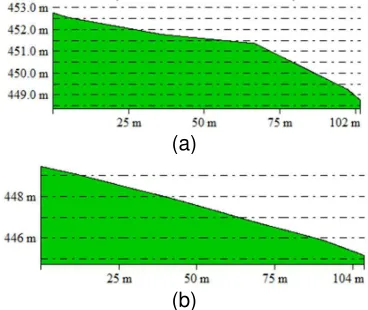
As described in Chapter 1, the difference in resolution makes topography at each DEM data is to be different. The higher the spatial resolution of a DEM data, then the profile will be more detailed represented, so the level of elevation error will be smaller. Here is a different profile of the topography in the area around the point Hambalang data TerraSAR-X, SRTM90, RBI DEM and DTM.
(a)
(b)
Fig 3. Difference of of DEM data from (a) SRTM90 (b) RBI Fourth profiles were taken on the same segment by segment length + 100m. It can be seen that the difference between TerraSAR-X profile with SRTM90 and DEM RBI so great, even if the SRTM90 and DEM RBI profile relative decline, in the TerraSAR-X profile tends to rise. The y-axis of the profile can also show the level of "error" and DEM SRTM90 RBI, where the maximum height of the TerraSAR-X on that profile only + 452m, whereas in SRTM90 achieve and DEM + 469m + 459m RBI reached.
(a)
(b)
Fig 4. Topographic profil on data (a) SRTM30, (b) DTM
ASTER GDEM and SRTM30 which has the same spatial resolution and the error rate is almost the same at that point has a height range which does not differ with TerraSAR-X. The maximum height of the ASTER GDEM is + 452 m, while SRTM30 is + 453 m. DTM from TerraSAR-X has a resolution of 10m, and a maximum height of the DTM is + 449 m. Those values are still relevant with regard to the resolution of the DEM used, with reference to the sample points that have relatively low accuracy and the topography is relatively high. Subsequent analysis is an analysis based on the height of the area. Value of the difference with a value of> 10m generated in the DTM (Sentul and Gunung Picung), SRTM90 (Hambalang and Field Sempur), and DEM RBI (Hambalang). Based on the height, just point Sempur Field which has an altitude below 300m, and a large difference can be caused by SRTM90 relatively low resolution. Based on this research, it was inferred that these parameters are still positively correlated with the basic concept, namely that the lower and the higher spatial resolution topography of an area of DEM data, the more imprecise the resulting vertical height.
4. CONCLUSSION
The results shown that DEM from TerraSAR-X and SRTM30 have the best quality. Based on this research, it was inferred that these parameters are still positively correlated with the basic concept, namely that the lower and the higher spatial resolution topography of an area of DEM data, the more imprecise the resulting vertical height.
ACKNOWLEDGEMENTS
The author will thanks to Agung, Danang, Irwan, and Dadan for the generous help in the GPS measurement and its processing, to Dr. Sri Hartini for the compilation, Dr. Ade Komara Mulyana for some idea and data set, and to Ms Niendyawaty in Center for Research, Promotion and Cooperation BIG for their financial and administrative support.
REFERENCES
Athmania, D., et al., (2014). External Validation of the ASTER GDEM2, GMTED2010 and CGIAR-CSI- SRTM v4.1 Free Access DEMs in Tunisia and Algeria. Remote Sensing. (www.mdpi.com/journal/remotesensing)
Forkuor, G.et al. (2012). Comparison of SRTM and ASTER Derived Digital Elevation Models over Two Regions in Ghana. Implications for Hydrological and Environmental Modeling. In Studies on Environmental and Applied Geomorphology; Piacentini, T., Ed.; InTech: Rijeka, Croatia; pp. 219–240. Gesch D., (2005). Vertical Accuracy of SRTM Data of the Accuracy of SRTM Data of the United States: Implications for Topographic Change Detection, SRTM Data Validation and Applications Workshop.
Hoja D. and d’Angelo P, (2010). Analysis Of DEM Combination Methods Using High Resolution Optical Stereo Imagery And Interferometric SAR Data, International Archives of the Photogrammetry, Remote Sensing and Spatial Information Science, Volume XXXVIII, Part 1, Calgary, Canada.
Li, P. et al., (2013). Evaluation of ASTER GDEM using GPS benchmarks and SRTM in China. International. Journal of Remote Sensing, 34, 1744–1771.
Li, Z., Zhu, Q., and Gold, C., (2005). Digital Terrain Modeling Principles & Methodology. CRC Press. Florida. USA. Mukherjee, S. et al., (2013). A. evaluation of vertical accuracy of open source Digital Elevation Model (DEM). International. Journal. Application. Earth Observation. Geoinformation. , 21, 205–217.
NASA, (2005). An Assessment of the SRTM Topographic Products. NASA. Amerika Serikat.
Petrie, G. and Kennie T., (1987). An introduction to terrain modeling: applications and terminology. Univ of Glasgow. Raggam, H., et al (2010). Accuracy Assessment of 3D Point Retrieval From Terrasar-X Data Sets. Proceeding of 8th European Conference On Synthetic Aperture Radar 2010 The International Archives of the Photogrammetry, Remote Sensing and Spatial Information Sciences, Volume XLI-B4, 2016