AN EXPERIMENTAL STUDY ON REGISTRATION THREE-DIMENSIONAL RANGE
IMAGES USING RANGE AND INTENSITY DATA
Cihan ALTUNTAS
Selcuk University, Engineering and Architectural Faculty, Geomatic Engineering, 42075, Selcuklu, Konya, Turkey
caltuntas@selcuk.edu.tr
KEY WORDS: Point cloud, Registration, Intensity image, Range image, Automation, Keypoint.
ABSTRACT:
Laser scanner is noncontact instrument to measurement of spatial data. It measures object surfaces as point series and visualize as point cloud. One of the important steps on processes of laser scanning data is the registration of point clouds relation to common coordinate system. Many interactive and automatic methods have been developed for point cloud registration so far. The automatic methods are applied with range data of laser scanner or image data of sensor combination camera. The registration by range data is mostly depend object geometry. If scan surface is deprived from geometrical details, conjugate points can not be found to compute registration parameters between point clouds. In that case, intensity data of laser points can be used for registration. In this study, intensity image was created from laser scanner data and the registration parameters were computed with keypoints extracted by SIFT method from these images. The results were also compared with the iterative closest point (ICP) method.
1 INTRODUCTION
Today many applications require three-dimensional (3D) modelling of object or scene. The latest method for 3D modelling is laser scanning and it has been widely used for documentation of cultural heritage, deformation measurement, reverse engineering, virtual reality, architectural planning and scene monitoring. Laser scanner is non contact instrument to measurement spatial data. In addition, intensity data backscattered laser beam from the scan point is recorded. Furthermore, color data (RGB) can be recoded via the image of integrated camera.
Many scanning are performed from different station to obtain occlusion free 3D object model. Laser scanner data (point cloud) is in local coordinate system centre of which is the laser scanner. In this case, all point clouds must be registered into common coordinate system to visualizing 3D model of the object. Generally first point cloud was selected as a reference and the others are registered into its coordinate system. Many methods have been developed for registration of point clouds. The most popular method is iterative closest point (ICP) method (Chen and Medioni, 1992; Besl and McKay, 1992). Another one is least square 3D image matching method (Guen and Akca, 2005). In addition, registration can be performed with object details extracted from point clouds (Deveau et al., 2004; Briese and Pfeifer, 2008). The registration methods of point clouds were investigated with details in Salvi et al. (2007).
The methods mentioned above needs initial registration parameters to perform. Thus automatic registration of point clouds has still been research area. The automatic methods are performed with coarse-to-fine strategy. Initially, coarse registration parameters have been computed by different methods and than fine registration is performed by ICP. Also, automatic methods were executed with range image of laser scanner data in literature. Range image and real camera image were evaluated by photogrammetric in Aquilera et al. (2009). Camera position was estimated relation to the laser scanner and image texture data was mapped with point cloud. In another study, range images were created from point clouds and
keypoints extracted by SIFT operator. The registration parameters were computed by laser coordinates of key points (Barnea and Filin, 2008; Körtgen 2007; Sharp, 2002). Bendels et al. (2004) was performed automatic multi-view registration with range and intensity image. Keypoints were extracted by SIFT (Lowe, 2003) method and laser coordinates of keypoints were computed. Then points were matched by RANSAC (Fischler and Bolles, 1981) and registration parameters were computed. In another study, range image was created from point cloud and object planar surface was extracted from point cloud. The registration parameters were computed by planar surfaces and range image (Dold and Brenner, 2004). But, object details can not be selected from them since the range image was created from spatial range data. Range image dose not include intensity backscattered laser beam from the scan points. The intensity data is represent brightening and color details of the surface. In this study, point clouds were registered by intensity image which was created from laser scanner data.
2. THE REGISTRATION METHOD
Laser scans have been made as overlapping beginning of the first point cloud. In that case, to combine all point clods, the registration must be performed relation to reference point clouds. The registration parameters have been computed by laser scanning points with different techniques in overlapping area. In this study, pair-wise registration was performed by intensity image created from laser scanner data. Keypoints from intensity images were extracted and matched by SIFT method. After outlier points were detected by statistical method, point cloud coordinates for each conjugate keypoints were determined using range image data. The registration parameters were computed with these corresponding points and residuals on SIFT points were computed. Then the results of the method were compared with the ICP.
2.1 Itensity and Range Image
Intensity and range image has two-dimensional (2D) which has the same view with laser scanner. In this image, 3D laser data is represented by two-dimensional image pixels. At first, image
115
marges are defined by min and max angles of point cloud data. The image width is limited by horizontal angle as min angle is right and max angle is left side. As a similar, the image height is limited by vertical angle as min angle is bottom and max angle is top side. Then the grid which is present the pixel of the intensity image is created within image limit. An each excel of the grid is pixel of the image and pixel size is described by the angle correspond to laser scanning point steps of the station. Pixel size angle is a function of mean scan distance and point steps (Eq.1). Nevertheless, because of the variable scan distance, pixel size angle must be select small from computed value. The pixels are colored by intensity and range data for intensity and range image respectively. In addition, pixel size angles and range data are also recorded into the file. Each laser scanning point is represented by one pixel on intensity image. If the pixel is not corresponded the laser point, its value is interpolated from near pixels. Grey tones of the range image are computed by range data. If the image is created as 8 bite, grey tones for min and max ranges will be lies between 0-255.
Pixel size angle=tan-1(laser point space/mean scan distance) (1)
2.2 Keypoint Detection
Many methods such as Haris, FAST, SUSAN, Forstner and SIFT have been used for keypoints detection (Jzayeri and Fraser, 2010). SIFT is extensively used for keypoint detection. Because it can detect keypoints even if scale, rotation and color are different between the images. For image matching, SIFT features are first extracted from reference image and stored in database. The new image is matched by comparing each feature from the new image to this previous database. The candidate matching features is found by Euclidean distance of their feature vector. In this study two intensity images have different scale, rotation and angle. However extracted keypoints include outlier points. This outlier points must be removed before estimation of the registration parameters.
Figure 1. Laser scanning
2.3 Outlier Detection
Point cloud coordinates of keypoints are computed by horizontal and vertical angle and range data recorded into the file of range image. After laser coordinates of keypoints were computed, the registration parameters between point clouds are computed by least four point selected by RANSAC (Fischler and Bolles, 1981) method. Then the second point cloud was
registered into the first point cloud with these parameters. Afterwards, residuals on keypoints are computed and the points which have the biggest residuals are eliminated. This computation is iterated until the biggest residual of coordinates will be small from inherent accuracy (8mm@100m for ILRIS 3D) of laser scanner (Kang, 2008).
Figure 2. Overlapping point clouds from two stations.
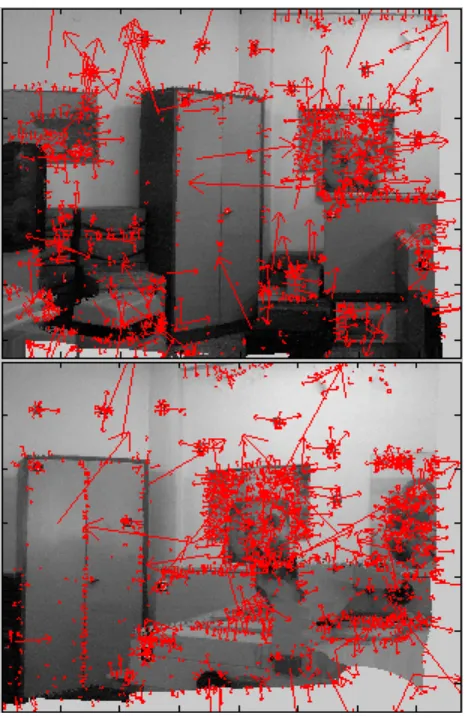
Figure 3. SIFT Keypoints with scale and rotations. 2121 and 3152 keypoints were extracted from intensity images of the first
and second point clouds respectively.
3. EXPERIMENT
Laser scannings were performed by ILRIS 3D laser scanner from two stations as overlapping in our photogrammetry laboratory (Figure 1). The range of laser scanning is about 6.5m and 5 m respectively. The surfaces were scanned 3mm point spaces and 411000 and 233000 points were collected from two
116
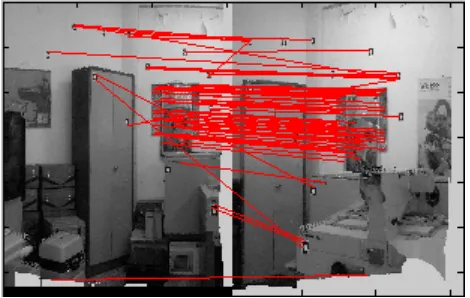
tations respectively (Figure 2). Two-dimensional intensity and range image was created for each scan. The pixel size angle which was correspond laser point spaces were computed 0.03 grad. The first intensity image has 1536x1260 pixels and the second has 1548x1300 pixels. The SIFT method was executed by Matlab code developed Lowe (2005). Respectively 2121 and 3152 keypoints were extracted from the intensity images (Figure 3) and 78 keypoints were matched (Figure 4).
After the compute laser coordinates of keypoints, the registration parameters between point clouds were computed with four points which were selected by RANSAC in Matlab program. The second point cloud was registered into the first point cloud with these registration parameters. Then residuals on keypoints were computed and keypoints which have the biggest residuals are eliminated. At last, 30 keypoints were remained which have small residual than 8mm (inherent accuracy is 8mm@100m). In addition, the registration was executed by ICP method and residuals are computed on 30 keypoints (Table 1).
Figure 4. Total 78 keypoints were matched by SIFT parameters.
Tablo 1: After the registration by ICP and intensity image methods, min and max residuals on keypoint coordinates
SIFT method is more appropriate method for keypoint extraction from like these images. Outlier detection can be performed different methods. In this study, threshold value for outlier detection may be change according to the laser instrument and expected precise. The results of the registration by intensity image are near the ICP method (Table 1). This method can be used for automatic registration of point clouds as independent object geometry. On the other hand, the method can be used to compute initial registration parameters for automatic registration. Matched keypoints are include a little false matched points. Therefore the registration parameters to perform ICP can be computed by keypoints without outlier detection.
5. CONCLUSION
In this study, pair-wise registration was performed by using intensity image. Keypoints were extracted by SIFT method and the registration parameters were computed laser coordinates of them. The registration is also performed by ICP and the coordinate residuals on keypoints were compared. As a consequence, the registration by intensity image gave near results with the ICP. Moreover, the method can be used for pair-wise automatic registration of point clouds.
ACKNOWLEDGEMENT
The author thanks to Prof. Norbert PFEIFER for valuable comments during study on Vienna University of Technology.
REFERENCES
Aquilera, D.G., Gonzalvez, P.R. and Lahoz, J.G., 2009. An automatic procedure for co-registration of terrestrial laser scanners and digital cameras, ISPRS Journal of
Photogrammetry and Remote Sensing, 64(2009), pp. 308-316.
Barnea, S., Filin, S., 2008. Keypoint based autonomous registration of terrestrial laser scanner point-clouds, ISPRS
Journal of Photogrammetry and Remote Sensing, 63 (2008), pp.
19-35.
Bendels, G.H., Degener, P., Wahl, R., Körtgen, M., Klein, R., 2004. Image-based registration of 3D-range data using feature surface elements, The 5th International Symposium on Virtual
Reality, Archeology and Cultural Heritage VAST (2004),
Oudenaarde, Belgium, pp. 115-124.
Besl, P.J., McKay, N.D., 1992. A method for registration of 3-D shapes, IEEE Transsactions on Pattern Analysis and Machine
Intelligence, 14(2), pp. 239-256.
Briese, C., Pfeifer, N., 2008. Line based reconstruction from terrestrial laser scanning data, Journal of Applied Geodesy, 2(2008), pp. 85-95.
Chen, Y., Medioni, G., 1992. Object modelling by registration of multiple range images, Image and Vision Computing, 10(3), pp. 145–155.
Deveau, M., Deseilligny, M.P., Paparoditis, N., Chen, X., 2004. Relative laser scanner and image pose estimation from points and segments, The International Archives of the
Photogrammetry, Remote Sensing and Spatial Information Sciences (IAPRS), 35(B/3), Istanbul, pp. 1130-1135.
Dold, C., Brenner, C., 2004. Automatic matching of terrestrial laser scan data as a basis fort he generation of detailed 3D city models. The International Archives of the Photogrammetry, Remote Sensing and Spatial Information Sciences (IAPRS), 35(B/3), Istanbul, 12-23 July, 2004, pp. 1091-1096.
Fischler, M.A., Bolles, R.C., 1981. Random sample consensus: A paradigm for model fitting with applications to image analysis and automated cartography, Communications
Association and Computing Machine, 24(6), pp. 381-395.
Gruen, A., Akca, D., 2005. Least squares 3D surface and curve matching, ISPRS Journal of Photogrammetry and Remote
Sensing, 59(2005), pp. 151-174.
117
Kang, Z., 2008. Automatic registration of terrestrial point cloud using panoramic reflectance images, The International Archives of the Photogrammetry, Remote Sensing and Spatial Information Sciences (IAPRS), 37(B/5), Beijing, pp. 431-35.
Körtgen, M., 2007. Robust automatic registration of range images with reflectance, Diplomarbeit, Vorgelegt am Institut für
Informatic, Rheinische Friedrich-Wilhelms Universitat Bonn,
89 pages.
Lowe, D., 2003. Distinctive image features from scale-invariant keypoints. International journal of Computer Vision, Vol.20, pp. 91-110.
Jzayeri, I., Fraser, C., 2010. Interest operators for feature-based matching in close range photogrammetry, The Photogrammetric
Record, 25(129), pp. 24-41.
Salvi, J., Matabosch, C., Fofi, D., Forest, J., 2007. A review of recent range image registration methods with accuracy evaluation, Image and Vision Computing, 25 (2007), pp. 578-596.
Sharp, G.C., Lee, S.W., Wehe, D.K., 2002. ICP registration using invariant features, IEEE Trans Saction on Pattern
Analysis and Machine Intelligence, 24(1), pp. 90-102.
Lowe, D., 2005. Demo Software: SIFT Keypoint Detector.
http://www.cs.ubc.ca/~lowe/keypoints/ (Accessed 20 May, 2011).
118