CASTLE3D - A COMPUTER AIDED SYSTEM FOR LABELLING ARCHAEOLOGICAL
EXCAVATIONS IN 3D
H. Houshiara,∗, D. Borrmanna, J. Elseberga, A. N¨uchtera, F. N¨athb, S. Winklerc
a
JuliusMaximiliansUniversit¨at W¨urzburg, Institut f¨ur Informatik VII, Am Hubland, Wrzburg 97074, Germany [email protected], [email protected]
[email protected], [email protected] b
denkmal3D GmbH und Co. KG, Windallee 2, Vechta 49377, Germany - [email protected] cdenkmalDaten KG, Eulerstrasse 7, Mnster 48155, Germany
Commission VI, WG VI/4
KEY WORDS:3D Laser Scanner, Archaeology, Semantic Mapping, 3D Point Cloud Processing
ABSTRACT:
Documentation of archaeological excavation sites with conventional methods and tools such as hand drawings, measuring tape and archaeological notes is time consuming. This process is prone to human errors and the quality of the documentation depends on the qualification of the archaeologist on site. Use of modern technology and methods in 3D surveying and 3D robotics facilitate and improve this process. Computer-aided systems and databases improve the documentation quality and increase the speed of data acquisition. 3D laser scanning is the state of the art in modelling archaeological excavation sites, historical sites and even entire cities or landscapes. Modern laser scanners are capable of data acquisition of up to 1 million points per second. This provides a very detailed 3D point cloud of the environment. 3D point clouds and 3D models of an excavation site provide a better representation of the environment for the archaeologist and for documentation. The point cloud can be used both for further studies on the excavation and for the presentation of results. This paper introduces a Computer aided system for labelling archaeological excavations in 3D (CASTLE3D). Consisting of a set of tools for recording and georeferencing the 3D data from an excavation site, CASTLE3D is a novel documentation approach in industrial archaeology. It provides a 2D and 3D visualisation of the data and an easy-to-use interface that enables the archaeologist to select regions of interest and to interact with the data in both representations. The 2D visualisation and a 3D orthogonal view of the data provide cuts of the environment that resemble the traditional hand drawings. The 3D perspective view gives a realistic view of the environment. CASTLE3D is designed as an easy-to-use on-site semantic mapping tool for archaeologists. Each project contains a predefined set of semantic information that can be used to label findings in the data. Multiple regions of interest can be joined under one label. Further information such as color, orientation and archaeological notes are added to the label to improve the documentation. The available 3D information allows for easy measurements in the data. The full 3D information of a region of interest can be segmented from the entire data. By joining this data from different georeferenced views the full 3D shape of findings is stored. All the generated documentation in CASTLE3D is exported to an XML format and serves as input for other systems and databases. Apart from presenting the functionalities of CASTLE3D we evaluate its documentation process in a sample project. For this purpose we export the data to the Adiuvabit database (http://adiuvabit.de) where more information is added for further analysis. The documentation process is compared to traditional documentation methods and it is shown how the automated system helps in accelerating the documentation process and decreases errors to a minimum.
1. INTRODUCTION
Archaeology is the study of history and the human activity in the past, through the analysis and recovery of their legacies and envi-ronmental data that they have left behind such as artefacts, archi-tecture, cultural landscapes, art, etc. In Germany every large scale construction project is prefaced by a series of inspections. These are performed to determine the possible existence of artefacts or other remains of cultural or historical significance. Archaeolo-gist accompany the building projects to prevent the destruction of archaeological sites. It is desirable to excavate efficiently to minimize the time and cost for the client. Therefore development of a framework such as our project comes into effect: an easy-to-use hardware and software system allows the digitisation of the excavation site with 3D laser scanner and generation of digital documentation of the excavation process. This will help archaeo-logical activities to be carried out more efficiently leading to cost saving results. After the completion of the excavation, collected data and documentation of the potential findings will be
evalu-∗Corresponding author.
ated and after analysis and post processing a report will be made available to the authorities.
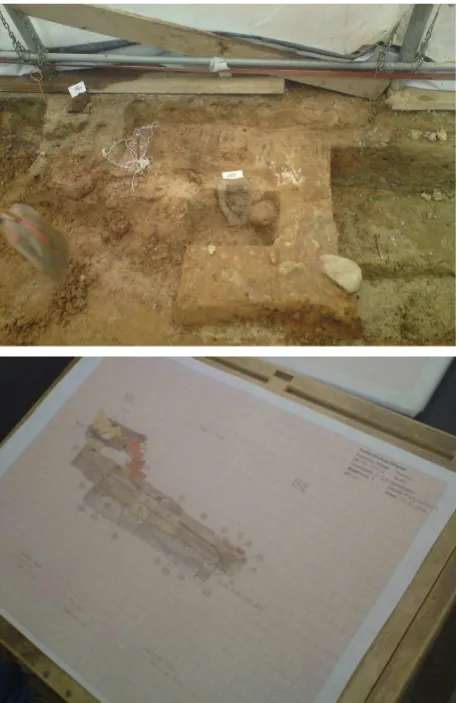
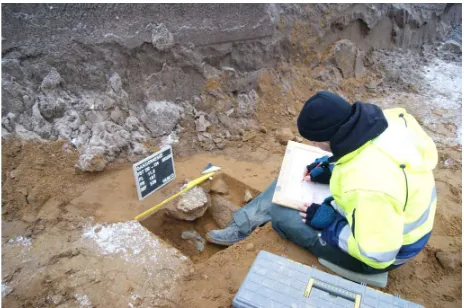
Figure 1: Top: An excavation site located at “Haus Kump”, a building from the 16th century, which is the oldest storage build-ing in M¨unster, Germany. Bottom: Findbuild-ings on a graph paper that were meticulously sketched by an archaeologist on site.
constraints. But, they create at the same time a large amount of data that is no longer subject to the evaluation judgment of the archaeologist. Automatic acquisition of data occurs even without interaction of the archaeologist. Photogrammetry, 3D laser scan-ners and electronic measuring devices are used in archaeology. However the data captured with cameras and 3D laser scanners from the excavation sites often only serve as a snapshots as as-build documentation and reference. (Campana and Remondino, 2007) remark in their publication that use of 3D digital documen-tation and represendocumen-tation in terms of scientific investigation is dis-appointing and that the use of such technologies is typically ori-ented to suggest final reconstructions and not to contribute to the scientific interpretation. 3D representations of environments, es-pecially excavation sites are becoming the standard for archaeol-ogist. 3D laser scanners are the standard instrument in the field of optical metrology. They measure the distance to a point on a sur-face around the scanner by sending a focused laser beam in that direction. The distance is calculated by measuring the time dif-ference of the emitted and reflected signals. Two different types of laser scanning technology have established themselves in this field. Pulsed laser range finders send a short pulse of light and directly measure the amount of time it takes for the laser pulse to travel from the scanner to the object and back to the scan-ner. The distance is then calculated via the speed of light. Since the speed of light is almost 300000 km/s, tools with picoseconds (10−12s) resolution need to be used in order to calculate the
dis-tance with an accuracy of 10 mm. Other than pulsed systems
there are laser scanners that continuously emit modulated laser light. The change of the phase between the emitted light and the received signal determines the light travel time. Since the phase shift in only one interval between 0 and2πis non ambiguous, the maximum range of these devices is inherently limited. Current phase-based laser scanners achieve a range of about 80-120 m whereas pulse-based laser scanners can measure distances up to several kilometers. However, since phase-based laser scanners emit light continuously they can operate at a higher measurement speed than pulsed systems. Besides the distance to objects, laser scanners determine the intensity of the reflected light. This yields information about the reflectivity of the scanned surface. Further combination of the Light Detection and Ranging (LiDAR) sys-tems with color cameras is possible.
This paper presents a framework with a set of software tools for archaeologist to digitise excavation sites and generate documen-tation on site. It is built based onThe 3D Toolkit (3DTK). 3D laser scans obtained by frequently scanning the archaeological site are georeferenced and efficiently visualised to the archaeologist on a tablet computer. Findings are marked on-site with a closed polygon and measurements are available for the digitised envi-ronment. These localised information and archaeological notes are send to an archaeological database for documentation and rea-soning. CAD (Computer Aided Design) models of the findings are available by exporting the polygon vertices of the findings. Post processing of the generated documentation on the database provides the Harris Matrix for constraint checking. Thus gen-erated documentation is suitable for publication. The paper is structured as follows. Section 2. reports on the state of the art in modern archaeology and the tools to assist archaeologist dur-ing excavation, documentation, study and analysis of excavation sites. Section 3. presents our framework to asset the archaeolog-ical team from excavation to publication of the documentation. It contains our Computer Aided System for Labelling Archae-ological Excavations in 3D (CASTLE3D). Section 4. presents CASTLE3D in detail including tools to import the captured data to the software and the visualisation tool in 2D and 3D. The soft-ware focusses on semantic mapping of the excavation. Section 5. presents a workflow of our framework on an excavation site in Germany and section 6. contains the concluding remarks.
2. RELATED WORK
reality engines. (Cosmas et al., 2001) introduce the ”3D Mea-surement and Virtual Reconstruction of Ancient Lost World of Europe” system (3D MURALE). This system consists of a set of tools for recording, reconstructing, encoding, visualising and database searching or querying. These tools are linked together by a common database. The database serves several purposes. It contains information about the pieces. It also serves as a repos-itory for archaeologist to help them to classify findings, to pre-pare restoration and to keep track of statistics. The database is a major gateway to the wider public and to other archaeologists. (Grabczewski et al., 2001) describe the 3D MURALE multimedia database system architecture. The goal of this system is to digi-tally record, store, restore and visualise archaeological findings. (Reu et al., 2014) suggest the use of image-based 3D modelling methods for the recording, documentation and visualisation of the excavated archaeologic heritage. It offers great possibilities for increasing the quality of the achieved archaeological exca-vation record. (Gilboa et al., 2013) report the development of a computerised automatic system to illustrate complex archaeo-logical objects based on 3D scans of the artefacts. 3D models can be automatically translated into 2D or 3D line drawings, into coloured images and to images to enhance the visualisation of the artefact. These methods are tended to replace traditional hand drawings which are very expensive to produce and not accurate enough. Their system uses 3D scans of archaeological artefacts in order to produce images that visualise them better than the 3D model themselves. (Kuzminsky and Gardiner, 2012) propose the use of 3D laser scanning which offers a sophisticated method of documenting and studying prehistoric human skeletons. A major benefit of laser scanners is that they offer a cost-effective method of creating a digital record of skeletal collections for museum archives. The 3D imaging methods are enabling scientists to ex-pand and improve their research. They present how advanced but affordable 3D scanners can be used for new research and aid in the documentation and preservation of the fragile skeletal mate-rial. (Karmacharya et al., 2008) suggest the use of a web platform based on knowledge management and semantic web technolo-gies. It is used to store the data during the excavation process and to manage the knowledge acquired during the identification pro-cess of findings. Since different technologies are being used dur-ing the excavation, different patterns of data are generated. One of the sources of data are the 3D point clouds obtained through the terrestrial laser scanning process. Point clouds, floor plans, images and archaeological notes are collected during the project for the creation of 3D object models. Non-academic archaeology generates a huge amount of data in a very short period of time. Thus, the collected data is stored in a repository. Once the data is stored, the process of identification of findings is carried out.
A lot of work has been done to use computer-aided systems to facilitate archaeological excavation processes. 3D laser scans are used in several projects for data representation as an snap-shot of the excavation. 3D models are generated to present the findings for museums. However, to the best of our knowledge no tools have been presented yet that allow archaeologists to use 3D laser scanners as main tool for documentation and to achieve more precise results in the same form as conventional methods in shorter time. In this paper we present an easy-to-use frame-work that combines several tools to assist the excavation process. We propose the use of 3D scans for documentation and semantic mapping of the excavation. To generate objective data for ar-chaeological teams for further studies and analysis. Our frame-work presents a frame-workflow that combines different systems such as a 3D laser scanner, a tool for marking and labelling findings, a database and provides an infrastructure for other tools to be in-cluded in the framework.
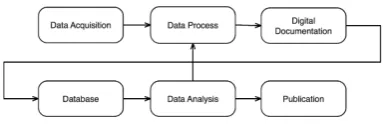
Figure 2: Framework Overview
3. FRAMEWORK
The advance in new technologies provides tools and methods to asset the archaeologist during the excavation process and to gen-erate an objective documentation of the excavation. Our goal is to present a framework that uses several components to achieve online semantic mapping of the excavation and to produce digital data and documentation from excavation sites (Fig 2). This data is used for further studies and analysis of the archaeological sites. The aim of this framework is to provide computer aided systems to substitute the conventional methods of the archaeological doc-umentation and analysis process. The docdoc-umentation of an exca-vation is a very important and time consuming task that requires an archaeologist on the excavation site. Conventional methods of documentation include hand drawings of findings and manual measurements of the objects with comprehensive archaeological notes. The quality of the gathered data depends to a great de-gree on the skills and expertise of the archaeologist on the site. Therefore these documents are prone to human error. Further-more managing and studying this inadequate data is a very dif-ficult process. Due to the essence of the excavation, providing new information and extending or modifying the documentation based on conventional methods are demanding tasks. New tech-nologies such as photogrammetry, 3D imaging and 3D laser scan-ning are vastly used in modern excavations to provide a snapshot of the excavation for publication purposes. However, the cap-tured data has hardly been used for the documentation or analysis process. Computer systems are used in modern archaeology, but mostly for saving the captured data and the generated documenta-tion in the database. In this framework we present a toolchain to help archaeologists to capture, generate, process, save, study and analyse the excavation site. This framework presents new ways of semantically mapping the excavation site. Moreover, it creates objective data and provides means for archaeologists to study and analyse an excavation based on their own knowledge. This will reduce the human inaccuracies and increase the efficiency and speed of the excavation. The framework presents the combina-tion of several tools and incorporates the idea of using computer aided systems in archaeology through a standard workflow. Fig-ure 2 shows the entire processing pipeline that is undertaken for an excavation. It starts with the data acquisition at the excava-tion site, goes through the processing and analysis and ends with the publication of the results. The individual components are ex-plained in more detail in the following. The idea of our frame-work is to create a standard for computer-aided archaeological documentation. Each tool in the chain is exchangeable to comply with the archaeologist’s needs and the available infrastructure.
3.1 Data Acquisition
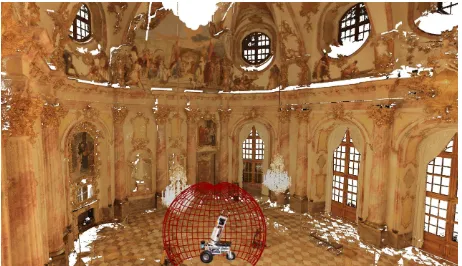
Figure 3: llustration of a 3D scan reconstruction of the imperial Hall of the W¨urzburg Residence. Data is captured by Irma3D with VZ-400 laser scanner by RIEGL Measurement GmbH. At-tached to the top of the scanner is a Canon 1000D DSLR camera. After a 3D scan has been acquired the camera is used to acquire color information for the point cloud.
expert to manually measure the findings and draw a scaled ver-sion of the finding on a paper. Advances in 3D laser scanning systems reduce the required time for capturing the data from an excavation site. 3D scans withdraw the human inaccuracies in drawings and provide realistic representation of the findings and the excavation site. Modern laser scanners are capable of captur-ing up to 1 million points per second. This provides a very de-tailed 3D point cloud of the environment. 3D points clouds and 3D models of an excavation site provide a better representation of the environment for the archaeologist and for documentation. 3D point clouds represent the environment in a spherical coordinate system. Measured points are represented by the polar coordinates and the measured range of the point. Modern scanners provide the reflected energy of the surface of the measured point. Combi-nation of 3D point clouds with color images will provide a colour-ful scans (Fig. 3). Using 3D scanners and cameras will provide more detailed information than the conventional hand drawings. Furthermore, utilizing these technologies will save time and cost by creating objective data from the excavation site.
3.2 Data Process
All the captured data in the form of the images and 3D point clouds are processed and categorised in different projects. Many scan formats from different laser scanners and different images can be combined into one project to provide more detailed infor-mation of the excavation. Captured data can be modified, e.g., by removing unnecessary parts of the 3D point cloud. This makes processing the data of a project easier and faster for adding doc-umentation and further studies. As shown in Figure 2 after data analysis, archaeologist are able to access the raw data to check the analysis or to modify the project for further study based on the new entry of data.
3.3 Digital Documentation
Rapid growth of technology makes it possible to produce huge amounts of data in a short period of time. The primary motiva-tion of computer aided systems for archaeology is to produce new ways of recording, cataloging, encoding and visualising archaeo-logical artefacts and monuments. 3D technologies have produced portable and fast systems to record large amounts of precise 3D data efficiently. These systems are used to visualise the data that has been acquired from excavation sites. Captured data from the excavation site are used for digital documentation of the excava-tion. This is used to substitute the conventional methods of docu-mentation. Computer aided systems will provide tools for
archae-ologist to visualise the captured data in 3D on site. They provide simple tools for measurement, region of interest selection, adding labels, adding notes and georeferencing. In this paper we propose the use of CASTLE3D (Computer aided system for labelling ar-chaeological excavations in 3D) for on site semantic mapping and gathering digital documentation of the excavation sites. This sys-tem will improve the documentation process with the possibility of accessing the original data at all times. Archaeologist are able to add or modify the documentation based on their knowledge and understanding of the excavation. Digital documentation in-creases the speed of the documentation process. This provides the possibility for sharing and collaboration between archaeologists.
3.4 Database
Huge amounts of data are produced in a short period of time on excavation sites. Therefore management of data has become problematic with conventional methods. The conventional meth-ods of data storage and cataloguing simply cannot coupe with the amount and speed of data generation. Data management is widely used in archaeological projects to store and retrieve generated in-formation during and after an excavation. In this framework we use the database Adiuvabit (denkmalDaten Winkler KG, 2008) as back end of the framework. The aim of the framework is to provide seamless connection between the digital documentation process and the database. The use of a standard XML schema to transfer the data from the documentation process to the database makes the framework modular. Therefore it is possible to substi-tute the database with the existing database of any archaeological project.
3.5 Data Analysis
An essential task after the excavation is to analyse and study the captured data. This will produce knowledge about the environ-ment and the era of the excavation site. Computer Aided Models are used to study the stratigraphy of the excavation. CAD models are used to generate 3D models of the excavation sites. These models represent the excavated findings and sites in their original structure. These can reveal the purpose and functionality of the findings. Moreover, regular, e.g., daily scans of the excavation site enable the compilation of the Harris matrix. This matrix can be generated automatically or semi-automatically with the help of an archaeologist. Our framework provides a tool for the com-pilation of the matrix as it uses the database Adiuvabit (denkmal-Daten Winkler KG, 2008) as back end. Moreover, the matrix can be generated after the excavation from the original data. This im-proves the objectivity of the analysis of the findings. Excavation sites can be studied by the archaeology community and they can compile a new Harris matrix based on their understanding from the original scans.
3.6 Publication
Importing Data
2D/3D Segmentation of the Region of Interest 2D/3D polygon as Region
of Interest 2D/3D Visualisation
- Octree for Point Clouds - Panorama images - Region of Interest Selection
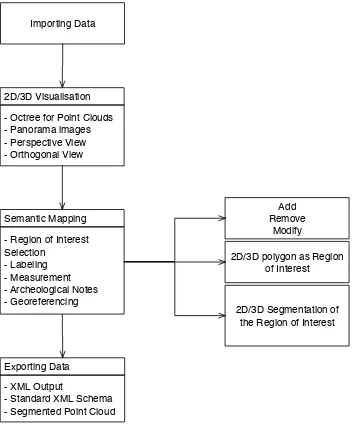
The primary motivation of computer aided systems in archae-ology is to produce new ways of recording, cataloging, encod-ing and visualisencod-ing archaeological artefacts and monuments. 3D technologies have produced portable and fast systems to record large amounts of precise 3D data efficiently. Digital documen-tation is the most important part within the proposed framework for which no satisfactory solution has been presented yet. For this purpose we developed the CASTLE3D (Computer aided system for labelling archaeological excavations in 3D) software to create digital documentation of the excavation site. Figure 4 presents an overview of the CASTLE3D. The software provides an easy to use set of tools for archaeologists to import the captured data from an excavation directly from the scanner to the software. The visualisation tool provides different views of the point cloud. The on site semantic mapping is available to archaeologist to generate documentation of the excavation on site. All the generated data in the CASTLE3D can be exported for further study and analysis.
4.1 Importing Data
CASTLE3D provides a tool to import point clouds. It uses the internal data structure for visualisation. Therefore, different for-mats of point clouds are converted into the internal data struc-ture by the system. Scanners have different methods to represent the reflected value from the measured points. CASTLE3D pro-vides different normalisation methods for generic visualisation of different scan formats. It supports many different scan for-mats, amongst them the file formats from known laser scanner producers such as Riegl (rxp) and Faro (fls), or standard ASCII file formats (xyz). This tool supports scans with reflectance and color information with different scales. Normalisation, scan scale and the point values are selected during the import process and the scan information is saved in the project. Imported scans are available for visualisation and semantic mapping.
4.2 Visualisation
Recently (Elseberg et al., 2013) introduced a data structure to improve the visualisation of point clouds with millions of point.
Figure 5: Visualisation of a 3D point cloud
Figure 6: Top: Panorama image of an excavation site. Middle: Panorama image in eqirectangular prjection. Bottom: Panorama image composed of 3 Pannini projections.
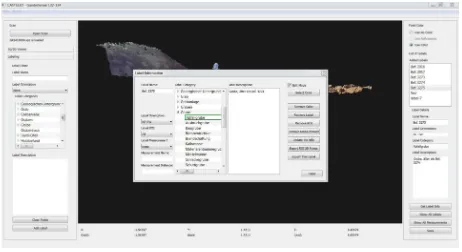
4.3 Semantic Mapping
Currently, archaeological observations are recorded on-site using conventional methods (cf. Fig. 7). The outlines of findings are drawn on graph paper with detailed information based on sub-jective understanding of the findings. Images, floor plans and other data such as archaeological notes are collected during the project. These data are of great value in the analysis of archaeo-logical findings in any project. 3D data acquisition and computer aided systems will facilitate this process and they are less prone to human error. In CASTLE3D a series of labelling tools assists
Figure 7: Conventional methods to record excavation sites in-clude, hand drawings, manual measurement and archaeological notes.
archaeologists in documenting their findings on-site for further inspections. These tools facilitate the creation of several labels on visualised data by selecting regions of interest. Afterwards, selected regions are available as polygons in both 2D and 3D rep-resentations of the scan (see Figure 8).
A series of predefined categories are available for semantic map-ping of the label. These categories are included in each project during the creation process as an XML file. The categories are modified for each project to contain the required level of informa-tion for the excavainforma-tion. Addiinforma-tionally, these regions of interest can be segmented from the rest of the point cloud. The segmented region will represent findings, such as monuments, buildings, stones, and other structures. Figure 6 (top) illustrates a panorama image with a marked region of interest presented in the 2D viewer
Figure 8: 3D presentation of a selected region of interest in a point cloud.
of the CASTLE3D software. Moreover, the measurement tool is used to add more data for each label. This is more precise than the conventional methods of adding manual measurements of the findings to archaeological notes. Additional notes can be added to each label. The orientation of the findings provides more infor-mation for each label. Georeferencing methods are available to transform the point cloud into the global coordinate system. This computer system facilitates the identification process of the find-ings on-site. It also provides feasible tools to study and observe the excavation site and findings both for the archaeologist on the site and for the public.
4.4 Exporting Data
Documentation is essential to archaeological analysis. There-fore, it is crucial to have a proper amount of documentation for each finding. This data is based on the archaeologists under-standing and experience. Since the data has been acquired by terrestrial laser scanners and represented by computer aided sys-tems, they can be studied in the archaeology community. The data can be used for further studies, catalogues, archaeological databases, and archaeological data management systems. We of-fer an Extensible Markup Language (XML) file format to ex-port the data and documentation of findings. This is essential for multi-platform communication. The XML file can be easily imported into other softwares. In our framework we transfer the data to an Adiuvabit database. Further documentation is included in the database for each finding. Analysis and publication of data is carried out based on the database. In addition to the XML file for transferring the documentation, georeferencing informa-tion, selected region of interest and measurement informainforma-tion, segmentation of findings are available. This produces small point clouds containing only the findings.
5. EXPERIMENTS AND RESULTS
Figure 9: Aerial view of the excavation site in Ganderkesse, Ger-many.
Figure 10: Numbered potential finding are cleaned for further inspection.
are captured for visualisation purposes. Afterwards the cutting direction of the profile is determined with at least two nails and the limits of the findings are marked. A database record with an initial description is generated. The marked limits and cutting di-rections are measured with a tachymeter or a GPS. The profile is created on the measured records by removing a vertical box of soil in longitudinal direction of the marked cutting nails. After-wards the front half of the profile is removed to salvage the find-ings (Fig. 11). Profiles with archaeological artefacts are prepared for further documentation by an archaeologist. The conventional documentation of the profile consist of image acquisition from the numbered profiles, scaled hand drawings, manual measure-ments and archaeological notes. Some archaeological projects contain a database and the excavation team transfers all the docu-mentation from the site to the database. However, this process is insufficient and time consuming. It takes days for archaeologist to combine all the gathered data and to transfer it to the database. With the use of our framework this could be reduced to hours of work. Our framework provides tools and computer aided sys-tems to improve and accelerate this process. In our framework the excavation process continues to salvage the rest of the profile and prepare findings for 3D scan acquisition. After the data ac-quisition process scans are imported into suitable projects. Visu-alised scans form the basis for interactive tools for archaeologist to mark the findings simply by selecting a polygon containing the finding. The selected regions of interest are labeled and ad-ditional documentation, orientation and accurate measurements are included in the CASTLE3D project (Fig. 13). The archaeolo-gist exports the generated data from CASTLE3D into the existing Adiuvabit database for the project. Database records are
gener-Figure 11: Profile view of a potential finding on Ganderkesse excavation site in Germany.
Figure 12: Generated record for a finding in Adiuvabit database.
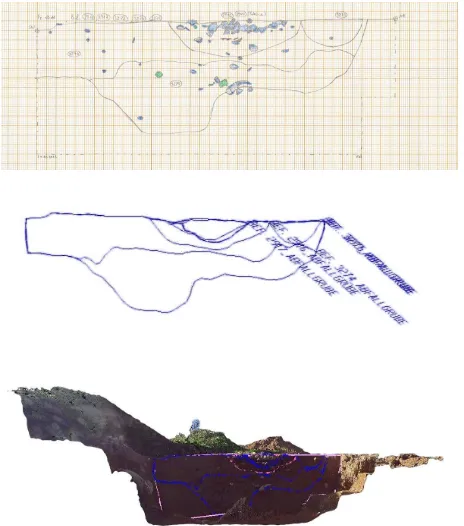
ated or merged automatically for the marked findings (Fig. 12). Profile views of the selected regions of interest are generated from the database. Our framework provides a comparable view to the conventional hand drawings of the findings (cf. Fig. 14). Addi-tionally, 3D point clouds, 2D images, segmented findings and all the extra documentation provide higher quality of the representa-tion of the excavarepresenta-tion. This will improve the documentarepresenta-tion and reduces the required time for data generation and organisation. The available multimodal representation of the data in our frame-work facilitates the analysis of the findings. Further studies are carried out on the gathered documentation and results are pub-lished. The digital nature of our framework makes the analysis and the original data available instantly to other archaeologist for further study.
Figure 14: Top: Conventional hand drawing presentation of the excavation. Middle: 2D CAD model of the excavation based on the digital documentation. Bottom: Marked region of interest on a 3D point cloud of an excavation.
6. CONCLUSIONS
In this paper we present a framework to improve the process of archaeological excavation and documentation. The aim of this framework is to assist the archaeologist on excavation and to substitute the conventional methods of documentation. The generated data in this framework combines 2D images, 3D point clouds, archaeological notes and CAD models to present the ex-cavation. A huge amount of data is generated in a very short period of time. We present a set of hardware and software to facilitate the data acquisition of the archaeological excavation. CASTLE3D (A Computer aided system for labelling archaeo-logical excavations in 3D) is a novel tool for digital documen-tation. In combination with Adiuvabit as the back end database of the framework. It is used to execute the workflow of the frame-work. The generated data in CASTLE3D is exported with stan-dard XML format to the data base. We show that with this com-bination in a case study at a sample excavation site we are able to create similar documentation results as with conventional meth-ods but more efficiently and with higher quality. The availabil-ity of the original data helps to achieve objective integravailabil-ity even with destructive methods as new studies and analysis can be car-ried out over the data. The achievement in technology provides tools from several disciplines such as, surveying, computer sci-ence, laser scanning, 3D modelling to assist archaeologists dur-ing an excavation. We plan to perform a more extensive study of the presented framework for several excavation sites with vary-ing experts on site for further evaluation of the framework and the presented components.
ACKNOWLEDGEMENTS
This work was funded by the project ”Fortlaufende semantische 3D-Kartierung von arch¨aologischen Ausgrabungsst¨atten” by the German Federal Ministry of Economics and Technology by a
Central Innovation Program (ZIM; No. KF24700098HM2) due to a resolution of the German Bundestag.
REFERENCES
Apollonio, F. I., Gaiani, M. and Benedetti, B., 2012. 3d reality-based artefact models for the management of archaeological sites using 3d gis: a framework starting from the case study of the pompeii archaeological area. In: Journal of Archaeological Sci-ence, Vol. 39number 5, pp. 1271–1287.
Campana, S. and Remondino, F., 2007. Fast and detailed digi-tal documentation of archaeological excavations and heritage ar-tifacts. In: Proceedings of 35th CAA Conference (Computer Applications and Quantitative Methods in Archaeology), Berlin, Germany, pp. 36–42.
Cosmas, J., Itagaki, T., Green, D., Grabczewski, E., Weimer, F., Gool, L. J. V., Zalesny, A., Vanrintel, D., Leberl, F., Grabner, M., Schindler, K., Karner, K. F., Gervautz, M., Hynst, S., Waelkens, M., Pollefeys, M., DeGeest, R., Sablatnig, R. and Kampel, M., 2001. 3D murale: A multimedia system for archaeology. In: Virtual Reality, Archeology, and Cultural Heritage, pp. 297–306.
denkmalDaten Winkler KG, 2008. Adiuvabit. http://www.adiuvabit.de.
Elseberg, J., Borrmann, D. and N¨uchter, A., 2013. One billion points in the cloud – an octree for efficient processing of 3D laser scans. ISPRS Journal of Photogrammetry and Remote Sensing (JPRS) 76, pp. 76–88.
Gilboa, A., Tal, A., Shimshoni, I. and Kolomenkin, M., 2013. Computer-based, automatic recording and illustration of complex archaeological artifacts. In: Journal of Archaeological Science, Vol. 40number 2, pp. 793–1448.
Grabczewski, E., Cosmas, J., Santen, P. V., Green, D., Itagaki, T. and Weimer, F., 2001. 3D murale: multimedia database sys-tem architecture. In: Virtual Reality, Archeology, and Cultural Heritage, pp. 315–322.
Karmacharya, A., Cruz, C., Marzani, F. and Boochs, F., 2008. Industrial archaeology: Case study of knowledge management for spatial data of findings. In: 5th International Conference on Adaptive Hypermedia and Adaptive Web-Based Systems.
Katsianis, M., Tsipidis, S., Kotsakis, K. and Kousoulakou, A., 2008. A 3d digital workflow for archaeological intra-site research using gis. In: Journal of Archaeological Science, Vol. 35num-ber 3, pp. 655–667.
Kuzminsky, S. C. and Gardiner, M. S., 2012. Three-dimensional laser scanning: potential uses for museum conservation and scientific research. In: Journal of Archaeological Science, Vol. 39number 8, pp. 2744–2751.
Reu, J. D., Smedt, P. D., Herremans, D., Meirvenne, M. V., Laloo, P. and Clercq, W. D., 2014. On introducing an image-based 3d re-construction method in archaeological excavation practice. Jour-nal of Archaeological Science 41(0), pp. 251 – 262.
Rua, H. and Alvito, P., 2011. Living the past: 3d models, vir-tual reality and game engines as tools for supporting archaeology and the reconstruction of cultural heritage e the case-study of the roman villa of casal de freiria. In: Journal of Archaeological Sci-ence, Vol. 38number 12, pp. 3296–3308.