www.elsevier.comrlocateratmos
The effect of clouds on aerosol growth in the rural
atmosphere
Colin D. O’Dowd
a,b,), Jason A. Lowe
a, Michael H. Smith
aa
Centre for Marine and Atmospheric Sciences, UniÕersity of Sunderland, Benedict Building, St. Georges Way, Sunderland SR2 7BW, UK
b
Department of Physics, P.O. Box 9, FIN-00014 UniÕersity of Helsinki, Helsinki, Finland
Received 27 January 2000; received in revised form 14 March 2000; accepted 16 March 2000
Abstract
Measurements of accumulation mode aerosol in the atmospheric boundary layer under cloudy and cloud-free conditions, and in the lower free troposphere under cloud-free conditions, were conducted over the rural northwest of England. Normalised size distributions in the cloud-free
Ž . Ž .
boundary layer CFBL and the cloud-free free troposphere CFFT exhibited almost identical spectral similarities with both size distributions possessing a concentration peak mode-radius of
f0.05 mm or less. By comparison, aerosol distributions observed in cloudy air exhibited a distinctive log-normal distribution with mode-radii occurring at f0.1 mm concomitant with a local minimum at f0.05 mm. The consistent and noticeable difference in spectral features observed between cloudy and cloud-free conditions suggest that a greater amount of gas-to-par-ticle conversion occurs on cloudy days, presumably through in-cloud aqueous phase oxidation processes, leading to larger sized accumulation mode particles. Apart from the distinct difference between cloudy and cloud-free aerosol spectra on cloudy days, aerosol concentration and mass were observed to be significantly enhanced above that of the ambient background in the vicinity of clouds. Volatility analysis during one case of cloud processing indicated an increase in the relative contribution of aerosol mass volatile at temperatures characteristic of sulphuric acid, along
Ž .
with a smaller fraction of more volatile material possibly nitric acid andror organic aerosol . Growth-law analysis of possible growth mechanisms point to aqueous phase oxidation of aerosol precursors in cloud droplets as being the only feasible mechanism capable of producing the
Ž .
observed growth. The effect of cloud processing is to alter the cloud condensation nuclei CCN
)Corresponding author. Tel.:q358-9-191-8365; fax:q358-9-191-8318.
Ž .
E-mail address: [email protected] C.D. O’Dowd .
0169-8095r00r$ - see front matterq2000 Elsevier Science B.V. All rights reserved. Ž .
supersaturation spectrum in a manner which increases the availability of CCN at lower cloud supersaturations.q2000 Elsevier Science B.V. All rights reserved.
Keywords: Aerosol particles; Aerosol growth; Cloud processing
1. Introduction
The optical properties of clouds, critical to planetary albedo, are partly determined by
Ž . Ž .
the cloud condensation nuclei CCN distribution on which they form Twomey, 1974 . The CCN distribution is a subset of the aerosol distribution which ranges from 0.001 to over 100 mm. Aerosols, which are effective as CCN, must be small enough to mix
Ž .
vertically to cloud condensation level typically a few hundred to a thousand metres and large enough to be activated at supersaturations typically encountered in the atmospheric
Ž .
boundary layer -1% . Furthermore, the aerosol generally contains some soluble aerosol species. Convective clouds such as cumulus clouds generally possess peak supersaturations of around 0.5% or greater and, thus, can activate aerosol )0.02 mm radius, while peak supersaturations reached in stratiform clouds are of the order of 0.1–0.2%, typically activating aerosol of around 0.05mm and larger.
The sub-micron atmospheric aerosol size distribution is multi-modal in shape, reflecting the different formation and loss mechanisms, and typically possesses an
Ž . Ž .
accumulation mode 0.05–0.2 mm radius , an Aitken mode 0.02–0.4 mm with a minimum at around 0.04–0.05 mm, and a nucleation mode with radii -5–10 nm
ŽO’Dowd et al., 1993, 1998; Quinn et al, 1993; Makela et al., 1997 . The nucleation
¨
¨
.mode is infrequently observed and is indicative of recent homogeneous nucleation events forming new particles directly from the gas phase. The Aitken mode is always observed and is thought to result from condensation of precursor gases and the
Ž .
coagulation of recently formed ultra-fine particles Raes and Van Dingenen, 1992 , while the accumulation mode is generally observed in the presence of cloud fields or after cloud evaporation.
Although aerosols are known to strongly influence cloud micro-physics, clouds are also thought to play an important role in shaping the aerosol size distribution due to chemical and physical interactions. When CCN are activated into cloud droplets, physical properties are altered through increases in surface area resulting in enhanced scavenging of trace gases, and their chemical properties are altered through rapid changes in pH and ionic composition resulting from oxidation of dissolved species
ŽSeinfeld and Pandis, 1998; O’Dowd et al., 2000 . Both of these processes result in an.
increasing in mean mass. Chemical processing, as opposed to the aforementioned physical processing of the aerosol, results in the addition of aerosol mass through aqueous phase oxidation processes, which tend to increase the size of activated nuclei while maintaining the concentration constant. The primary composition of the activated nuclei is thought to be predominantly nss-sulphate aerosol in both the marine and continental environment; however, nitrate, organic and sea-salt nuclei are also found to
Ž
contribute to CCN composition Hegg and Hobbs, 1982; Leaitch, 1996; Leaitch et al.,
.
1986; Noone et al., 1996 . The much reduced solute concentrations in cloud droplets provides a suitable environment for rapid oxidation of dissolved soluble precursors, such as SO2 scavenged from the gas phase, by H O2 2 or O3 depending on droplet pH
ŽSeinfeld and Pandis, 1998 .. Ž .
Hoppel et al. 1986 suggested that the minimum in the size distribution separating the Aitken and accumulation modes resulted from chemical processing of activated nuclei in non-precipitating clouds. This minimum results from in-cloud scavenging and activation of aerosol, around 0.03–0.05mm and larger, into cloud droplets where they accumulate extra mass through cloud-chemistry oxidation and consequently, grow into accumulation mode aerosol, thus leaving a deficit of aerosol in the 0.03–0.05mm size
Ž .
range. Hegg 1992 also postulated that, at least in the marine environment, CCN activated in stratiform cloud cannot be formed without first being activated in cumulus clouds where they grow to sizes readily activated by the lower supersaturation found in stratiform clouds.
Ž . Ž . Ž .
Measurements by Radke and Hobbs 1969 , Dinger et al. 1970 , Hobbs 1971 indicated that CCN concentrations active at a given supersaturation are often higher in air that has been cycled through clouds than in the ambient air and that additional
Ž .
sulphate mass was produced during this type of cloud cycling. Hegg and Hobbs 1982 found that although the amount of sulphate produced by cloud cycling was quite variable, it could be as high as 10.9mg my3. Average values were found to range from
0.9mg my3 in the Pacific Northwest coast to 2.84mg my3 in the mid-Atlantic coast of
the US — the difference presumed to be due to the background levels of pollution.
Ž .
Hegg 1985 concluded that the conversion of SO to aerosol sulphate in the troposphere2
as a whole was dominated by the in-cloud heterogeneous conversion mechanism with as much as 10–15 times more SO oxidised in this manner compared with homogeneous2
Ž
gas-phase oxidation which provides the material for new particle formation and
.
condensation growth . In a similar manner, a large fraction of nitrate aerosol is also produced by cycling of aerosol through clouds with values ranging from 0.06 mg my3
y3 Ž
in the clean Pacific Northwest to 2.9mg m in the polluted East coast US Hegg and
. Ž .
Hobbs, 1988 . Leaitch et al. 1986 found strong evidence for aerosol nitrate production in cloud, however, knowledge of the mechanisms for nitrate production is rather more limited than that of sulphate production.
We present further evidence of the growth of accumulation mode aerosol after passage through cloud during two intensive campaigns conducted over the rural north-west of England. The primary objectives of these campaigns were to examine the vertical structure of aerosol and it’s relationship to boundary layer thermodynamics, the
Ž .
with aerosol properties in the vicinity of clouds. An examination of possible aerosol-growth mechanisms is also presented.
2. Experimental
The UMIST Cessna 184, modified for atmospheric research studies, was fitted with a
Ž .
Particle Measuring Systems PMS ASASP-X and FSSP-100 optical particle counters to examine atmospheric aerosol concentrations and size distributions. The ASASP-X measures the accumulation mode aerosol size distribution from 0.05mm radius up to 1.5
mm. The FSSP was configured for in situ sampling of coarse mode aerosol ranging from 0.25 to 8 mm. To examine aerosol volatility and, thus, infer chemical composition, a thermal analytical volatility system was also installed which comprised four heater tubes set to specific temperatures to volatilise common aerosol species. The four heater tubes were configured to temperatures of 408C, 808C, 1508C and 3408C. Aerosol measured at 408C is considered a dry aerosol and is therefore independent of relative humidity
Ž .
changes O’Dowd et al., 1993 . The loss of aerosol between 408C and 808C is thought to correspond to loss of low volatility aerosol such as nitric acid andror light organic aerosol, while the loss between 808C and 1508C corresponds to the loss of sulphuric acid. Ammonium sulphate volatilises at 2008C and therefore is determined by the loss of mass and concentration between 1508C and 3508C. The residual aerosol remaining at
Ž
3508C is normally soot carbon in polluted and non-marine air masses Jennings et al.,
.
1994; Smith and O’Dowd, 1996 . For a more detailed explanation of the volatility
Ž .
technique, the readers are referred to O’Dowd and Smith 1993 . The aerosol measured by the ASASP-X was sampled from an intake duct channelling air into the fuselage where it could be selected for direct sampling or volatility analysis. Particle losses were calculated to be negligible for direct sampling and comparison between the direct and volatility sampling indicated approximately 10% loss in the volatility system for sizes
Ž .
larger than 0.5mm O’Dowd and Smith, 1996 .
The observations reported here were taken in the vicinity of Carlisle in the northwest
Ž .
of England 54.38N 2.78W and the Eden Valley about 200 km south of Carlisle. Meteorological conditions during the two projects, Winter and Summer, were charac-terised by persistent high-pressure systems. During the Winter project, the centre of the high pressure was a few tens of kilometres to the west of our sampling area at the beginning of the week, however, later in the week the centre strengthened and moved towards central Europe. Two high-pressure systems straddled the UK during the duration of the Summer project.
3. Results
3.1. General cloudy and cloud-free aerosol spectral characteristics
different thermodynamic situations. Flights were conducted under cloudy and cloud-free conditions and the variation in size distributions encountered under different
meteorolog-Ž .
ical conditions is summarised in detail by O’Dowd and Smith 1996 . In summary, they found that the aerosol size distributions on cloudy days were observed to be substan-tially different from those on cloud-free days, and also substansubstan-tially different to that
Ž .
observed in the cloud-free free troposphere CFFT . Aerosol size distributions in a
Ž .
cloudy boundary layer CBL were typically biased towards larger sizes when compared
Ž .
with those in a cloud-free boundary layer CFBL , and thus, possessed greater mass. Accumulation mode mode-radii on cloudy days were typically 0.1 mm or greater compared with a mode-radius of f0.05 mm or less under cloud-free conditions. The larger mode-radii associated with the accumulation mode aerosol when clouds are present suggest that the clouds may provide an effective growth medium to produce particles of this size. Furthermore, in a CBL, aerosol sampled in the vicinity of clouds exhibited greater number and mass concentrations compared with the general back-ground aerosol, further suggesting that the presence of clouds can enhance particulate mass. However, when air, which had recently encountered clouds had advected over strong pollution sources, the minimum in the distribution at 0.05mm disappeared. In this study, we focus on the difference between background rural aerosol spectral differences under conditions when clouds were present and when no clouds were present.
The difference between cloudy and cloud-free size distributions observed by O’Dowd
Ž .
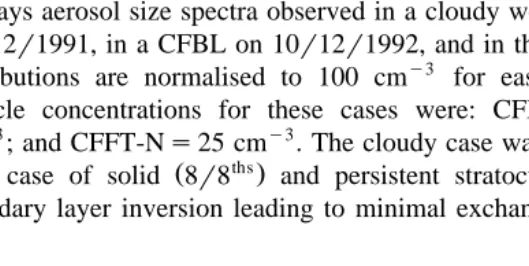
and Smith 1996 can be best illustrated in Fig. 1a using three typical examples which represent general characteristics observed under these different conditions. Fig. 1a
Ž .
displays aerosol size spectra observed in a cloudy well-mixed boundary layer CBL on 06r12r1991, in a CFBL on 10r12r1992, and in the CFFT on 06r12r1991. The size distributions are normalised to 100 cmy3 for ease of spectral comparison. Actual
particle concentrations for these cases were: CFBL-Ns404 cmy3; CBL-Ns290
cmy3; and CFFT-Ns25 cmy3. The cloudy case was chosen because it represented the
Ž ths.
only case of solid 8r8 and persistent stratocumulus cloud cover and a strong boundary layer inversion leading to minimal exchange with the free troposphere while
Ž . Ž . y3
the CFBL case was chosen because it had the least previous contact with clouds. The CFFT case is chosen simply as a typical example of CFFT spectral shape as seen in all
Ž .
flights during the campaigns O’Dowd and Smith, 1996 .
Both in the free troposphere, where clouds are rarely observed under subsiding conditions, and in the cloud-free boundary, aerosol layer spectra exhibit remarkable similarities with the peak in aerosol concentration occurring at sizes less than 0.08mm. Although the measurements of the size distributions were limited by the 0.05mm cut-off of the instrument, the data suggest a size distribution mode-radius of around 0.05mm or less. The spectral shape of the CFFT size distribution is very similar to that observed by
Ž .
Hoppel et al. 1994 who reported mono-modal size distributions above cloud tops in both continental and marine air in which marine stratocumulus was formed.
By comparison, the aerosol size distribution observed in the CBL possess a much higher mode-radius, typically greater than 0.1mm. This typical CBL distribution is also
Ž .
very similar in spectral shape to that observed by Hoppel et al. 1994 who consistently observed an accumulation mode with mode-radius of approximately 0.1 mm concomi-tant with a local minimum in the distribution at approximately 0.05mm. The recurrent difference between the cloudy and cloud-free aerosol spectra suggest that the high mode-radius associated with the aerosol distribution on cloudy days results from cloud-induced aerosol growth.
Accumulation mode aerosol typically has a lifetime of a few days, therefore, it is likely that along with newly formed aerosols which had not encountered cloud, the CFBL comprises some residual fraction of aerosol which has already undergone some degree of previous cloud processing. This is suggested by the relative ‘bump’ in the CFBL distribution at sizes greater than 0.1 mm when compared with the CFFT distribution. Volatility analysis indicate that this ‘bump’ is not due to surface-derived crustal material and is volatile at temperatures characteristic of nss-sulphate aerosol.
Ž .
When the volumetric normalised spectra are examined Fig. 1b , it is clear that the CBL distribution possesses a much greater relative volume with a volumetric mode-radius of
f0.14 mm and a normalised distribution peak of f2.5 mm3 cmy3 compared with
f0.1 mm and f0.7 mm3 cmy3, respectively for the free tropospheric aerosol. The
CFBL aerosol possesses volumetric spectral features characteristic of both CBL and free troposphere aerosol, supporting the suggestion that a small fraction by number, but a significant fraction by mass, had previously encountered clouds.
3.2. Specific case study
During the Summer campaign, on 24th June 1992, aerosol measurements were taken in a decoupled boundary layer with 5–8r8ths stratocumulus cover at
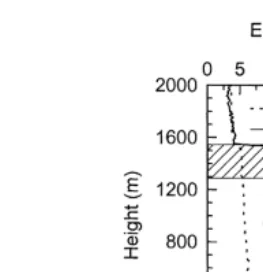
f1200 m and 2–7r8thscumulus between 500 and 1200 m. Vertical profiles of aerosol concentrations,
shown in Fig. 2, illustrate some variability in the concentrations, with average
concentra-y3 y3 Ž
tions of 236 cm in the surface layer and of 262 cm in the sub-cloud layer the layer
.
between the decoupling inversion and stratocumulus cloud base . Peak concentrations of greater than 300 cmy3 were observed in the vicinity of cumulus cloud edges. Although
Ž .
Fig. 2. Aerosol, EPT and total water content Q vertical profile for 24r06r1992. Stratocumulus cloud location is illustrated by hatched region between 1300 and 1500 m. Typical cumulus cloud location is illustrated by the black region between 500 and 11 m.
concentration differs by f25%, with 2.00 mg my3 occurring in the surface layer compared with 2.43mg my3 occurring in the sub-cloud layer.
Decoupling of a mixed boundary layer is normally caused by entrainment of dry free tropospheric air induced by increased localised turbulence generated by cloud top radiative cooling. This process results in limited mixing within the cloud and sub-cloud layer but does not extend down to the surface, and consequently, an equivalent potential
Ž .
temperature EPT inversion results in the mixed boundary layer, thus decoupling the surface and cloud layer. The inversion separating the surface and cloud layer serves to confine the surface flux of vapour and heat within the surface layer. With the build up of heat and moisture in this layer, some parcels become conditionally unstable leading to cumulus cloud formation. If these clouds have sufficient buoyancy, they can penetrate the surface layer inversion and transport moisture and aerosolrCCN into the decoupled cloud and sub-cloud layer. On this basis, the out-flow air from cumuli, which have penetrated the surface layer inversion, will contain aerosol, sucked in from the surface layer, which has been processed in the cloud.
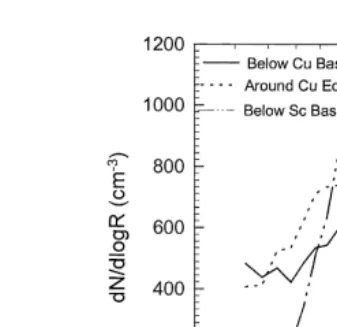
Representative aerosol size distributions taken below cumulus cloud base, around the
Ž .
edge of a cumulus cloud, and just below stratocumulus cloud base shown in Fig. 3 display a significant and progressive enhancement in number andror mass tion. The distribution observed at the cumulus cloud edge exhibits particle
concentra-Ž y3. Ž y3.
tions Ns274 cm larger than that observed at cumulus base Ns235 cm . The largest concentration increase is observed at sizes around 0.08mm radius. The spectral changes are consistent with activation of CCN at sizes smaller than rs0.05 mm followed by subsequent growth into sizes larger than rs0.05 mm. The effect of the growth process on aerosol mass is to increase the accumulation mode mass from 1.91
mg my3at cumulus base to 2.28mg my3 at cumulus cloud edge. The activation of these
Fig. 3. Typical spectra observed under cumulus base, at cumulus cloud edge, and under stratocumulus cloud base.
The spectra taken at cumulus cloud edge and stratocumulus cloud base also exhibit spectral changes in the form of a shift of size distribution to larger sizes and a concomitant narrowing of the size distribution. Although the sub-cloud layer average concentration below the stratocumulus cloud deck was Ns262 cmy3, the distribution
Ž y3.
shown comprises a concentration Ns245 cm comparable to that observed in the surface layer in order to illustrate the spectral differences between the two aerosol layers. The change in spectral shape between under cumulus base and stratocumulus base results in an increase of mass from 1.91 to 2.54mg my3.
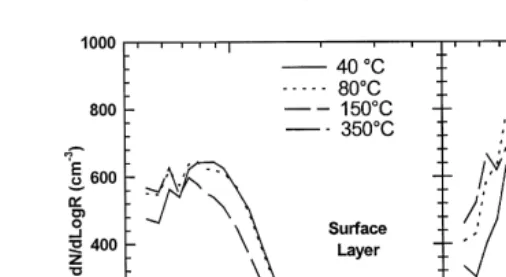
By examining the change in aerosol volatility between the surface layer and the decoupled mixed layer, we can attempt to elucidate the aerosol chemical species which are enhanced during these cloud processing events. Fig. 4 shows the volatility size distributions taken in the surface layer and in the decoupled sub-cloud layer. Each spectrum corresponds to a 10-min horizontal reciprocal run average. The loss of aerosol between 408C and 808C is thought to correspond to the loss of low volatility aerosol such as nitric acid andror light organic aerosol while the loss between 808C and 1508C normally corresponds to the loss of sulphuric acid. Ammonium sulphate volatilises at 1808C and therefore is volatilised between 1508C and 3508C. The residual aerosol remaining at 3508C, possessing a small mode-radius, is normally soot carbon in such
Ž .
Ž . Ž .
Fig. 4. Volatility distributions observed in surface layer left and sub-cloud layer right . Ambient dry distributions are sampled at 408C. Low volatility aerosol is volatilised between 408C and 808C; sulphuric acid is volatilised between 808C and 1508C; and ammonium sulphaterbisulphate is volatilised between 1508C and 3008C. Aerosol remaining at 3008C is typically soot carbon.
Ž
concentration of the low volatility material thought to be a nitric acid andror organic
.
component increased from 2% in the surface layer to 17% in the sub-cloud layer while the sulphuric acid contribution increased from 20% in the surface layer to 38% in the sub-cloud layer. It should be noted that the volatility runs were conducted approximately 1.5–2.0 h after the profile shown in Fig. 2 was completed and that the difference in average mass loadings between the two layers had increased from 2.09mg my3 in the
surface layer to 4.0 mg my3 in the sub-cloud layer. The volatility analysis of the
cloud-processed aerosol suggests that sulphuric acid is the primary aerosol species added to, or formed in, the existing aerosol. The analysis also points to the growth of pre-existing aerosol by either nitrate andror organic mass addition. A small
enhance-Ž .
ment of partially neutralised sulphate aerosol ammonium bisulphate is also observed. These observations are consistent with measurements of chemical growth of aerosol in a cap cloud which is frequently encountered at the nearby ground based cloud station
Ž .
at Great Dun Fell, where Choularton et al. 1996 also observed the growth of nuclei smaller that 0.05mm into the accumulation mode after passage through a cap cloud and attributed this growth to aqueous phase formation of sulphate and nitrate in cloud
Ž .
droplets. Although the relative growth observed by Choularton et al. 1996 is similar to that observed here, their results indicate either a conserved or reduced accumulation mode number concentration. Generally, at this site, there appears to be a reduction in accumulation mode number concomitant with an increase in mean particle mass. One possible explanation for this reduction is that the hilltop cloud sampling station causes enhanced turbulent deposition of cloud droplets to the hill, thereby reducing the number of evaporating aerosol on exit from the cloud. A reduction in accumulation mode nuclei after evaporation from cloud was not observed during the measurements presented here, possibly due to the fact that measurements were taken non-intrusively from an airborne platform.
growth is observed in all size ranges. This growth compares well with the growth of
Ž .
aerosol in moderately clean cumulus observed by Leaitch 1996 where a shift to larger
Ž .
sizes in the accumulation mode was observed. Further, Leaitch 1996 also observed an increase in number concentration of evaporated nuclei at sizes -0.08 mm, similar to that observed here after passage through a cumulus cloud. This increase tended to preserve the general characteristics of the distribution by compensating for the growth of pre-existing accumulation mode nuclei, even though the mass of the distribution had increased. The explanation for this observation is that under the higher supersaturations encountered in cumulus clouds, Aitken mode nuclei readily are activated into the accumulation mode, thereby increasing the concentration in this mode.
Ž .
Leaitch 1996 also reported aerosol characteristics after passage through stratocumu-lus under much more polluted conditions than encountered here and ilstratocumu-lustrated the presence of a bi-modal accumulation mode. Comparison of interstitial aerosol with that observed outside of cloud suggests that the minimum size of aerosol activated under these conditions was significantly higher than that observed under their cumulus case study and the study presented here. No bi-modal accumulation mode was observed in these measurements, however, the radius of the single mode was observed to increase in size. The complete growth of the mode presented here suggests that almost all of the accumulation mode nuclei were activated into cloud droplets compared to the Leaitch
Ž1996 case where only a moderate fraction were activated. The differences between.
these stratocumulus cases are likely to be due to the much more polluted environment in the Leaitch case, and thus, higher aerosol loadings, which will tend to reduce the peak supersaturation reached in cloud as more nuclei compete for the same liquid water. This reduction will increase the size of the smallest activated size along with lowering the
Ž .
fraction of accumulation mode nuclei being activated. Hallberg et al. 1994 also saw a reduced fraction of aerosol activated in the more polluted cases during the Kleiner Feldberg cloud experiment, along with an increase in the 50% partitioning fraction from
f0.05 to f0.12 mm, when compared to cleaner aerosol conditions.
4. Discussion
The large changes observed in the vicinity of clouds have been attributed to micro-physical processes, specifically, chemical processing of aerosol in cloud; how-ever, another possibility for the observations could be sampling artefacts such as shattering of cloud droplets in the inlet duct, which warrants further investigation. Shattering of cloud droplets seems unlikely as it was ensured that all data presented here
Ž .
4.1. Macro-scale possibilities
Changes in air mass type, and consequently aerosol characteristics, associated with large scale meteorological conditions can also be ruled out since no frontal passage was observed throughout both campaigns. Furthermore, over the time scales of the observa-tions, typically 2–3 h, no significant change in wind direction, and thus, aerosol sources were observed.
4.2. Micro-scale possibilities 4.2.1. Aerosol growth mechanisms
If micro-scale processes are the cause of the observed aerosol enhancement in the vicinity of clouds, these process must be capable of growing new particles, or
sub-accu-Ž .
mulation mode particles r-0.05 mm , into the accumulation mode size range over a time scale significantly shorter than the lifetime of a particle; and, a time scale shorter than that for large scale meteorological change. Furthermore, if these observations result, as suggested, from the processing of aerosol in cloud, then the process must be able to proceed on a time scale comparable to that of which a parcel spends being cycled
Ž . Ž
through a cloud of the type observed here , i.e. typically less than 0.5 h Pruppacher
.
and Klett, 1978 .
Possible growth processes are: condensation growth, coagulation growth, cloud-free heterogeneous aqueous phase oxidation, andror heterogeneous aqueous phase oxidation in cloud. Time scale calculations associated with these growth processes are contained in the Appendix. Growth factor limitations are defined from the observations as illustrated in Fig. 5. We examine the changes in the size distribution below cumulus cloud base and
Ž .
Fig. 5. Spectral differences between aerosol observed below cumulus base i.e. surface layer and below
Ž . Ž .
stratocumulus base i.e. decoupled cloud layer . A marks the size region r-0.05mm from which particles
Ž .
Ž .
under stratocumulus cloud base shown in Fig. 2 by splitting the observed distributions into three regions. We then can examine the growth time scales capable of producing the
Ž .
observed spectral changes: A — Aitken mode aerosol r-0.05 mm ; B — where the
Ž .
reduction is observed 0.05–0.08mm ; and C — the mid-point of where the increase in
Ž .
concentration is observed 0.08–0.2 mm . The changes between the surface layer aerosol and the sub-cloud aerosol correspond to an increase in concentration of 55 cmy3
around region C and a decrease in concentration from 96 to 44 cmy3 in region B. It
appears that 55 cmy3 have grown from region B to C, while a further 10 cmy3 have
grown from A to B, resulting in a narrowing of the accumulation mode and a deepening of the gap between the Aitken mode and the accumulation mode. If we consider the
Ž .
growth of aerosol from the geometric centre of region B 0.063mm to the accumulation
Ž .
mode peak in region C 0.1 mm , we can examine the possible growth processes and time scales involved in growing particles from region B to region C.
4.2.2. Condensation growth
The condensation of gas phase aerosol precursors such as H SO2 4 vapour onto existing aerosol can increase the mass of aerosol particles. To observe an increase in accumulation mode aerosol number concentration through condensation growth, aerosol from the sub-accumulation mode, or Aitken mode, must grow into accumulation mode sizes. Assuming a steady state condition where the oxidation of SO by the OH radical2
is equal to the condensation rate onto existing aerosol, an SO concentration of 0.5 ppb2
Ž .
results in a H SO2 4 vapour concentration of 3 ppt Eq. 2 . Inserting this vapour
Ž .
concentration into the particle condensation growth, Eq. 3 results in a characteristic growth time of 7.5 days to grow a particle of radius 0.063 to 0.1mm by condensation.
4.2.3. Coagulation growth
Self-coagulation of Aitken mode particles, with a mode-radius around 0.03mm, can increase the number of accumulation mode particles as particles in the self-coagulating
Ž . Ž .
mode increase in size. This process is characterised by Eqs. 4 and 5 in the Appendix. Using a relatively high rural Aitken mode concentration of 10,000 cmy3
, the self-coagu-lation growth time scale is approximately 80 days.
Below cloud diffusive coagulation of Aitken mode particles with particle size
Ž .
rs0.063mm is characterised by Eq. 7 . Assuming that the wet ambient particle radius
Ž .
is twice that of its dry value corresponding to a relative humidity of 80% , and taking the mean radius of the capturing particle to be the arithmetic mean of its initial
Žr1s0.063mm and final size r. Ž 2s0.1mm , the diffusive coagulation coefficient K. 12
is 2=10y9 cmy3 sy1. Initialising the Aitken mode concentration at n
s10,000 cmy3 Ait
results in a growth time scale of 15.6 days.
In-cloud diffusive coagulation would be expected to proceed at a faster rate due to the increased surface area associated with the growing particles activated into cloud
Ž .
droplets. Modifying Eq. 7 for diffusive coagulation between Aitken mode particles and cloud droplets of radius 8mm, using a derived coagulation coefficient K s3.6=10y8
12
cmy3 sy1, results in a required time scale of 21.8 h to grow 0.062 mm particles into 0.1
4.2.4. Cloud-free heterogeneous oxidation
Wet aerosol particles provide an effective site for the aqueous phase oxidation of
Ž .
dissolved aerosol precursors Chameides and Stelson, 1992; Sievering et al., 1992 . In the absence of catalysts, the conversion of dissolved SO into aerosol sulphate mass is2
Ž .
achieved through oxidation by ozone and hydrogen peroxide. In acidic aerosol H SO ,2 4 where the pH is low, oxidation by hydrogen peroxide is the dominant reaction while for
Ž .
high pH aerosol formed on NH4 2SO , the dominant oxidant is ozone. The conversion4 rate of SO to sulphate by hydrogen peroxide oxidation is independent of the aerosol2 pH, however, the conversion rate by ozone oxidation proceeds significantly faster than
Ž .
oxidation by hydrogen peroxide at high pH 5–7 . Based on the aqueous phase
Ž . Ž .
production rate of sulphate mass Eq. 8 from Lin et al. 1992 , we can derive a
Ž .
heterogeneous oxidation growth law for a particular size of particle Eq. 11 . Taking a
Ž .
wet radius as twice that of its dry size corresponding to a relative humidity of 80% and assuming that the pH in the wet aerosol particle remains constant at pHs4, the time required to grow particles of r1s0.063 mm to r2s0.1mm for O , SO , and H O3 2 2 2
concentrations of 30, 0.5, and 1 ppb, respectively, is 792 days.
4.2.5. In-cloud heterogeneous oxidation
In-cloud heterogeneous oxidation is expected to proceed at a faster rate since the droplet solute concentration will be very much reduced and the pH of the water droplet
Ž . Ž .
increased O’Dowd et al., 2000 . Eq. 11 can be scaled up to estimate the growth rate if
Ž .
the growing particle is activated into an 8-mm radius cloud droplet Eq. 12 , and accounting for the uptake of NHq by maintaining the pH constant, leads to a growth
4
time scale of 443 s for a conservative pH value of 5.
4.2.6. In-cloud coalescence
Coalescence of two cloud droplets leads to a shift in the aerosol mass to larger sizes, however, this process results in a reduction in number concentration. To produce the observed mass enhancement, at least 500 cmy3 particles from below point A would
have to be activated and coalesced in order to produce the accumulation mode increase.
Ž . Ž .
Measurements from Raga and Jonas 1993 and Martin et al. 1994 suggest that for the given concentration of sub-cloud accumulation mode aerosol, it is very unlikely that cloud droplet concentrations of this magnitude would occur. Since no penetrations of cloud were conducted during this flight, this conclusion cannot be corroborated by the measurements.
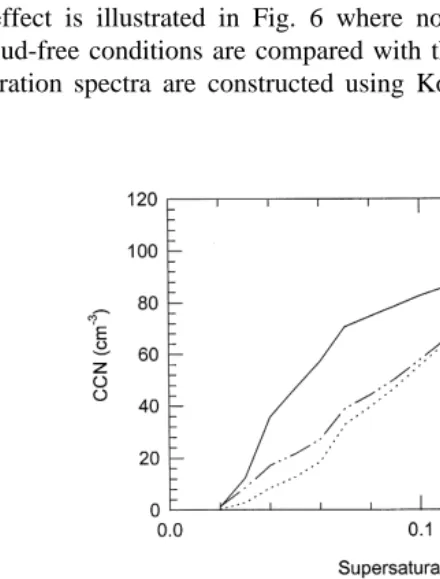
5. Effect of cloud processing on the CCN supersaturation spectrum
The previous examples illustrate that most aerosolrCCN, on evaporation after exiting clouds, are significantly larger than the aerosolrCCN entering the cloud. This mass enhancement has been attributed to the uptake of soluble precursor gas phase species into cloud droplets where they are subsequently oxidised to less volatile aerosol mass. The effect of increasing the mass of a CCN by addition of soluble material is to allow it to be activated at a lower cloud supersaturation since the critical activation of a CCN is
Ž .
dependent on the number of soluble ions Hudson and Clarke, 1992 . Therefore, after chemical processing in clouds, the CCN supersaturation spectrum will be modified, leading to a higher concentration of CCN at a lower supersaturation.
This effect is illustrated in Fig. 6 where normalised CCN supersaturation spectra under cloud-free conditions are compared with that under cloudy conditions. The CCN
Ž
supersaturation spectra are constructed using Kohler curve equations Pruppacher and
Ž .
Fig. 6. Top Changes in the CCN supersaturation distribution for typical cloud-free and cloudy environmental
y3 Ž .
.
Klett, 1978 and by assuming that the observed aerosol is composed of ammonium sulphate. Although this is not strictly correct as volatility analysis illustrated the presence of sulphuric acid and soot carbon in the accumulation mode size range, the assumption that all the aerosol is ammonium sulphate serves to illustrate the relative change in the CCN supersaturation spectra. Fig. 6a compares the CCN spectra derived from the CBL, CFBL and CFFT aerosol distributions shown in Fig. 1. The CFBL and CFFT spectra exhibit very close similarities as shown in Fig. 1. By comparison, the CBL spectrum, at supersaturation less than 0.1%, exhibits approximately twice as many CCN as that calculated for both the CFFT and CFBL spectra. These results suggest that clouds
Ž .
will form more readily i.e. a lower supersaturation is required on aerosol which has already been cycled through clouds. The changes in CCN spectra for 24r06r1992, shown in Fig. 6b also exhibit a similar pattern for CCN observed in the vicinity of clouds compared with those observed in the general background.
6. Conclusions
Normalised accumulation mode aerosol distributions observed under cloudy
condi-Ž .
tions possessed greater mode-radii f0.1mm , and consequently greater mass, than that of aerosol observed under cloud-free conditions in the boundary layer and free
tropo-Ž .
sphere mode-radii -0.6 . The higher mode-radii observed under cloudy conditions have been attributed to enhanced oxidation of soluble aerosol precursors in cloud droplets. Not only were distinct differences observed between the cloudy aerosol distributions and the cloud-free distributions but, on cloudy days, aerosol distributions observed in the vicinity of stratocumulus and cumulus clouds were observed to possess enhanced mass, and sometimes number, over that of the general background aerosol. Volatility analysis indicates that this enhanced mass was volatile at temperatures typical of sulphuric acid aerosol but also indicates the presence of more volatile aerosol, possibly nitric acid or light organic aerosol. In a decoupled boundary layer containing cumulus and stratocumulus clouds, the cumuli appear to provide an extra source of stratocumulus CCN by transferring CCN, active only in cumuliform clouds, into larger CCN which can readily be activated in stratocumulus clouds. The effect of chemical cloud processing is to alter the CCN supersaturation spectrum and make more CCN available at lower cloud supersaturations. Simple calculations indicate that neither condensational growth, coagulative growth, or cloud-free heterogeneous oxidation of precursor gases in aerosol particles, for realistic conditions, can proceed on a time scale fast enough to explain the observations. Only heterogeneous oxidation could occur over a time scale of 10–30 min, i.e. the time scale for a parcel of air to cycle through a cloud.
Appendix A
Theoretical descriptions of aerosol and gas-to-particle growth processes capable of
Ž
growing particles of radius r1s0.063mm the geometric mean of region B end points
. Ž .
A.1. Aerosol mass enhancement
The mass addition to a particle in growing it to a larger size may be represented by: 4pr
3 3
d mgrowths
Ž
r2yr1.
Ž .
13
Thus, required mass for a particle of 0.063mm to grow into a 0.1-mm radius particle, using an ammonium sulphate density of 1800 kg my3, is 5.65
=10y1 8 kg m.
A.2. Condensational growth
Assuming that a steady state H SO vapour concentration has been achieved, the acid2 4
vapour concentration, CH SO2 4, can be estimated. Neglecting the pre-existing aerosol surface area so that an upper limit for the gas phase acid concentration and, correspond-ingly, a lower limit for the condensational growth time may be achieved, the mass conservation equation for the acid vapour may be described as:
dCH SO2 4 4pr DCw H SO2 4N
where OH and SO2 represent the gas phase concentrations of hydroxyl radical and
Ž 6 y3 .
sulphur dioxide, respectively set to 1=10 molecules cm and 0.5 ppb , and K is the reaction rate coefficient for the photochemically driven production reaction. The term on
Ž .
the right-hand side is taken from Schwartz 1986 and quantifies the aerosol condensa-tion sink. The wet radii are represented by r ; D is the diffusion coefficient; l is thew mean free path of air; a the accommodation coefficient; and N is the number concentration of accumulation mode aerosol, taken here to be the number enhancement. Using the geometric mean of the dry radii r and r as a suitable mean dry radius for1 2
this calculation, and assuming the wet radii is approximately equal to twice the dry radii,
Ž . 13 y3
Eq. 2 predicts an acid vapour concentration of 7=10 molecules m , or approxi-mately 3 ppt.
This acid vapour concentration can then be inserted in the particle condensational growth:
which, on integration, yields a required time of 7.5 days to grow a 0.063-mm particle into a 0.1-mm particle by condensation.
A.3. Coagulation growth
Coalescence of small Aitken mode particles, both with themselves within a growing
Ž . Ž .
A.4. Self-coagulation
The equation describing self-coagulation within a mode may be written in terms of the mode’s number concentration, n, and the self-coagulation coefficient, K :
d n Kn2
s y
Ž .
4d t 2
Ž .
Solving Eq. 4 to give the number concentration of particles within a mode at some
Ž .
time, t s , after the start of the process yields:
n0
For coagulation of the Aitken mode rAits0.03mm to form the observed accumula-tion mode increase, the initial Aitken mode number concentraaccumula-tion must be at least Yd N particles cmy3, where Y, the number of Aitken mode particles required to self-coagulate
to form an accumulation mode particle, is:
r23
Ys 3
Ž .
6rAit
and d N, the accumulation mode concentration enhancement. For the case considered here, Ys37 and d Ns57 cmy3 for r2s0.1 mm and an Aitken mode dry radii
rAits0.03mm. The time required for n to decay to the observed accumulation mode0
Ž
number enhancement d N and the approximate time for the Aitken mode to grow into
. Ž .
the accumulation mode at 0.1mm , is predicted by Eq. 5 . With an initial Aitken mode concentration of 2000 cmy3 and a coagulation coefficient of 1
=10y9 cm3 sy1, the
time scale required is 411 days. Using a reasonable upper limit for rural Aitken mode concentration of 104cmy3, the required time scale is reduced to approximately 80 days.
A.5. DiffusiÕe coagulation
Diffusive coagulation of accumulation mode particles with rs0.063mm and Aitken
Ž .
mode particles rs0.03 mm can provide a growth mechanism which would enhance the concentration of particles in the accumulation mode peak concentration range
Žrs0.1 mm . The rate of coagulation of Aitken mode particles with a single growing.
accumulation mode particle is simply the product of the coagulation coefficient, K ,12
and the number concentration of Aitken mode particles of mass d m, nAit. If we assume that the Aitken mode concentration is maintained by some means, then the time for growth from r1s0.063 mm up to r2s0.1 mm by diffusive coagulation with Aitken mode particles, using mass conservation is:
r4p
3 3
ts
Ž
r2yr1.
Ž .
7Taking nAits104 cmy3 and evaluating a coagulation coefficient K12s2=10y9
ŽSeinfeld and Pandis, 1998 between particles of wet radii 0.06 and 0.126. mm, the time required to grow a particle from 0.063 to 0.1mm dry radius is 15.6 days.
If the growing particle is activated into a cloud droplet, the speed of this type of growth can be enhanced. Assuming that the activated growing particle forms a cloud droplet with a typical radius of 8mm, the coagulation coefficient becomes Ks3.6= 10y8 cm3 sy1, leading to a faster growth time of 21.8 h.
A.6. Heterogeneous chemical processing
Ž .
Following Lin et al. 1992 , the rate of sulphate production within a solution droplet of wet radius rw may be written as:
4 3 k4 k5
w
x w
x
w
x w
x
Rs3prw
½
k H O6 2 2 SO2 qk O7 3 SO2ž
1qw
Hqx
qw
Hqx
2/
5
Ž .
8w x w x w x
In which SO , H O2 2 2 and O3 are the aqueous phase concentrations of sulphur dioxide, hydrogen peroxide, and ozone, respectively. For a constant ozone and hydrogen peroxide concentration of 30 and 1 ppb, respectively, this may be written as:
w
x
3in which m is the molar mass of the salt assuming there is sufficient ammonia toa
.
produce ammonium bisulphate .
A.7. Cloud-free heterogeneous production
Ž
Assuming that the particle wet radius is twice that of the dry radius corresponding to
.
an equilibrium size at 80% relative humidity , and equating the rate of aerosol mass
2 Ž .
increase, 4rpr d rrd t, with Eq. 10 results in the first-order differential growth equation:
w
x
d r 2b SO2 m ras
Ž
11.
d t rp
which may be integrated to give,
r1
Table 1
Growth time scales for cloud-free heterogeneous growth in aerosol particles of sizes 0.03 and 0.063mm up to a size of 0.1mm as a function of pH and initial SO concentration.2 ris aerosol density and O and H O3 2 2
concentrations are fixed at 30 and 1 ppb, respectively
Ž . Ž .
r1 r2 r bŽSO2s0.25. pH Time s Time day
0.03 0.1 1800 9.46ey06 4 3.60eq08 4164
0.063 0.1 1800 9.46ey06 4 1.38eq08 1598
0.03 0.1 1800 1.02ey05 5 3.34eq08 3862
0.063 0.1 1800 1.02ey05 5 1.28eq08 1482
0.03 0.1 1800 8.56ey05 6 3.98eq07 460
0.063 0.1 1800 8.56ey05 6 1.53eq07 176
Ž . Ž .
r1 r2 r bŽSO2s0.5. pH Time s Time day
0.03 0.1 1800 1.89ey05 4 1.80eq08 2082
0.063 0.1 1800 1.89ey05 4 6.90eq07 799
0.03 0.1 1800 2.04ey05 5 1.67eq08 1931
0.063 0.1 1800 2.04ey05 5 6.40eq07 741
0.03 0.1 1800 1.71ey04 6 1.99eq07 230
0.063 0.1 1800 1.71ey04 6 7.63eq06 88
for varying pH values and a constant SO concentration of 0.5 ppb are shown in Table2
1. A typical sulphate aerosol is unlikely to possess a pH greater than 4, suggesting that 792 days is a typical growth time scale for heterogeneous growth.
A.8. In-cloud heterogeneous sulphate production
The cloud-free heterogeneous growth equation can be scaled up to estimate the heterogeneous growth time scales of aerosol activated into cloud droplets by setting the growing particle size equivalent to a cloud droplet of size 8mm radius. The characteris-tic growth time for the aerosol, resulting from combined H O and O oxidation, then2 2 3
becomes
r4p
3 3
ts
Ž
r2yr1.
Ž
13.
3 R mm a
Given that the pH of sulphate-based cloud droplets during the condensation growth phase of a cloud is generally in the range pH 5 to pH 6, a growth time is conservatively estimated as 443 s for the more acidic case and 64 s for the more alkaline case.
References
Chameides, W.L., Stelson, A.W., 1992. Aqueous phase chemical processes in deliquescent sea-salt aerosol: a mechanism that couples the atmospheric cycles of S and sea-salt. J. Geophys. Res. 97, 20565–20580. Choularton, T.W., Bower, K.N., Gallagher, M.W., Bradbury, C., Wells, M., Wiedensohler, A., Birmili, W.,
Dinger, J.E., Howell, H.B., Wojciechowski, T.A., 1970. On the source and composition of cloud nuclei in a subsident air mass over the North Atlantic. J. Atmos. Sci 27, 791–797.
Hallberg, A., Noone, K.J., Ogren, J.A., Svenningsson, I.B., Flossmann, A., Wiedensohler, A., Hansson, H.-C., Heintzenberg, J., Anderson, T.L., Arends, B.G., Maser, R., 1994. Phase partitioning of aerosol particles in clouds at Kleiner Feldber. J. Atmos. Chem. 19, 107–127.
Hegg, D.A., Hobbs, P.V., 1982. Measurement of sulphate production in natural clouds. Atmos. Environ., 2663–2668.
Hegg, D.A., Hobbs, P.V., 1988. Comparison of sulphate and nitrate production in clouds on the mid-Atlantic and Pacific Northwest coast of the United States. J. Atmos. Chem. 7, 325–333.
Hegg, D.A., 1985. The importance of liquid phase oxidation of SO in the troposphere. J. Geophys. Res. 90,2
3773–3779.
Hegg, D.A., 1992. Heterogeneous production of CCN in the marine atmosphere. Geophys. Res. Lett. 17, 2165–2168.
Hobbs, P.V., 1971. Simultaneous airborne measurements of cloud condensation nuclei and sodium containing particles. Q. J. R. Meteorol. Soc. 97, 263–271.
Hoppel, W.A., Frick, G.M., Larson, R.E., 1986. Effect of nonprecipitating clouds on the aerosol size distrbitution in the marine boundary layer. Geophys. Res. Lett. 13, 125–128.
Hoppel, W.A., Frick, G.M., Fitzgerald, J.W., 1994. Marine boundary layer measurements of new particle formation and the effects nonprecipitating clouds have on aerosol size distribution. J. Geophys. Res. 99, 14443–14459.
Hudson, J.G., Clarke, A.D., 1992. Aerosol and cloud condensation nuclei measurements in the Kuwait plume. J. Geophys. Res. 97, 1719–1722.
Jennings, S.G., O’Dowd, C.D., Cachier, H., Cooke, W.F., Sheridan, B., 1994. Volatility of elemental carbon. J. Geophys. Res. Lett. 21, 1719–1722.
Leaitch, W.R., Strapp, J.W., Wiebe, H.A., Isaac, G.A., 1986. In: Prupppacher, H.R., Semonin, R.G., Slinn,
Ž .
W.G.N. Eds. , Precipitation Scavenging, Dry Deposition, and Resuspension. Elsevier, pp. 53–59. Leaitch, W.R., 1996. Observations pertaining to the effect of chemical transformation in cloud on the
anthropogenic aerosol size distribution. Aerosol Sci. Technol. 25, 157–173.
Lin, X., Chameides, W.L., Kiang, C.S., Stelson, A.W., Berresheim, H., 1992. A model study of the formation of cloud condensation nuclei in remote marine areas. J. Geophys. Res. 97, 18161–18171.
Makela, J.M., Aalto, P., Jokinen, V., Phoja, T., Nissinen, A., Palmroth, S., Markkanen, T., Seitsonen, K.,¨ ¨
Lihavainen, H., Kulmala, M., 1997. Observations of ultrafine aerosol and particle formation and growth in boreal forest. Geophys. Res. Lett., 1219–1222.
Martin, G.M., Johnson, D.W., Spice, A., 1994. The measurement and parameterization of effective radius in warm stratocumulus clouds. J. Atmos. Sci. 51, 1823–1842.
Noone, K.J., Ostrom, E., Pockalny, R.A., De Bock, L., van Grieken, R., 1996. Chemical and microphysical properties of cloud droplet residuals in marine stratocumulus clouds observed during the MAST experi-ment. Proc. 12th Int. Conf. Clouds Precip., Zurich, 1176–1179.
O’Dowd, C.D., Smith, M.H., Jennings, S.G., 1993. Submicron aerosol, radon and soot carbon characteristics over the North East Atlantic. J. Geophys. Res. 98, 1132–1136.
O’Dowd, C.D., Smith, M.H., 1993. Physico-chemical properties of aerosol over the North East Atlantic: Evidence for wind speed related sub-micron sea-salt aerosol production. J. Geophys. Res. 98, 1137–1149. O’Dowd, C.D., Smith, M.H., 1996. The vertical structure of aerosol in boundary layer thermodynamics. Q. J.
R. Meteorol. Soc. 122, 1799–1814.
O’Dowd, C.D., Geever, M., Hill, M.K., Jennings, S.G., Smith, M.H., 1998. New particle formation: spatial scales and nucleation rates in the clean marine coastal environment. Geophys. Res. Lett. 25, 1661–1664. O’Dowd, C.D., Lowe, J.A., Clegg, N., Smith, M.H., Clegg, S.L., 2000. Modelling heterogeneous sulphate
production in maritime stratiform clouds. J. Geophys. Res. 105, 7143–7160.
Pruppacher, H.R., Klett, J.D., 1978. Microphysics of Cloud and Precipitation. Reidel, Dordrecht, Holland. Quinn, P.K., Covert, D.S., Bates, T.S., Kapustin, V.N., Ramsey-Bell, D.C., McInness, L.M., 1993.
Dimethyl-sulphidercloud condensation nucleirclimate system: relevant size resolved measurements of the chemical and physical properties of atmospheric aerosol particles. J. Geophys. Res. 98, 10411–10427.
sodium containing particles, and Aitken nuclei in the Olympic Mountains of Washington. J. Atmos. Sci. 26, 281–288.
Raes, F., Van Dingenen, R., 1992. Simulations of condensation and cloud condensation nuclei from biogenic SO in the remote marine boundary layer. J. Geophys. Res. 97, 12901–12912.2
Raga, G.B., Jonas, P.R., 1993. On the link between cloud-top radiative properties. Q. J. R. Meteorol. Soc. 119, 1419–1425.
Seinfeld, J.H., Pandis, S.N., 1998. In: Atmospheric Chemistry and Physics, From air Pollution to Climate Change. Wiley, pp. 596–648.
Schwartz, S.E., 1986. Mass transport considerations pertinent to aqueous-phase reactions of gases in
Ž .
liquid-water clouds. In: Jaeschke, W. Ed. , Chemistry of Multiphase Atmospheric Systems. Springer-Verlag, Berlin, pp. 415–471.
Sievering, H., Boatman, J., Galloway, J., Keene, W., Kim, Y., Luria, M., Ray, J., 1992. Removal of sulphur from the marine boundary layer by ozone oxidation in sea-salt aerosols. Nature 360, 571–573.