Full Terms & Conditions of access and use can be found at
http://www.tandfonline.com/action/journalInformation?journalCode=vjeb20
Download by: [Universitas Maritim Raja Ali Haji] Date: 11 January 2016, At: 22:12
Journal of Education for Business
ISSN: 0883-2323 (Print) 1940-3356 (Online) Journal homepage: http://www.tandfonline.com/loi/vjeb20
The Use of the ETS Major Field Test for Assurance
of Business Content Learning: Assurance of
Waste?
Paul M. Mason , B. Jay Coleman , Jeffrey W. Steagall , Andres A. Gallo &
Michael M. Fabritius
To cite this article: Paul M. Mason , B. Jay Coleman , Jeffrey W. Steagall , Andres A. Gallo & Michael M. Fabritius (2011) The Use of the ETS Major Field Test for Assurance of Business Content Learning: Assurance of Waste?, Journal of Education for Business, 86:2, 71-77, DOI: 10.1080/08832323.2010.480988
To link to this article: http://dx.doi.org/10.1080/08832323.2010.480988
Published online: 23 Dec 2010.
Submit your article to this journal
Article views: 62
View related articles
CopyrightC Taylor & Francis Group, LLC ISSN: 0883-2323
DOI: 10.1080/08832323.2010.480988
The Use of the ETS Major Field Test for Assurance
of Business Content Learning: Assurance of Waste?
Paul M. Mason, B. Jay Coleman, Jeffrey W. Steagall, and Andres A. Gallo
University of North Florida, Jacksonville, Florida, USA
Michael M. Fabritius
Centre College, Danville, Kentucky, USA
Exit exams have become the currency of choice for both institutions and accrediting bodies seeking to demonstrate student learning. Most researchers have ignored the opportunity costs of these tests and the fundamental question of whether the exams add value to the assessment process already in place on college campuses (course testing and GPA). A statistical model that uses a student’s GPA, SAT score, and demographic characteristics predicts the student’s Major Field Test (ETSB) score quite well. Furthermore, the opportunity cost of administering these exams at the institution in question exceeds$25,000 annually. The authors argue that the cost-benefit tradeoff of the ETSB exit exam is unfavorable.
Keywords: accreditation, assurance of learning, Educational Testing Service, exit exams, logistic regression
Educational assessment is a major topic on college cam-puses as programs strive to achieve or maintain accreditation and to demonstrate their efficacy to legislative and execu-tive branches that oversee their funding. Accrediting bodies, including the Association to Advance Collegiate Schools of Business (AACSB), require evidence that business schools fulfill their stated missions relative to student outcomes (As-sociation to Advance Collegiate Schools of Business, 2003). Regional accrediting bodies, such as the Southern Associ-ation of Colleges and Schools (SACS), have also begun to mandate that educators prove that they accomplish their mis-sions and achieve their expected learning outcomes (Southern Association of Colleges and Schools, 2008).
Assurance of learning models in business schools vir-tually always contain a learning objective associated with overall business content knowledge: learning fundamental material across all major areas of business. This goal is sep-arate from but typically included with objectives associated with learning skills such as communication (oral, written, and electronic), team building, critical thinking, and ethical rea-soning. One increasingly common method schools employ
Correspondence should be addressed to Paul M. Mason, University of North Florida, Department of Economics and Geography, 1 UNF Drive, Jacksonville, FL 32223, USA. E-mail: [email protected]
to assess learning outcomes and measure students’ progress in content learning is the administration of standardized exit examinations at or near the end of students’ programs of study. In many cases, a test such as the Educational Test-ing Service’s Major Field Test in Business (ETSB) is em-ployed for this purpose. ETSB attempts to cover both depth and breadth in assessing students’ levels of achievement and is designed to measure a student’s knowledge and ability to apply significant facts, concepts, theories, and analytical methods (Educational Testing Service, 2006).
Because of this stated objective, the ETSB is viewed as a viable instrument by institutions seeking to measure stu-dent progress vis-`a-vis business content knowledge. Some accrediting bodies even recommend the ETSB as an evalu-ation instrument. For example, in a presentevalu-ation to the ad-ministrative group of the institution studied herein, an SACS accreditation representative specifically cited the ETSB as a content knowledge assessment tool and inquired whether the institution was using it.
In the present article we address the research question of whether the administration of the ETSB is in effect wasteful as an assurance of learning tool and, by extension, whether the reliance or implicit insistence on the use of the ETSB by accreditation bodies is appropriate. To pursue this ques-tion, we address two more specific lines of inquiry. First, is the use of the ETSB efficient (or even necessary) as a
72 P. M. MASON ET AL.
measure of content knowledge? That is, does it add valu-able information to the set of assessments of student learn-ing that colleges routinely undertake (e.g., course grades)? Several researchers have identified those demographic and performance characteristics that generate the highest ETSB scores. However, we seek not to determine how to maximize ETSB scores, but rather to determine how well the score a given student achieves can be predicted. A fundamental hypothesis is that ETSB scores can be predicted accurately from traditional grading criteria (e.g., GPAs), measures of general academic preparation upon college entry (SAT or ACT scores), and student demographic factors. This method-ology advances previous literature on modeling ETSB re-sults primarily through a more advanced form of analy-sis. Logistic regressions demonstrate that whether a student passes the exam at a given threshold with a high degree of accuracy (83–96%) using information known prior to the student’s taking the exam can be predicted. Therefore, we question the incremental value of the ETSB for assessing learning. For present or prospective users of the ETSB, it ap-pears that present and historical grading rubrics are sufficient to capture very similar information about student content knowledge.
Our second line of inquiry addresses whether the value of any incremental information from the ETSB exceeds the financial and opportunity costs of purchasing and admin-istering the exams and analyzing the results. Such cost-benefit analysis is typically absent from accrediting body recommendations regarding the use of exit exams in gen-eral as well as in the literature. As we demonstrate sub-sequently, based on the data it can be estimated that the direct and indirect costs associated with administration of the ETSB at the institution in question exceed $25,000 an-nually. Given the limited marginal value of the ETSB that we found in our first line of inquiry, combined with re-duced funding for higher education, it is pertinent to ques-tion whether funds expended on the ETSB would be better reallocated to hiring an additional faculty member, or re-search, etc.
METHOD
Several recent empirical articles dealt with assessment and assurance of learning (Black & Duhon, 2003; Bycio & Allen, 2007; Marshall, 2007; Mirchandani, Lynch, & Hamilton, 2001; Pritchard, Potter, & Saccucci, 2006; Stoloff & Feeney, 2002). For brevity, we do not discuss their results except to make reference to them in the subsequent analysis. Suffice it to say that all of these researchers focused on what exit exams reveal about demographic characteristics without discussing the degree to which the scores can be accurately predicted. They did not assess whether exit exams provide sufficient incrementally valuable information to justify their cost.
To test the hypothesis regarding the accuracy with which ETSB results can be predicted, most of the variables analyzed in these studies were employed to assess the implications of student performance on the ETSB. This data set is larger than those in previous studies, consisting of 1,411 students who took the ETSB as an exit exam in the capstone business policy class at a comprehensive, urban institution with a total student enrollment of between 15,000 and 20,000 students, and a total undergraduate enrollment in the college of business of approximately 3,000 students. ETSB results were collected each semester from summer 2005 to fall 2007. The ETSB counted as 10% of the student’s course grade in business policy, so students had some incentive to perform well on the exam. Thus, the sample represents a near census of incentive-driven students who graduated (or came close to graduating) during the time frame examined.
Also collected were data on age, ethnicity, sex, term of matriculation, overall GPA at graduation, GPA in business courses only, GPA in nonbusiness courses, SAT (or equiv-alent ACT) score, major, transfer student status, and term of graduation. Although ETSB scaled scores were available for all 1,411 students, data anomalies on other factors, such as missing graduating GPA values, missing ACT and SAT scores, incorrect identifiers, and omitted responses relative to ethnicity, lowered the useable sample size to 873. Many students at the institution studied were older than traditional college-aged students given the institution’s status as an ur-ban university, but the remainder of the demographic and performance characteristics of students and programs were typical. The studied institution’s mean ETSB score for each term in the data set was between the 75th and 90th percentiles (inclusive) when compared to the mean ETSB scores at other institutions using the exam.
For modeling purposes, the data were converted by the matriculation and graduation dates into a value reflecting degree completion time (expressed in number of terms). Then separate completion time variables were constructed for transfer students and for native (or nontransfer) students. The term of administration was employed to construct bi-nary variables reflecting fall, spring, and summer semesters, with summer as the omitted category, and the year of admin-istration (2005, 2006, and 2007, with 2005 as the omitted category). Finally, the term variables were interacted with the business GPA factor in order to assess whether the re-lationship between business GPA (BUSGPA) and the ETSB scaled score (EXITEXAM) changed over time.
In order to compare the results to those from previous studies, the analysis first produced bivariate correlations and developed ordinary least squares (OLS) models employing EXITEXAM as the dependent variable. Employing the de-mographic data and the GPA scores, a logistic model was produced that predicts whether a student would get an exit exam score above a given threshold (e.g., the 70th percentile) based on the student’s specific characteristics. Our first line of inquiry concerned whether a student passing the ETSB
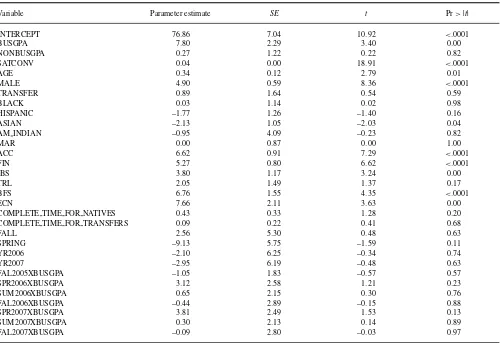
TABLE 1 OLS Results: Parameters
Variable Parameter estimate SE t Pr>|t|
INTERCEPT 76.86 7.04 10.92 <.0001
BUSGPA 7.80 2.29 3.40 0.00
NONBUSGPA 0.27 1.22 0.22 0.82
SATCONV 0.04 0.00 18.91 <.0001
AGE 0.34 0.12 2.79 0.01
MALE 4.90 0.59 8.36 <.0001
TRANSFER 0.89 1.64 0.54 0.59
BLACK 0.03 1.14 0.02 0.98
HISPANIC –1.77 1.26 –1.40 0.16
ASIAN –2.13 1.05 –2.03 0.04
AM INDIAN –0.95 4.09 –0.23 0.82
MAR 0.00 0.87 0.00 1.00
ACC 6.62 0.91 7.29 <.0001
FIN 5.27 0.80 6.62 <.0001
IBS 3.80 1.17 3.24 0.00
TRL 2.05 1.49 1.37 0.17
BFS 6.76 1.55 4.35 <.0001
ECN 7.66 2.11 3.63 0.00
COMPLETE TIME FOR NATIVES 0.43 0.33 1.28 0.20
COMPLETE TIME FOR TRANSFERS 0.09 0.22 0.41 0.68
FALL 2.56 5.30 0.48 0.63
SPRING –9.13 5.75 –1.59 0.11
YR2006 –2.10 6.25 –0.34 0.74
YR2007 –2.95 6.19 –0.48 0.63
FAL2005XBUSGPA –1.05 1.83 –0.57 0.57
SPR2006XBUSGPA 3.12 2.58 1.21 0.23
SUM2006XBUSGPA 0.65 2.15 0.30 0.76
FAL2006XBUSGPA –0.44 2.89 –0.15 0.88
SPR2007XBUSGPA 3.81 2.49 1.53 0.13
SUM2007XBUSGPA 0.30 2.13 0.14 0.89
FAL2007XBUSGPA –0.09 2.80 –0.03 0.97
at some predetermined level can be predicted. If so, it lends support to our overall thesis that there is little need either to administer the ETSB or to incur its expense.
RESULTS
Correlation Analysis
In order to determine the consistency of this sample with the studies referenced previously, it is necessary to first in-vestigate the simple correlations between SATCONV (the student’s SAT score or its converted ACT equivalent), BUS-GPA, and the demographic characteristics with the exit exam scores. The results are consistent with both Marshall (2007) and Bycio and Allen (2007). Relative to Marshall, the results herein reveal that all majors except international business (IBS) and transportation and logistics (TRL) are significantly correlated with the exit exam scores. All other majors except management and marketing are positively correlated. Similar to Bycio and Allen, we found that BUSGPA and SATCONV were most highly correlated with exit exam scores, but that the correlation was stronger for SATCONV (0.63) than for
BUSGPA (0.47). Unlike Bycio and Allen, the results in this paper determined that differences in exit exam performance do exist by gender at this university, with men performing better.
OLS Results
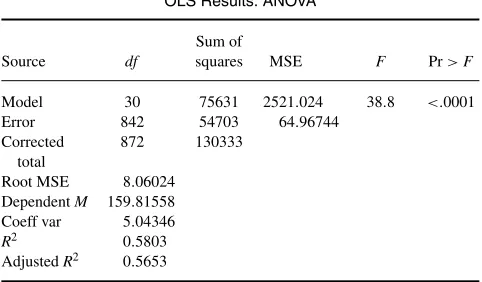
Tables 1 and 2 report the results from the ordinary least squares (OLS) regression model, which explains 56.5% of the variation in EXITEXAM. That performance places its ex-planatory power between those of Black and Duhon (2003) and Mirchandani et al. (2001), although the model of this paper is much closer to the former. Consistent with the other studies, business GPA and SAT score were highly significant, as are AGE, MALE, and ASIAN. Because the omitted ma-jor was management, the only mama-jors in the college that did not perform significantly better on the ETSB than manage-ment majors were marketing majors (confirming the find-ings of Pritchard et al., 2006), and transportation/logistics majors. Transportation/logistics majors were arguably at a competitive disadvantage, given that no section of the ETSB is oriented toward that subject. Time taken and term taken
74 P. M. MASON ET AL.
Error 842 54703 64.96744
Corrected total
872 130333
Root MSE 8.06024 DependentM 159.81558 Coeff var 5.04346
R2 0.5803 AdjustedR2 0.5653
were not significant, nor did the coefficient of BUSGPA vary significantly by term.
Exit exam scores were almost eight points higher for each 1.0 increase in a student’s business GPA and 4 points higher for every 100-point increase in the student’s SAT (or con-verted ACT) score. Given the relative differentials in GPAs and SAT scores, and contrary to assurance of learning ethos, SATCONV had a much larger impact, suggesting (in combi-nation with the correlations discussed above) that the general academic ability with which the student enters college is a far more important determinant of the ETSB score than what they achieve while in college. This outcome is also relevant to our primary premise because it reveals that student abil-ity as reflected in SATCONV is highly explanatory of both the business GPA and exit exam score (its correlation with BUSGPA is 0.31, the highest of all of the variables except nonbusiness GPA). Thus, if student grades and performance on the ETSB are driven primarily by the SATCONV score, it can be inferred that these exams reveal little about the value added from college.
Unsurprisingly, students who were 3 years older generated a significant differential, scoring a full extra point higher on the exit exam. This was in comparison with students scoring 0.71 points higher per year for Black and Duhon (2003). Men also had a higher score (4.9 points), as did those not majoring in management, marketing, or TRL ma-jors (from 3.8 to 7.66 points). The ultimate conclusion from the OLS analysis is that the results mirror those of others and are internally consistent both across semesters and across years.
Logistic Model
The OLS model revealed a strong correlation between the ETSB results and traditional academic performance metrics. However, it could not provide a straightforward instrument predicting the range within which a particular student would rank in the exit exam. Fortunately, a logistic regression model can do so.
The logistic model is
Pr(Y =1|x)= e x′β
1+ex′β
WhereY =1 refers to a group in a particular exit exam percentile (e.g.,Y =1 if the exit exam score is above the 90th percentile) andβis a vector of parameters that captures the effects of changes in variablesxon the probability. This
equation calculates the probability that a given student with characteristics xwill score above a particular percentile of
the distribution of the exit exams. The right-hand side of the equation is known as the odds of an observation with given values for thex variables falling into a particular category
(e.g., the 90th percentile).
Before attempting to use these models for prediction, it is useful to be explicit regarding what constitutes a successful prediction. For a given student whose score is above a partic-ular threshold, a successful prediction from the model places that student above that threshold, while placing students with below-threshold scores out of that category. This ability to correctly place an observation inside its correct category is the sensitivity of the prediction. Correctly placing a student out of the category when he or she should not be in it is the specificity of the prediction. Clearly, the fit of the logistic regressions is enhanced when both sensitivity and specificity are high.
It remains to specify which percentile constitutes passing the exit exam. In our view, given that the sample consists of students in their final semester before graduation, the 70th percentile is most appropriate and the model’s predictive success should be judged against that standard. However, because the passing threshold is open to debate, the analysis is also fitted for the 60th and 50th percentiles.
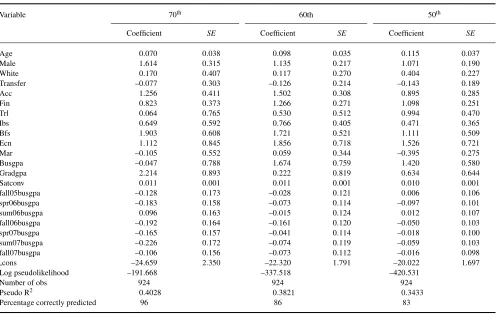
Table 3 summarizes the logistic model’s results, including coefficients, standard errors and summary statistics. For com-parison purposes, the Table 2 regressions use only the most explanatory subset of the variables from the OLS model. Each column presents the model for a particular passing thresh-old percentile. As noted at the bottom of each column—and most importantly with respect to the current thesis—the lo-gistic regression model correctly predicted (or classified) 96% of the students vis-`a-vis the 70th percentile, 86% of the students vis-`a-vis the 60th percentile, and 83% of the students vis-`a-vis the 50th percentile. These results sug-gest that ETSB scores can be predicted quite accurately using these models, which calls into question the value-added of the ETSB, particularly when weighed against its costs.
DISCUSSION
The OLS model demonstrated that business GPA, SAT score, and demographic characteristics effectively explain over 56% of the variation in exit exam scores (Table 1). More
TABLE 3
Logistic Regression Results, by Percentile (Using the Most Explanatory Subset of the OLS Regressors)
Variable 70th 60th 50th
Coefficient SE Coefficient SE Coefficient SE
Age 0.070 0.038 0.098 0.035 0.115 0.037
Male 1.614 0.315 1.135 0.217 1.071 0.190
White 0.170 0.407 0.117 0.270 0.404 0.227
Transfer –0.077 0.303 –0.126 0.214 –0.143 0.189
Acc 1.256 0.411 1.502 0.308 0.895 0.285
Fin 0.823 0.373 1.266 0.271 1.098 0.251
Trl 0.064 0.765 0.530 0.512 0.994 0.470
Ibs 0.649 0.592 0.766 0.405 0.471 0.365
Bfs 1.903 0.608 1.721 0.521 1.111 0.509
Ecn 1.112 0.845 1.856 0.718 1.526 0.721
Mar –0.105 0.552 0.059 0.344 –0.395 0.275
Busgpa –0.047 0.788 1.674 0.759 1.420 0.580
Gradgpa 2.214 0.893 0.222 0.819 0.634 0.644
Satconv 0.011 0.001 0.011 0.001 0.010 0.001
fall05busgpa –0.128 0.173 –0.028 0.121 0.006 0.106
spr06busgpa –0.183 0.158 –0.073 0.114 –0.097 0.101
sum06busgpa 0.096 0.163 –0.015 0.124 0.012 0.107
fall06busgpa –0.192 0.164 –0.161 0.120 –0.050 0.103
spr07busgpa –0.165 0.157 –0.041 0.114 –0.018 0.100
sum07busgpa –0.226 0.172 –0.074 0.119 –0.059 0.103
fall07busgpa –0.106 0.156 –0.073 0.112 –0.016 0.098
cons –24.659 2.350 –22.320 1.791 –20.022 1.697
Log pseudolikelihood –191.668 –337.518 –420.531
Number of obs 924 924 924
Pseudo R2 0.4028 0.3821 0.3433
Percentage correctly predicted 96 86 83
importantly, logistic regression results demonstrate that be-tween 83% and 96% of scores can be correctly classified (in-sample) as being above or below various relevant thresh-olds. Because in-sample accuracy is a questionable mea-sure of a model’s efficacy, the procedure also estimated a reduced-variable 70th percentile model based on the sub-set of observations between summer 2005 and fall 2007. That model predicted the (out-of-sample) exit exam perfor-mance correctly for 83% of the 151 spring 2008 students. Clearly, ETSB outcomes are highly predictable. Therefore, it is hard to conclude that the institution receives much if any incremental information from the ETS major field test in business.
Our second line of inquiry considered a cost-benefit anal-ysis of the ETSB. With such a small benefit, any significant cost is likely to be prohibitive from a rational perspective. In fact, there are substantial direct and opportunity costs asso-ciated with the exams. During the eight terms covered in the sample, the institution in question expended almost$15,000
per year to purchase the tests and$12,000 per year in direct
costs to administer them, implying a total of over$70,000 in
out-of-pocket expenses for the business school. Thus, during this eight-semester period, the business school appropriated over$70,000 to administer the test.
However, costs of the ETSB go beyond financial outlays to include opportunity costs. The associate dean in charge of assessment spent approximately 160 hours, the equiv-alent of a full-time month, engaged in activities directly associated with the ETSB. Some major tasks included an-alyzing, compiling, presenting, and discussing the results, and distributing summaries to constituents. Unfortunately, this opportunity cost of administering the exam once the testing model had been established ignores the substantial (and likely larger) cost required to launch the ETSB ini-tially, including coordinating integration across all sections of business policy. Such costs also include the time spent by faculty committees to review and interpret the results. Requiring the ETSB also imposes costs on students. They must make an extra round-trip commute to campus and take the exam. Students also experience unusual stress associ-ated with being tested on material from their entire pro-gram of study. None of these opportunity costs is insignifi-cant.
The total opportunity cost is conservatively estimated at
$30,000, implying that the institution spent over $100,000
across four years on the ETSB. To put these costs in per-spective, that sum represents the annual fringed salary of at least one full-time faculty member or enough part-time
76 P. M. MASON ET AL.
faculty members to teach 40 additional course sections dur-ing that period. It seems obvious that the resources expended on the ETSB could easily be reallocated to more productive mission-critical uses.
It could legitimately be asked what alternative could be recommended given that accreditation groups seem to in-sist on employing such tests, and sometimes specifically point to the ETSB. Having verified that SATCONV, GPA, and demographics explain a huge portion of the variation in performance across students, and that this result is station-ary over an extended time frame, institutions could—despite accreditation edicts to the contrary—simply consider stu-dents’ grades to be reflective of content learning. That is, after all, what they ostensibly represent. One counterar-gument is that not using standardized tests eliminates the ability to compare performance across institutions. How-ever, the validity of such comparisons is questionable, given indeterminate variability in curricula, faculty, and student abilities.
One potential advantage of the ETSB is that it also in-cludes subscores in various business disciplines (e.g., ac-counting, management, marketing). Perhaps these subscores could allow faculty to determine specifically where to target curriculum improvement efforts. If so, might these subscores provide value-added benefits to the AOL process? Unfortu-nately, it is not possible to answer that question because ETS does not provide subscores by individual. However, we hy-pothesize that because they are correlated to overall scores subscores are highly likely also to be predicted successfully by GPA, SAT score, and demographic characteristics. They are also likely correlated with a student’s GPA in the course-work that is specific to that subscore (e.g., a student’s man-agement subscore is likely significantly correlated with and likely successfully predicted by that student’s GPA in his or her management coursework). To the extent that this is true, program improvement initiatives could be as success-fully triggered and targeted by subarea-specific GPAs as they would be triggered and targeted by ETSB subscores.
It needs to be emphasized that the present analysis focused strictly on learning objectives associated with the assimila-tion of general business content knowledge. This analysis cannot investigate learning related to skills development or to content-learning in specific business disciplines (as noted previously). Thus, although it cannot be concluded that the entire assurance of learning process is wasteful this paper finds evidence that the use of the ETSB for assurance of content learning is wasteful. Because the ETSB mainly gen-erated information that could be accurately estimated from business GPA, SAT score, and demographic variables, the
$100,000 spent constitutes lost value. Given the perennial
scarcity of funding in higher education, there should be a vigorous, rigorous debate over whether the ETSB should continue to be essentially required, or should even be recom-mended, in order to achieve accreditation and assess general content learning.
In closing, we emphasize that our present analysis fo-cused only on the ETSB and not on all business stan-dardized exit exams in general. Further investigation is necessary to determine if the results from alternative stan-dardized exit exams and methods are equally as pre-dictable and as wasteful vis-`a-vis the investment put into them.
We also note that our analysis also does not necessarily imply that the institutional exercise of using standardized exams such as the ETSB is wasteful given other institu-tional utilities and given accreditation requirements. Institu-tions perceive standardized mechanisms such as the ETSB as essentially required for the institution to pass accredi-tation muster when it comes to assurance of learning be-cause the use of course grades is specifically stated as not being acceptable. Although alternatives do exist (e.g., an institution generating its own standardized exit exam), the use of that option requires substantial time and cost invest-ment for developinvest-ment (including testing for validity, relia-bility), and faces the risk of not being viewed as satisfactory by visitation teams. Use of standardized means is therefore viewed as a much more expedient option that carries pre-sumed prima facie acceptance in the accreditation process. Given the utility associated with achieving and maintaining accreditation, incurring the expense associated with the use of a well-known tool such as the ETSB—while not nec-essarily adding value in terms of costs versus the learning information gained—is therefore likely viewed as adding high value in terms of getting or staying accredited. Thus, our findings represent not so much a critique of the institu-tions using the ETSB, but rather more of a critique of the accrediting agencies that essentially require these types of approaches.
REFERENCES
Association to Advance of Collegiate Schools of Business. (2003). Eligibil-ity procedures and standards for business accreditation. St. Louis, MO: Author.
Black, H. T., & Duhon, D. L. (2003). Evaluating and improving stu-dent achievement in business programs: The effective use of standard-ized assessment tests.Journal of Education for Business,79(2), 90– 98.
Bycio, P., & Allen, J. S. (2007). Factors associated with performance on the educational testing service (ETS) major field achievement test in business (MFAT-B).Journal of Education for Business, 82, 196– 201.
Educational Testing Service. (2006). Major field tests: Business. Retrieved from http://www.ets.org/Media/Tests/MFT/pdf/mft testdesc business 4cmf.pdf
Marshall, L. (2007). Measuring assurance of learning at the degree pro-gram and academic major levels.Journal of Education for Business,83, 101–109.
Mirchandani, D., Lynch, R., & Hamilton, D. (2001). Using the ETS major field test in business: Implications for assessment.Journal of Education for Business,77, 51–56.
Pritchard, R. E., Potter, G. C., & Saccucci, M. S. (2006). The selection of a business major: Elements influencing student choice and implications for outcomes assessment.Journal of Education for Business,79, 152–156. Southern Association of Colleges and Schools. (2008). The
princi-ples of accreditation: Foundations for quality enhancement (3rd
ed.). Decatur, GA: Author. Retrieved from http://www.sacscoc.org/pdf/ 2008PrinciplesofAccreditation.pdf
Stoloff, M. L., & Feeney, K. J. (2002). The major field test as an assessment tool for an undergraduate psychology program.Teaching of Psychology,
29, 92–98.