Full Terms & Conditions of access and use can be found at
http://www.tandfonline.com/action/journalInformation?journalCode=cbie20
Download by: [Universitas Maritim Raja Ali Haji] Date: 17 January 2016, At: 23:16
Bulletin of Indonesian Economic Studies
ISSN: 0007-4918 (Print) 1472-7234 (Online) Journal homepage: http://www.tandfonline.com/loi/cbie20
Growth, Poverty, and Inequality under Jokowi
Arief Anshory Yusuf & Andy Sumner
To cite this article: Arief Anshory Yusuf & Andy Sumner (2015) Growth, Poverty, and Inequality under Jokowi, Bulletin of Indonesian Economic Studies, 51:3, 323-348, DOI: 10.1080/00074918.2015.1110685
To link to this article: http://dx.doi.org/10.1080/00074918.2015.1110685
Published online: 29 Nov 2015.
Submit your article to this journal
Article views: 278
View related articles
ISSN 0007-4918 print/ISSN 1472-7234 online/15/000323-26 © 2015 Indonesia Project ANU http://dx.doi.org/10.1080/00074918.2015.1110685
* We thank those who gave us comments during the 2015 Indonesia Update, at ANU, and at seminars in Jakarta, as well as Hal Hill, Lukas Schlögl, Kyunghoon Kim, Ross Mc Leod, Peter McCawley, Anne Booth, Howard Dick, Chris Manning, Dharendra Wardhana, and the editors, who gave us detailed comments on our drafts. We also thank Megananda Suryana and Yangki Suara, for their assistance, as well as a number of experts whom we interviewed in Jakarta and Manila.
Survey of Recent Developments
GROWTH, POVERTY, AND INEQUALITY UNDER JOKOWI
Arief Anshory Yusuf* Andy Sumner*
Padjadjaran University King’s College London
SUMMARY
The political authority of President Joko Widodo (Jokowi) was bolstered in the third
quar-ter of 2015 by a cabinet reshufle, his coalition’s gaining a parliamentary majority, and sev
-eral foreign-policy developments. Indonesia’s request to rejoin OPEC, for example, after having left in 2008, seemed more about international relations than oil prices, while oficial visits to the Middle East and the United States allowed Jokowi to project his presidency on
the international stage. He still faces resistance from within his own party, however.
Jokowi’s politically bold reshufle of economic ministers in August soon yielded a range of policy announcements. In September and October, his government introduced its irst
substantial set of reforms—a number of economic policy packages intended, among other things, to attract investment and stimulate domestic demand. If even half of these policies
are put in place, the impact on Indonesia’s economy should be tangible.
Few countries have escaped the effects of falling global commodity prices and China’s growth slowdown. At 4.7%, year on year, in the third quarter Indonesia’s rate of economic growth again fell short of the government’s target. Slowing growth and a negative outlook
have lowered market expectations and weakened the rupiah, which is also burdened by
the large outstanding external debt held by corporate borrowers. Indonesia’s real effective
exchange rate has recently begun to depreciate, however, which may stimulate exports. Growth prospects will also improve if the substantial increase in capital and infrastructure spending allocated in the state budget is realised.
Against this backdrop, we focus on what has happened to poverty and inequality in
Indonesia since Jokowi took ofice. The distributional impacts of the current macro economic
climate are likely to be hardest felt by the poor. Indonesia is well known for its record on pov-erty reduction, but between September 2014 and March 2015 the share of the population in poverty increased, even though economic growth was close to 5.0%. Slowing growth, rising food prices, the falling real wages of farmers, and the delayed disbursement of fuel-price
com-pensation all had an effect. Such impacts may be mitigated in the medium term by Jokowi’s
budget reallocations to infrastructure, if realised, and his expansion of social spending.
Keywords: growth, poverty, inequality, inclusive growth JEL classiication: E60, I32, I38, O11, O53
POLITICAL DEVELOPMENTS
Between July and October 2015, events in Indonesia—notably, a cabinet reshuf -le, the changing balance of power in the People’s Representative Council (DPR), and foreign-policy developments—did much to bolster President Joko Widodo’s (Jokowi’s) authority domestically after what had been a rocky period. Jokowi’s presidency began in October 2014 with an undeniable political success: the budget reallocation of fuel subsidies to infrastructure and social spending. Since then, however, and despite new iscal space, many of the 10 major infrastructure projects that he had identiied as priorities (including lagship port and maritime develop -ments) have failed to make much progress, owing in part to political inighting, a lack of cooperation and coordination among ministries, and Jokowi’s reportedly indecisive and non-confrontational leadership style. The making and unmaking of policy has become surprisingly common, and ministers have enacted policies that Jokowi has later had to overturn.
In August, Jokowi made his long-awaited irst cabinet reshufle, in which ive ministers were removed and one was reassigned. New appointees included a set of well-known economists: Darmin Nasution, a former governor of Bank Indonesia (BI), the central bank, who became coordinating minister of economic affairs; Rizal Ramli, a former minister of inance, who became coordinating minister for maritime affairs; and Thomas Lembong, a former investment banker who report-edly played an important role in Jokowi’s election victory, who became minister for trade. These appointments were a response to macroeconomic circumstances and have already yielded a broad set of policy announcements.
Other changes included the movement of retired general Luhut Panjaitan from presidential chief of staff to coordinating minister for political, legal, and secu-rity affairs, replacing Tedjo Edhy Purdijatno; former coordinating minister for the economy Sofyan Djalil, who was appointed minister for national development planning; and Pramono Anung, one of the president’s closest advisors, who was appointed cabinet secretary. Teten Masduki, a former lawyer and anti-corruption activist, was appointed the president’s new chief of staff. Jokowi also appointed General Gatot Nurmantyo chief of the armed forces and Sutiyoso, a former gov-ernor of Jakarta, head of the State Intelligence Agency. Sutiyoso is chair of PKPI (Indonesian Justice and Unity Party), so his appointment was widely seen as political. The police commissioner, General Budi Waseso, was removed from his position as head of the criminal investigation unit (Kabareskrim).1
Jokowi’s authority was also strengthened in September, by the surprise defection of PAN (National Mandate Party) from the opposing Red-and-White Coalition. This move in effect gave Jokowi’s Great Indonesia Coalition a parlia -mentary majority for the irst time—it holds 289 of 560 seats in the DPR, against
1. There were also a number of developments at the Corruption Eradication Commission (KPK), most notably the coming before the DPR of the process to appoint ive commission -ers, from a shortlist of eight, for a four-year term. The commission arrested or detained a
number of high-proile bribery suspects, including Gatot Pujo Nugroho, the governor of North Sumatra; Otto Cornelis Kaligis, a prominent lawyer; Patrice Rio Capella, a former
secretary-general of NasDem; Tripeni Irianto Putro, the head of the State Administrative Court in Medan; Partogi Pangaribuan, a director-general of the Ministry of Trade; and
Dewie Yasin Limpo, a legislator from Hanura (People’s Conscience Party).
the 201 held by the Red-and-White Coalition2—but Jokowi still faces resistance from within his own party, PDI–P (Indonesian Democratic Party of Struggle), which did well in the cabinet reshufle (Rizal is close to party chair and former president Megawati, and Pramono was party secretary-general).
Several foreign-policy developments helped to reassert Jokowi’s domestic authority by projecting his presidency on the international stage. A presidential tour of the Middle East in early July was one such opportunity. A visit to the United States in late October to meet with President Obama was another. Meanwhile, Indonesia’s decision to rejoin OPEC, the cartel of oil-producing nations, seemed more about international relations than oil prices. Indonesia left OPEC in 2008, on becoming a net importer of oil. Given that the purpose of a cartel is to raise prices to beneit suppliers at the expense of buyers, and that Indonesia is still a net buyer of oil, if OPEC succeeds then Indonesia may suffer economically. These develop -ments taken as a whole suggest that Jokowi is giving more attention to foreign policy as he enters his second year in ofice.3
MACROECONOMIC DEVELOPMENTS Economic Growth
Few countries have escaped the effects of falling global commodity prices and China’s growth slowdown. Indonesia’s rate of economic growth continues to be lower than the government’s target of 5.3%, but the country is weathering the global storm in the sense that growth has not slowed further. Medium-term growth prospects will be improved if the substantial increase in capital and infrastructure spending allocated in the state budget is realised. This boost to the production– possibility frontier for Indonesia could act as an investment-led Keynesian stimulus, and would mean that Indonesia’s budget reallocations could to some considerable extent counteract the global winds. Indonesia at the very least has wriggle room, thanks to a iscal stimulus that other countries lack.
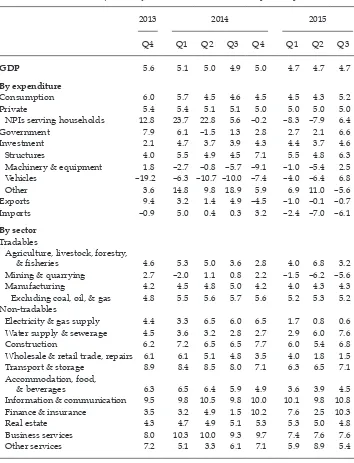
In the third quarter, the Indonesian economy grew by 4.7% (year on year), as it had in the irst and second quarters. This rate of growth sits uneasily with the government’s National Medium-Term Development Plan 2015–2019, which aims for growth of 6.0%–8.0% per year in order to achieve key national goals, such as becoming a high-income country (Bappenas 2014). Economic growth has been slowing since the fourth quarter of 2010, when it peaked at 6.8%. This slowing is visible across almost all sectors (table 1). In the third quarter, economic output in mining and quarrying contracted by 5.6%, much more than in the irst quarter but slightly less than in the second. This is also relected in the data on provincial economic growth; the economies of Aceh, Riau, and East Kalimantan contracted during the second quarter.4
2. The remaining seats belong to the Democratic Party, which has been wavering between joining the Red-and-White Coalition and remaining unaligned.
3. Other events of note for Indonesia’s foreign policy included the replacement in
mid-September of Tony Abbott by Malcolm Turnbull as Australian prime minister, which is thought likely to improve relations between the two countries, and the visit to Indonesia in late July of the UK prime minister, David Cameron.
4. Economic growth in the second quarter of 2015 was weakest in Sumatra and Kalimantan,
where output is dominated by the production of crude oil, gas, coal, and palm oil.
TABLE 1 Components of GDP Growth, 2013–15 (% year on year)
2013 2014 2015
Q4 Q1 Q2 Q3 Q4 Q1 Q2 Q3
GDP 5.6 5.1 5.0 4.9 5.0 4.7 4.7 4.7
By expenditure
Consumption 6.0 5.7 4.5 4.6 4.5 4.5 4.3 5.2
Private 5.4 5.4 5.1 5.1 5.0 5.0 5.0 5.0
NPIs serving households 12.8 23.7 22.8 5.6 –0.2 –8.3 –7.9 6.4
Government 7.9 6.1 –1.5 1.3 2.8 2.7 2.1 6.6
Investment 2.1 4.7 3.7 3.9 4.3 4.4 3.7 4.6
Structures 4.0 5.5 4.9 4.5 7.1 5.5 4.8 6.3
Machinery & equipment 1.8 –2.7 –0.8 –5.7 –9.1 –1.0 –5.4 2.5
Vehicles –19.2 –6.3 –10.7 –10.0 –7.4 –4.0 –6.4 6.8
Other 3.6 14.8 9.8 18.9 5.9 6.9 11.0 –5.6
Exports 9.4 3.2 1.4 4.9 –4.5 –1.0 –0.1 –0.7
Imports –0.9 5.0 0.4 0.3 3.2 –2.4 –7.0 –6.1
By sector
Tradables
Agriculture, livestock, forestry,
& isheries 4.6 5.3 5.0 3.6 2.8 4.0 6.8 3.2
Mining & quarrying 2.7 –2.0 1.1 0.8 2.2 –1.5 –6.2 –5.6
Manufacturing 4.2 4.5 4.8 5.0 4.2 4.0 4.3 4.3
Excluding coal, oil, & gas 4.8 5.5 5.6 5.7 5.6 5.2 5.3 5.2 Non-tradables
Electricity & gas supply 4.4 3.3 6.5 6.0 6.5 1.7 0.8 0.6
Water supply & sewerage 4.5 3.6 3.2 2.8 2.7 2.9 6.0 7.6
Construction 6.2 7.2 6.5 6.5 7.7 6.0 5.4 6.8
Wholesale & retail trade, repairs 6.1 6.1 5.1 4.8 3.5 4.0 1.8 1.5
Transport & storage 8.9 8.4 8.5 8.0 7.1 6.3 6.5 7.1
Accommodation, food,
& beverages 6.3 6.5 6.4 5.9 4.9 3.6 3.9 4.5
Information & communication 9.5 9.8 10.5 9.8 10.0 10.1 9.8 10.8
Finance & insurance 3.5 3.2 4.9 1.5 10.2 7.6 2.5 10.3
Real estate 4.3 4.7 4.9 5.1 5.3 5.3 5.0 4.8
Business services 8.0 10.3 10.0 9.3 9.7 7.4 7.6 7.6
Other services 7.2 5.1 3.3 6.1 7.1 5.9 8.9 5.4
Source: CEIC Indonesia Premium Database.
Note: Calculated on the basis of GDP at 2010 constant prices. NPIs = Non-proit institutions.
In contrast to growth in mining and quarrying, growth in agriculture—signii -cant for 35% of the labour force—was relatively strong in the second and third quarters. Underlying this growth, however, was a shift in planting and harvest times owing to changes in climatic conditions. Some agricultural production thus moved from the irst quarter to the second (BPS 2015a). The growth of the
manufacturing sector in the second and third quarters is still slower than it was in most of 2014. Moreover, economic growth in wholesale and retail trade, one of the most important non-tradable sectors, was only 1.5% in the third quarter, down from 4.0% in the irst quarter and 1.8% in the second. In previous quarters, it was activity in this sector that prevented a greater slowdown in growth. Wholesale and retail trade constitutes 14% of total value added in Indonesia’s GDP (about the same as agriculture). Slow growth in this sector is worrying because it indi-cates weak domestic demand.
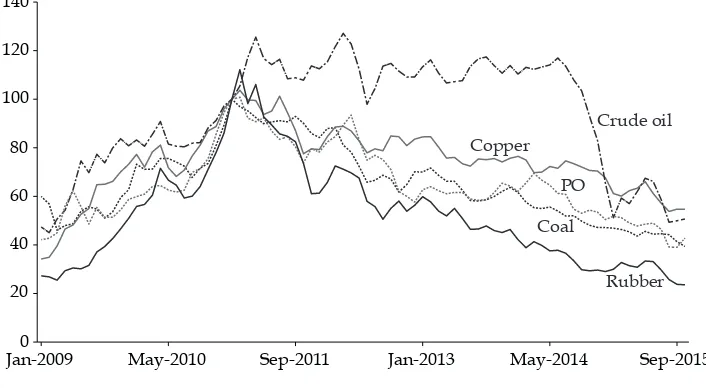
In the second and third quarters, on the expenditure side of GDP, under lying the trends in aggregate economic growth are trends in exports, investment, and government consumption. Indonesia’s export contraction continued, but this trend needs to be viewed in the context of falling global commodity prices and slower growth in China. The global prices of commodities that matter most to the Indonesian economy have been declining since early 2011. Nickel and aluminum, two base metals that serve as indicators of global demand, are close to six-year lows, which is bad news for Indonesia. The primary cause of weak exports was declining commodity prices for Indonesia’s main export commodities—notably, crude oil, palm oil, copper, coal, and rubber (igure 1). In May 2015, Indonesia’s exports to China were half the value of what they were at their peak in December 2013, while Indonesia’s exports to Japan, which have also been on a downward trajectory, were a third of the value of what they were in mid-2011.
Improvements in investment trends in Indonesia over the last year have been constrained by weak investor conidence, itself owing to the weakening of eco -nomic growth prospects. Policy reforms may stimulate investment. In the last few quarters, private consumption, the largest expenditure component of GDP, has been growing slightly faster than GDP itself, and to some extent maintaining eco-nomic growth. BI’s consumer conidence index, however, fell to 99.3 (a negative
FIGURE 1 Index of Selected Commodity Prices, 2009–15
Crude oil Copper
Coal
Rubber PO
Jan-20090 May-2010 Sep-2011 Jan-2013 May-2014 Sep-2015
20 40 60 80 100 120 140
Source: Data from the IMF (2015b).
Note: January 2011 = 100. PO = palm oil.
outlook) in October 2015 from 112.6 (a positive outlook) in August 2015. The index is now at its lowest point since 2010.5 Private consumption remained stable at 5%. The government looked to boost demand by introducing expansionary iscal meas -ures in social policy and by exempting certain goods from luxury taxes. Although the former method is likely to increase household consumption, one could ask whether the latter method is the best way to boost aggregate consumption.
In the third quarter, investment and government consumption picked up because of faster realisation of planned expenditure, after a delay in previous quarters. Government consumption growth jumped to 6.6% (from 2.1% in the second quarter) and investment growth increased to 4.6% (from 3.7%). Imports contracted strongly in the second quarter (by 7.0%) and the third quarter (by 6.1%). In the second quarter, the biggest import contraction was, worryingly, in capital equipment, which fell by 22% in value and 32% in quantity (BI 2015). That said, exports contracted less in the second and third quarters than in the irst.
Inlation, Interest-Rate Policy, and the Exchange Rate
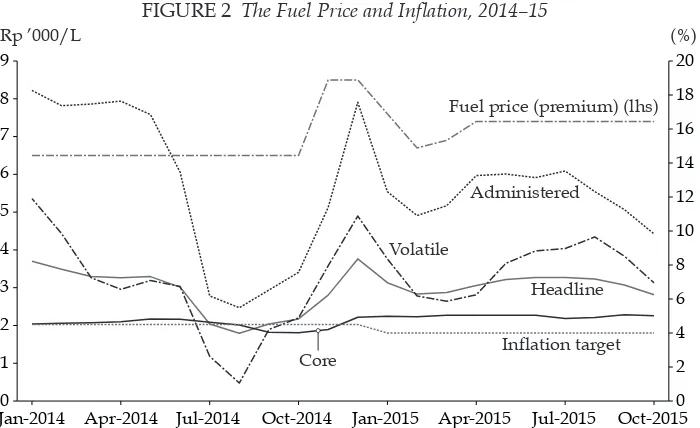
Annual headline inlation has been stable but relatively high, at around 7.0%, since May. In September, however, it fell slightly, to 6.8%, and continued to fall in October, to 6.2%. The increase in fuel prices drove up headline inlation dur -ing February–May. Ris-ing headline inlation dur-ing June–August, however, was triggered by factors unrelated to fuel prices or ‘administered’ inlation (of items less affected by market forces). Although the price of diesel has been cut slightly as part of recent economic policy packages,6 other fuel prices have changed little since April 2015 and, accordingly, administered inlation has been stable. ‘Volatile’ inlation—that is, inlation of prices of items most susceptible to shocks, such as food, fuel, and electricity—was 6.3% in April, climbed to 9.7% in August, but fell back to 7.0% in October (igure 2). The mid-year increase in volatile inlation is likely to have played a major role in raising poverty estimates.
Prices of staple foods have increased rapidly in recent months. The price of rice, for example, rose by 16.2%, year on year, to 1 October, and the price of sugar rose by 13.3% (igure 3). Although core inlation is stable, at around 5.0%, BI has indicated that it will focus on maintaining inancial stability, rather than boosting aggregate demand by reducing interest rates. It lowered its oficial rate slightly in January, to 7.50% (from 7.75%), but has since left it unchanged. It is entirely pos-sible for base money to expand even when interest rates are constant or rising, yet BI has insisted on maintaining its position on rates—despite slowing growth— because of the risk of capital outlow and its impact on the already weakened rupiah.7 In the year to September, the rupiah depreciated against the US dollar by
5. This index surveys 4,600 middle-class households in major cities, representing an esti-mated 80% of GDP. An index score above 100 indicates an improving outlook and a score below 100 indicates a worsening outlook.
6. The recent adjustment in the price of diesel fuel, by Rp 200, or 3.0%, was part of the third
of ive economic policy packages announced by the government in September and October.
7. BI also uses other measures to maintain a stable exchange rate. It issued, for exam-ple, Regulation 17/3/PBI/2015 and Circular Letter 17/11/DKSP/2015, which obligate traders to use the rupiah in quotes for the provision of goods and services (Tempo, 2 July
2015). It is uncertain how these measures will reduce the rupiah’s volatility.
FIGURE 2 The Fuel Price and Inlation, 2014–15
Fuel price (premium) (lhs)
Administered
Volatile
Headline
Core Inflation target
(%) Rp ’000/L
Jan-2014 Apr-2014 Jul-20140 Oct-2014 Jan-2015 Apr-2015 Jul-2015 Oct-2015 1
2 3 4 5 6 7 8 9
0 2 4 6 8 10 12 14 16 18 20
Source: CEIC Indonesia Premium Database.
FIGURE 3 Price Index of Selected Staples, 2014–15
Chicken Egg
Beef Sugar Rice
Oct-201485 Dec-2014 Feb-2015 Apr-2015 Jun-2015 Aug-2015 Oct-2015 90
95 100 105 110 115 120 125
Source: Data from the Ministry of Trade (2015).
Note: 1 October 2014 = 100.
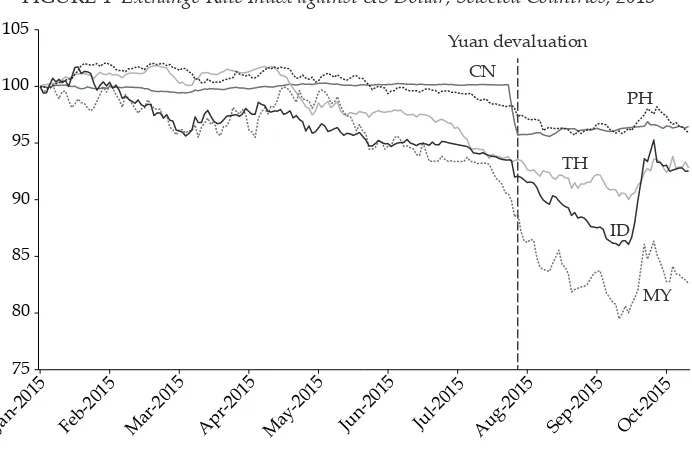
FIGURE 4 Exchange-Rate Index against US Dollar, Selected Countries, 2015
MY ID TH CN
PH Yuan devaluation
Jan-2015 Feb-2015 Mar-2015 Apr-2015 May-2015 Jun-2015 Jul-2015 Aug-2015 Sep-2015 Oct-2015
75 80 85 90 95 100 105
Source: Data from the IMF (2015a).
Note: 6 January 2015 = 100. CN = China. PH = Philippines. TH = Thailand. ID = Indonesia. MY = Malaysia.
around 14% (igure 4). On 28 August, the nominal exchange rate exceeded the so-called psychological threshold of Rp 14,000 per dollar (there is no evidence to sup-port such a threshold, other than its association with the 1997–98 Asian inancial crisis). Slowing growth and a weakening outlook for Indonesia have lowered mar-ket expectations and weakened the rupiah, which is also burdened by the large outstanding external debt held by corporate borrowers. As the rupiah depreci-ates, the servicing costs of external debts increase. Indonesian corporate debt has doubled since 2010, reaching $170 billion in August 2015. A quarter of this amount is short-term borrowing with a maturity of under one year and—worryingly, if the rupiah depreciates further—with 96% held in foreign currency. In total, it is estimated that Indonesian companies have $42 billion in foreign-currency loans to roll over in the next 12 months. Foreign debt held by local developers is a particu-lar concern, as it is denominated in US dolparticu-lars and the fall of the rupiah has left much hedged debt unprotected (Financial Times, 4 Oct. 2015). On reaching 14,700
per US dollar in early October, its lowest level ever, the rupiah started to rebound (along with other currencies), after the US Federal Reserve hinted that it would continue to hold rates at a low level while economic growth in the United States remained in a risky phase. By 9 October 2015, the rupiah had returned to the level it was before China devalued its currency. Some argue that the announcement in September of the government’s second economic policy package also contributed to the rebound (MetroTVNews.com, 10 Oct. 2015).
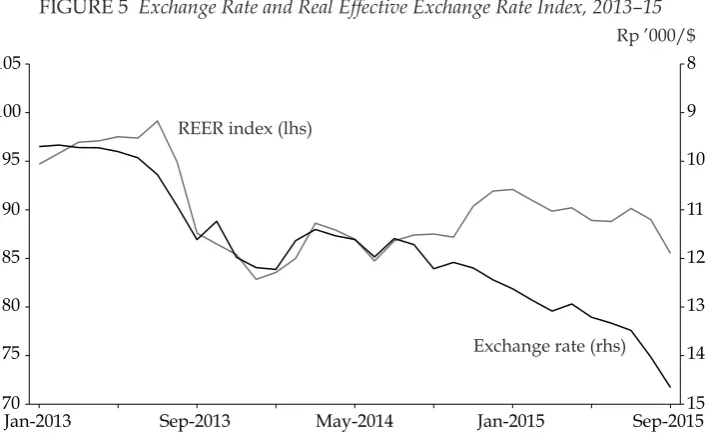
Exchange-rate depreciations can be good for economic growth if they generate an export boom. Until June 2014, the nominal exchange rate was highly correlated with the real exchange rate (igure 5). From June 2014 to January 2015, however, the depreciation of the nominal exchange rate was followed by an appreciation of the
FIGURE 5 Exchange Rate and Real Effective Exchange Rate Index, 2013–15
REER index (lhs)
Exchange rate (rhs)
Rp ’000/$
Jan-2013 Sep-2013 May-2014 Jan-2015 Sep-2015
70 75 80 85 90 95 100 105
15 14 13 12 11 10 9 8
Source: CEIC Indonesia Premium Database.
Note: 2010 = 100. REER = real effective exchange rate.
real effective exchange rate, because the currencies of almost all Indonesia’s main trading partners also depreciated against the US dollar. As a result, Indonesia’s exports did not become more competitive. Indonesia’s real effective exchange rate has recently begun to depreciate, however, which may stimulate exports and pro-vide a much-welcome boost to economic growth.
Fiscal Policy
Fiscal policy is likely to be important for economic stimulus in the immediate future, given global events and their downward pull on growth. The revised 2015 budget (table 2) includes a projected increase of almost 20% in tax revenues; a decrease of 61% in energy subsidies, which would save the government more than Rp 200 trillion; an increase of Rp 115 trillion in capital expenditure; and a reduction of the iscal deicit from 2.3% to 1.9% of GDP, well below the legal limit (3.0% of GDP).8 In the irst three-quarters of the year, however, the budget’s implementation was hampered by poor revenue collection and spending.
The government’s tax-revenue target is deliberately ambitious, owing largely to an expected decline in oil and gas revenue. By September, the government had reached only 54% of its target for overall tax-revenue and 47% of its target for value-added-tax revenue (which is closely linked to economic growth), com-pared with 65% and 59%, respectively, last September. Yet nominal tax revenues have started to grow, year on year, and it is important to look at the budget from
8. The 3.0% igure refers to the consolidated deicit (which includes subnational deicits).
Since the regions have been running high surpluses, the central government could book
an even larger deicit.
another perspective: that the new government was aware that oil and gas rev-enue would decline owing to falling commodity prices and lowered its target accordingly.
On the spending side, fuel subsidies are still large—contrary to popular percep -tions that they had been eliminated. By September, 63% of the total government budget line had been spent, compared with 66% last year. That said, although capital expenditure in this year’s budget increased by 71% on last year’s budget, only 28% of the capital-spending budget line had been spent by September 2015
TABLE 2 Budgets for 2014 and 2015 (Rp trillion)
2014 2015
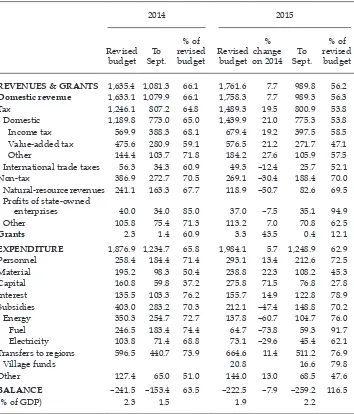
REVENUES & GRANTS 1,635.4 1,081.3 66.1 1,761.6 7.7 989.8 56.2
Domestic revenue 1,633.1 1,079.9 66.1 1,758.3 7.7 989.3 56.3
Tax 1,246.1 807.2 64.8 1,489.3 19.5 800.9 53.8
Domestic 1,189.8 773.0 65.0 1,439.9 21.0 775.3 53.8
Income tax 569.9 388.3 68.1 679.4 19.2 397.5 58.5
Value-added tax 475.6 280.9 59.1 576.5 21.2 271.7 47.1
Other 144.4 103.7 71.8 184.2 27.6 105.9 57.5 International trade taxes 56.3 34.3 60.9 49.3 –12.4 25.7 52.1
Non-tax 386.9 272.7 70.5 269.1 –30.4 188.4 70.0
Natural-resource revenues 241.1 163.3 67.7 118.9 –50.7 82.6 69.5
Proits of state-owned
enterprises 40.0 34.0 85.0 37.0 –7.5 35.1 94.9
Other 105.8 75.4 71.3 113.2 7.0 70.8 62.5
Grants 2.3 1.4 60.9 3.3 43.5 0.4 12.1
EXPENDITURE 1,876.9 1,234.7 65.8 1,984.1 5.7 1,248.9 62.9
Personnel 258.4 184.4 71.4 293.1 13.4 212.6 72.5
Material 195.2 98.3 50.4 238.8 22.3 108.2 45.3
Capital 160.8 59.8 37.2 275.8 71.5 76.8 27.8
Interest 135.5 103.3 76.2 155.7 14.9 122.8 78.9
Subsidies 403.0 283.2 70.3 212.1 –47.4 148.8 70.2
Energy 350.3 254.7 72.7 137.8 –60.7 104.7 76.0
Fuel 246.5 183.4 74.4 64.7 –73.8 59.3 91.7
Electricity 103.8 71.4 68.8 73.1 –29.6 45.4 62.1
Transfers to regions 596.5 440.7 73.9 664.6 11.4 511.2 76.9
Village funds 20.8 16.6 79.8
Other 127.4 65.0 51.0 144.0 13.0 68.5 47.6
BALANCE –241.5 –153.4 63.5 –222.5 –7.9 –259.2 116.5
(% of GDP) 2.3 1.5 1.9 2.2
Source: CEIC Indonesia Premium Database.
Note: Discrepancies are due to rounding.
(compared with 37% by September 2014). In nominal terms, Rp 77 trillion of capi-tal spending had been realised by September 2015, compared with Rp 60 trillion by September 2014. The government plans to spend as much as Rp 276 trillion on capital expenditure this year. If realised, it would be the largest annual increase in planned capital expenditure in Indonesia’s history. Even if the inal realisation of the planned capital expenditure in the budget is low, it will still be a substantial amount, which will be positive for Indonesia’s medium-term growth prospects. It is also usual, though not optimal, for more than half of capital spending to be real-ised towards the end of the year. One also needs to allow time for a new adminis -tration to settle into government. The slow realisation of spending is partly due to a protracted process of parliamentary approval and the reorganisation of govern-ment agencies. In Indonesia, in general, signiicant spending starts in the second quarter. The slow realisation of spending has, however, delayed the disbursement of cash compensation intended to protect the poor from the impact of the fuel-subsidy reform. This has contributed to a rise in poverty. One positive indication that infrastructure spending has begun in earnest was the 17% jump in August in annual cement production.
Balance of Payments
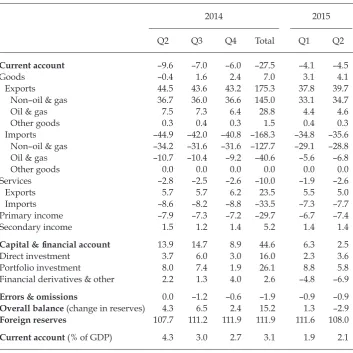
Indonesia’s trade balance showed a $4.1 billion surplus in the second quarter (in contrast to a year ago, when it was in deicit), largely because of much lower lev -els of merchandise imports in the irst and second quarters (table 3). The decline in imports is mainly due to a large decline in the value of oil and gas imports. To some extent, the reduction in oil imports can be attributed to domestic fuel-price reform. Oil and gas imports in the second quarter were $6.8 billion, compared with $10.7 billion in the same quarter in 2014 (before the domestic fuel-price adjustment was implemented in November 2014). Non–oil and gas imports, however, also recorded lower values than they did in the same quarter last year. This indicates at least two things: that the exchange-rate depreciation has had an effect, and that investment and production activities have slowed because Indonesian imports predominantly comprise capital goods and raw materi-als. Foreign-exchange reserves declined by $3.6 billion in the second quarter but remain healthy, at $108 billion. BI noted that the decline in foreign reserves was a result of the government’s foreign-debt repayments. BI also acknowl -edged that some of these reserves were used to support the rupiah. In nominal terms, exports of goods rose owing largely to non–oil and gas exports, which is encouraging.
There was a notable change in the second quarter in the overall net inancial account, which recorded only $2.5 billion of net capital inlows. The overall cur -rent account deicit is $4.5 billion, while the overall deicit is $2.9 billion. The decline in net capital inlows during the second quarter was due in part to lower portfolio-investment inlows and large capital outlows. Portfolio investment fell by $3.0 billion in the second quarter because of large net sales of domestic stock by foreign investors and because of relatively low levels of foreign acquisition of government bonds (BI 2015). Capital outlows included negative ‘other invest -ment’ of $6.9 billion, driven mainly by lower levels of new corporate external debt (owing to economic uncertainty and weaker growth prospects) and the payment of outstanding corporate and government debts.
TABLE 3 Balance of Payments, 2014–15 ($ billion)
2014 2015
Q2 Q3 Q4 Total Q1 Q2
Current account –9.6 –7.0 –6.0 –27.5 –4.1 –4.5
Goods –0.4 1.6 2.4 7.0 3.1 4.1
Exports 44.5 43.6 43.2 175.3 37.8 39.7
Non–oil & gas 36.7 36.0 36.6 145.0 33.1 34.7
Oil & gas 7.5 7.3 6.4 28.8 4.4 4.6
Other goods 0.3 0.4 0.3 1.5 0.4 0.3
Imports –44.9 –42.0 –40.8 –168.3 –34.8 –35.6
Non–oil & gas –34.2 –31.6 –31.6 –127.7 –29.1 –28.8
Oil & gas –10.7 –10.4 –9.2 –40.6 –5.6 –6.8
Other goods 0.0 0.0 0.0 0.0 0.0 0.0
Services –2.8 –2.5 –2.6 –10.0 –1.9 –2.6
Exports 5.7 5.7 6.2 23.5 5.5 5.0
Imports –8.6 –8.2 –8.8 –33.5 –7.3 –7.7
Primary income –7.9 –7.3 –7.2 –29.7 –6.7 –7.4
Secondary income 1.5 1.2 1.4 5.2 1.4 1.4
Capital & inancial account 13.9 14.7 8.9 44.6 6.3 2.5
Direct investment 3.7 6.0 3.0 16.0 2.3 3.6
Portfolio investment 8.0 7.4 1.9 26.1 8.8 5.8
Financial derivatives & other 2.2 1.3 4.0 2.6 –4.8 –6.9
Errors & omissions 0.0 –1.2 –0.6 –1.9 –0.9 –0.9
Overall balance (change in reserves) 4.3 6.5 2.4 15.2 1.3 –2.9
Foreign reserves 107.7 111.2 111.9 111.9 111.6 108.0
Current account (% of GDP) 4.3 3.0 2.7 3.1 1.9 2.1
Source: CEIC Indonesia Premium Database.
Note: Discrepancies are due to rounding.
Macroeconomic Policy
Declining commodity prices and a slowdown in China are the immediate causes of slower economic growth in Indonesia, but underlying problems remain. During the Yudhoyono years, growth was based on a commodity boom—as Sadli’s Law argues, good times may produce bad policies(Hill and Thee 2008, 154)—and almost no signiicant reforms were introduced before the end of the boom.
Jokowi faces three structural problems that have hindered economic devel-opment in Indonesia since the 1997–98 Asian inancial crisis: low infrastructure investment, weak manufacturing performance, and weak growth in foreign direct investment. These were all major drivers of structural change prior to the late 1990s. Infrastructure investment is still only half of what it was before the crisis, and is lower than that of other high-performing Asian economies. Indonesia’s manufacturing performance has become less competitive since the crisis and a process of premature deindustrialisation may have begun, if one considers the
proportion of manufacturing value added in GDP and the proportion of employ-ment in manufacturing (See Rodrik 2015 for a discussion). Indonesia, unlike many of its neighbours, has yet to take advantage of global value chains; manufacturing has been held back by labour-market policies and low levels of labour produc-tivity (Hill and Aswicahyono 2014). Foreign direct investment, meanwhile, has been hindered by bureaucracy and economic nationalism, though no more than in some other middle-income developing countries.
Against this backdrop, we evaluate to what extent the new economic policies, the fuel-subsidy reform, and the cabinet reshufle can address these structural problems that hinder industrialisation. One of the most important economic pol -icies of the Jokowi government has been the fuel-subsidy reform (see Damuri and Day 2015). By reallocating the fuel subsidy, Indonesia was in a position to increase government capital spending (mostly in infrastructure) by 70% in the 2015 planned budget—an important aspect of Jokowi’s medium-term economic strategy. Capital investment is likely to make a difference, though more so in the medium term.
Jokowi’s politically bold reshufle of economic ministers in August seems to have already had an impact; in September and October, the government announced ive economic policy packages. They include revising more than 130 regulations deemed detrimental to businesses; simplifying the application cess for investment permits and planning permits, land acquisitions, and pro-curement; accelerating strategic projects; creating a new village fund to inance a cash-for-work program; extending the subsidised Rice for the Poor (Raskin) program from 12 months to 14 months; supplying new subsidised credit, via cooperatives, to support small and medium enterprises in rural areas; raising the tax-free threshold to a level that will cover most unskilled workers; revising corporate tax policy and introducing tax holidays of up to 20 years (which may later erode tax revenue); supporting the operational costs of domestic industries by reducing the prices of fuel, electricity, and gas (which may in the irst instance seem contrary to fuel-subsidy reform but—so far at least—relates only to the price of diesel and, given the state of the economy, is not unreasonable as a tem-porary measure); changing how the minimum wage is set; and introducing a set of inancial reforms.
Judging by the components of the packages, these measures are intended to raise domestic public and private and international investment by cutting bureaucratic procedures, reducing operational costs, and providing tax breaks; to stimulate domestic demand by providing subsidised credit to households and small and medium enterprises as well as by accelerating the village fund; to help industries import raw and capital goods and give iscal incentives for exports; to reduce inancial volatility, particularly exchange-rate volatility; and to make minimum-wage adjustments more predictable by overhauling the cur-rent regime (in which setting minimum wages involves negotiating with labour unions, district leaders, and industry). The ifth package, in late October, covers three areas of deregulation. It obligates companies to revalue their assets in light of inlation and the rupiah devaluation; this is expected to improve performance by giving irms a better understanding of their assets and debts. It eliminates double taxation for investment funds in real estate, property, and infrastructure, with the aim of attracting funds to Indonesia’s capital market. It also attempts to
simplify the regulatory and licensing procedures for Sharia banking and inance products.
Will these policies boost the economy? It seems there is something for every-one. International investors will beneit from less bureaucracy and from shorter processing times for investment permits. The domestic business sector will welcome the introduction of credit for small and medium enterprises and the increased support for the operational costs of domestic industries. The manufac-turing labour force may see minimum wages rise at a slower rate, although many workers will no longer pay income tax. The poor will beneit from increased con -sumption, thanks to additional funding for the government’s cash-for-work and Raskin programs. The policy packages are comprehensive, but questions remain about their transformative power and how they will reinvigorate the manufactur-ing sector, which has historically been the engine of Indonesia’s economic devel -opment and growth. The fourth package, which changes how minimum wages will be set, may go some way in this direction. From January 2016, a new wage formula will aim to give more certainty to businesses and workers. It will calcu-late changes to the annual minimum wage in each province by pegging increases to inlation and GDP growth. Workers will then be guaranteed to see their real wages improve during periods of economic growth.
These policy packages are Jokowi’s irst substantial set of reforms. Of course, their effectiveness in stimulating the economy will depend on the nature and extent of their implementation and what happens outside Indonesia in terms of China’s growth and commodity prices. If even half of these policies are put in place, the impact on the economy, in both the short and medium term, should be tangible.
POVERTY AND INEQUALITY UNDER JOKOWI Distribution and Economic Growth
Jokowi’s election platform and his previous policies as mayor of Solo and gover -nor of Jakarta suggest that he has a speciic interest in improving the living stand -ards of the poorest and raising people out of poverty. These objectives require policies on growth and, often, short-run transfers, as well as changes to social policy and entitlements. They can also require greater medium-term investment in education and health care, for example, to redistribute the beneits of economic growth and create opportunities. The question of which part of Indonesian soci-ety has beneited most from economic growth and trends in inequality during democratisation was raised in mid-2014, during the presidential campaign, not only because Jokowi was known for enacting speciic social policies as mayor and governor but also because of his humble background. During the campaign, he came to be viewed as a pro-poor igure.
Questions about the distribution of economic growth are increasingly viewed in the development literature as an instrumental concern. In particular, they relate to mathematical identity: that high or rising income (or consumption) inequality is associated with lower rates of poverty reduction at any given poverty line. The ongoing debate in the econometrics literature on the relation between inequal-ity and growth received a detailed review in Cunha Neves and Tavares Silva’s (2014) article. Although numerous methodological issues remain, an emerging
consensus is that inequality may support growth at low levels of average income, but rising or high inequality can hamper growth at the middle level. Brueckner and Lederman (2015), for example, found that, on average, if the Gini, a com-mon measure of inequality, rises by one percentage point, GDP per capita will fall by 1.1% over ive years. Importantly, however, they also found that increases in inequality raise GDP per capita in low-income countries but reduce it in middle-income countries. For these reasons, there is an instrumental case for governments in middle-income countries such as Indonesia to—at a minimum—be concerned about rapid and substantial rises in inequality, owing to the potential impact of these rises on future growth and the rate of poverty reduction.9
Such matters resonate with the government’s National Medium-Term Devel -opment Plan in that, for the irst time, an explicit target for the Gini co eficient, of 0.36 in 2019 (it is now 0.41), has been set alongside the target for a national poverty rate, of 7%–8% by 2019. The government will look to reach these targets by creat-ing employment, providcreat-ing basic services, and implementcreat-ing social-protection policies (Bappenas 2014). One causal mechanism for reducing inequality is the attempt to improve human capital and, in doing so, raise the future incomes of those at the lower end of the distribution. In the shorter term, generating employ-ment and introducing direct-transfer policies as part of the social policy and wel-fare regime are likely to address inequality.
It is commonly thought that Indonesia’s Gini is low. This is the case if one takes at face value the consumption Gini from the National Socio-economic Survey (Susenas) data and compares it internationally. However, the mismatch between the Susenas data and the national accounts suggests that Susenas may be weak at capturing top incomes; Susenas reports that only approximately 10% of Indonesians consumed more than $10 per day in 2012 (in 2011 purchasing-power-parity [PPP] dollars) (Edward and Sumner 2015). Further, Indonesia’s Gini is based on consumption inequality, so adjusting consumption to income would raise inequality estimates considerably (see Lahoti, Jahadev, and Reddy 2014). And adjusting the estimate of inequality using the taxation data of top incomes shows that the share of income to the richest is generally much greater in Indonesia than in other countries (see Leigh and Van der Eng 2009) and chal -lenges the perception that Indonesia is relatively egalitarian.
Indonesia is also well known for its record on poverty reduction, but its national poverty line is one of the lowest in the world—comparable, in PPP dollars, to those of the poorest countries of sub-Saharan Africa—despite GDP per capita in Indonesia of $10,500 (in 2011 PPP dollars). As is well documented, many people in Indonesia live not far above the national poverty line; median consumption, using Susenas data, in Indonesia in 2012 was approximately $4 per day, in 2011 PPP dollars (Edward and Sumner 2015). Perhaps a quarter to half of the popula -tion are therefore potentially vulnerable to falling back into poverty if, for exam-ple, growth slows or rice prices spike, as has happened recently.
9. In a similar vein, Dabla-Norris et al. (2015, 6–7) showed that a higher net Gini is associated with lower output growth in the medium term, and found an inverse relation between eco-nomic growth and the national income share of the rich. They also found that as the income
share of the richest quintile increases, GDP slows in the following ive years. Conversely, an
increased share of national income to the poorest quintile increases future growth.
In light of the above, what has happened to inequality and poverty since Jokowi’s inauguration? Of course, little over a year has passed, so our assessment is necessarily preliminary.10 Much may depend on the distributional impacts of the re allocation of highly regressive fuel subsidies to infrastructure and social spend-ing and what happens to the price of staple foods such as rice. For this reason, we consider the social policies that are likely to have medium-term impacts on poverty and inequality, as well the outcomes based on data available in the second quarter.
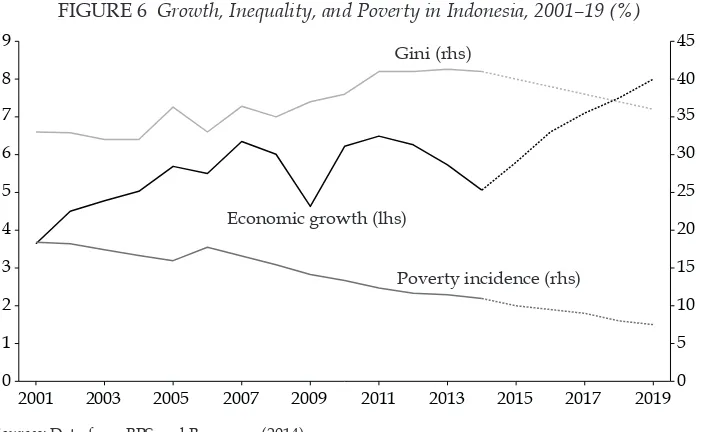
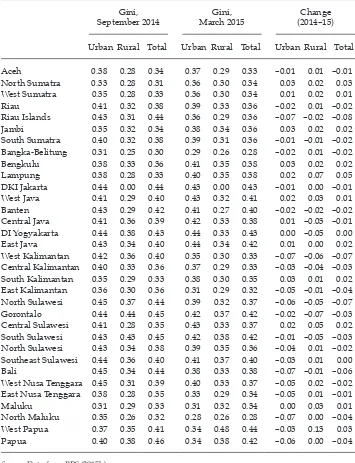
The new president inherited consumption inequality that was on an upward path (at least to 2011), slowing GDP growth, and a slowing rate of poverty reduc-tion (igure 6). New data released in the second quarter point towards stable inequality but stagnant poverty reduction. From September 2014 to March 2015, Indonesia’s Gini coeficient remained at 0.41 (where it has been since 2011, after having risen from 0.33 in 2001). This change in the trend coincided with the end of the commodity boom and suggested that growth driven by commodity prices may have been the main cause of Indonesia’s increasing inequality. Commodities such as oil, gas, and coal are capital-intensive, so this hypothesis has a theoretical logic. The Gini coeficient in urban areas remained at 0.43; in rural areas, it fell by a small amount, from 0.34 in September 2014 to 0.33 in March 2015. The Gini increased in 13 provinces (table 4) but decreased in 20, suggesting considerable variation.
New Poverty Data
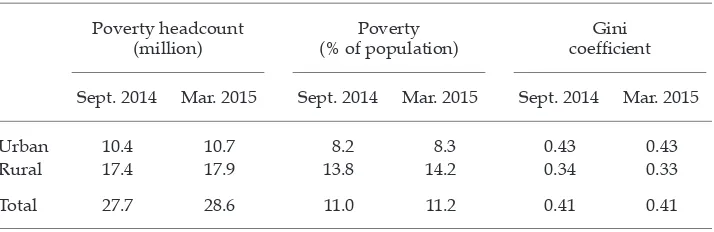
Recent data from Badan Pusat Statistik (BPS 2015b), Indonesia’s central statis -tics agency, reported a rise in the poverty headcount of almost 1.0 million peo-ple, from 27.7 million to 28.6 million, or from 11.0% of the population to 11.2%,
10. At the time of writing, the latest Susenas raw data were not available, preventing us from comparing the growth incidence curve under Jokowi with that of the Yudhoyono era.
FIGURE 6 Growth, Inequality, and Poverty in Indonesia, 2001–19 (%)
2001 2003 2005 2007 2009 2011 2013 2015 2017 2019
0
Sources: Data from BPS and Bappenas (2014).
Note: The dashed lines are the targets in the National Medium-Term Development Plan 2015–2019.
TABLE 4 Gini Coeficient by Province, September 2014 and March 2015
Gini, September 2014
Gini, March 2015
Change (2014–15)
Urban Rural Total Urban Rural Total Urban Rural Total
Aceh 0.38 0.28 0.34 0.37 0.29 0.33 –0.01 0.01 –0.01
North Sumatra 0.33 0.28 0.31 0.36 0.30 0.34 0.03 0.02 0.03
West Sumatra 0.35 0.28 0.33 0.36 0.30 0.34 0.01 0.02 0.01
Riau 0.41 0.32 0.38 0.39 0.33 0.36 –0.02 0.01 –0.02
Riau Islands 0.43 0.31 0.44 0.36 0.29 0.36 –0.07 –0.02 –0.08
Jambi 0.35 0.32 0.34 0.38 0.34 0.36 0.03 0.02 0.02
South Sumatra 0.40 0.32 0.38 0.39 0.31 0.36 –0.01 –0.01 –0.02
Bangka-Belitung 0.31 0.25 0.30 0.29 0.26 0.28 –0.02 0.01 –0.02
Bengkulu 0.38 0.33 0.36 0.41 0.35 0.38 0.03 0.02 0.02
Lampung 0.38 0.28 0.33 0.40 0.35 0.38 0.02 0.07 0.05
DKI Jakarta 0.44 0.00 0.44 0.43 0.00 0.43 –0.01 0.00 –0.01
West Java 0.41 0.29 0.40 0.43 0.32 0.41 0.02 0.03 0.01
Banten 0.43 0.29 0.42 0.41 0.27 0.40 –0.02 –0.02 –0.02
Central Java 0.41 0.36 0.39 0.42 0.33 0.38 0.01 –0.03 –0.01
DI Yogyakarta 0.44 0.38 0.43 0.44 0.33 0.43 0.00 –0.05 0.00
East Java 0.43 0.34 0.40 0.44 0.34 0.42 0.01 0.00 0.02 West Kalimantan 0.42 0.36 0.40 0.35 0.30 0.33 –0.07 –0.06 –0.07 Central Kalimantan 0.40 0.33 0.36 0.37 0.29 0.33 –0.03 –0.04 –0.03
South Kalimantan 0.35 0.29 0.33 0.38 0.30 0.35 0.03 0.01 0.02
East Kalimantan 0.36 0.30 0.36 0.31 0.29 0.32 –0.05 –0.01 –0.04 North Sulawesi 0.45 0.37 0.44 0.39 0.32 0.37 –0.06 –0.05 –0.07
Gorontalo 0.44 0.44 0.45 0.42 0.37 0.42 –0.02 –0.07 –0.03
Central Sulawesi 0.41 0.28 0.35 0.43 0.33 0.37 0.02 0.05 0.02
South Sulawesi 0.43 0.43 0.45 0.42 0.38 0.42 –0.01 –0.05 –0.03
North Sulawesi 0.43 0.34 0.38 0.39 0.35 0.36 –0.04 0.01 –0.02
Southeast Sulawesi 0.44 0.36 0.40 0.41 0.37 0.40 –0.03 0.01 0.00
Bali 0.45 0.34 0.44 0.38 0.33 0.38 –0.07 –0.01 –0.06
West Nusa Tenggara 0.45 0.31 0.39 0.40 0.33 0.37 –0.05 0.02 –0.02
East Nusa Tenggara 0.38 0.28 0.35 0.33 0.29 0.34 –0.05 0.01 –0.01
Maluku 0.31 0.29 0.33 0.31 0.32 0.34 0.00 0.03 0.01
North Maluku 0.35 0.26 0.32 0.28 0.26 0.28 –0.07 0.00 –0.04
West Papua 0.37 0.35 0.41 0.34 0.48 0.44 –0.03 0.13 0.03
Papua 0.40 0.38 0.46 0.34 0.38 0.42 –0.06 0.00 –0.04
Source: Data from BPS (2015b).
Note: No data are available for Indonesia’s newest province, North Kalimantan, established in 2012.
between September 2014 and March 2015 (table 5).11 The surprise is not that pov-erty rose slightly as a proportion of the population but that povpov-erty did not fall even though economic growth was close to 5%. There are at least four reasons for
11. Using the March 2015 national poverty line of Rp 330,776 per person per month.
TABLE 5 BPS Estimates of Poverty and Inequality in Indonesia
(September 2014 and March 2015)
Poverty headcount (million)
Poverty (% of population)
Gini
coeficient
Sept. 2014 Mar. 2015 Sept. 2014 Mar. 2015 Sept. 2014 Mar. 2015
Urban 10.4 10.7 8.2 8.3 0.43 0.43
Rural 17.4 17.9 13.8 14.2 0.34 0.33
Total 27.7 28.6 11.0 11.2 0.41 0.41
Source: Data from BPS (2015b).
this: economic growth was slowing; food prices rose, most notably the price of rice; farmers’ real wages fell slightly; and the disbursement of fuel-price compen -sation through the Family Welfare Savings Program (PSKS) was delayed.
Looking ahead, the prospects for poverty reduction remain mixed at best. Macroeconomic circumstances are likely to weigh heaviest on the poorer end of the distribution, although they can be countered by effective infrastructure spend-ing and social spendspend-ing (also see box 1). Many of Indonesia’s poorest people work in agriculture, so the fact that the real wages of farmers are stagnant or declining is of importance. The real wages of farmers declined from Rp 38,144 per day in January to Rp 37,855 per day in September.12 During the same period, the real wages of construction workers, a representative urban real wage, also declined slightly, from Rp 66,114 per day to Rp 66,000 per day.
Rising Commodity Prices and Anti-import Policies
The rise in prices of staple foods, particularly rice, has played a role in the increase in the poverty incidence. The share of rice in a poor household’s consumption basket is substantial in rural areas, in particular, and most of the rural population are net consumers of rice (McCulloch 2008). The share of rice in the poverty line is 23% in urban areas and 33% in rural areas (BPS 2015b). The poverty incidence increased by 0.45% in rural areas and by 0.13% in urban areas.
Given the large share of rice in the poverty line (and the sensitivity of poverty estimates to changes in the poverty line) a small increase in rice prices could lead to a substantial increase in the poverty incidence.13 The price of rice reached its peak in March, when BPS was conducting the latest Susenas survey. The price increased by around 16% over six months, owing largely to a drought that started in January and peaked in July (Republika, 13 Sept. 2015). The worst affected areas were among the biggest suppliers of national rice production, and included districts in West Java, Central Java, and South Sumatra. The government’s import
12. In constant 2012 prices (http://bps.go.id/linkTabelStatis/view/id/1465).
13. Our simulation, using Susenas data, suggests that for every 1% increase in the price of
rice, the national poverty headcount will increase by more than 1% (with other factors held constant).
controls were also partly responsible, because the shortage of rice could have been predicted and rice imports could have held down rice prices.
Warr and Yusuf (2014) found that Indonesia’s rice-import restrictions, which have been in place since 2004, have imposed large and long-run increases in both domestic rice prices and the poverty incidence. The poverty incidence increased more among rural than urban people, even though higher agricultural prices mean higher incomes for many of the rural poor. Gains to poor farmers were
BOX 1 Go-Jek: A New Model for Growth?
In 2015, in Jakarta, Bandung, Surabaya, Denpasar, and Makassar, among other large cities in Indonesia, several new motorcycle-taxi referral services emerged, including GrabBike and, most notably, Go-Jek. These services differ greatly from traditional motorcycle-taxi services, or ojek. For one, they use smartphone applications to connect drivers with passengers. Passengers know in advance, via their smartphone, the price that they will pay for their trip, and drivers spend less time waiting for passengers.
Go-Jek’s business model appeals greatly to potential drivers, although it is
labour-intensive and rewards drivers who are willing to work long hours. In an economy
like Indonesia’s, where unskilled labour is still abundant, it is important that
labour-intensive activities provide inclusive economic growth. Go-Jek drivers get 80% of the revenues from its services and receive a free uniform and helmet. They can also pay for a smartphone in instalments. Motorcycles are relatively affordable; a driver can buy one on credit, earn around $200 a month, and make repayments of around $30 a month. Go-Jek also offers services other than basic transport. With the cooperation of cer-tain restaurants, consumers can order food on their smartphones and pay the Go-Jek driver who delivers their order. Go-Jek offers similar services for grocery shopping.
In general, the variety and quality of Go-Jek’s services are superior to those offered by
traditional ojek drivers. Customers can also use their smartphones to rate their Go-Jek
driver’s performance—drivers with higher ratings are likely to attract more passen -gers and therefore make more money—which gives drivers the incentive to improve.
In October, Go-Jek reported that its smartphone application had been downloaded at
least 6.1 million times, and that it had amassed 200,000 active drivers since its launch in January (Jakarta Post, 24 Oct. 2015).
The emergence and rapid growth of Go-Jek and similar companies cannot be sepa-rated from the macroeconomic aspects of development. The challenges presented by recent rapid urbanisation in Indonesia have never been greater, and more than half the country has been urbanised. Yet economic growth and rising prosperity have not been distributed equally; inequality in Indonesian cities is high and rising. For mil-lions of internal migrants, moving to the cities does not necessarily improve their livelihoods (Manning and Pratomo 2013). Recent data suggest that during 2006–11,
poverty increased in two of every ive cities that experienced economic growth (authors’ calculation using data from the World Bank [2015]).
Despite Indonesia’s relatively low unemployment rate, its large cities continue
to record high rates of informal employment, involuntary underemployment, and youth unemployment. In Jakarta, for example, in 2014, BPS recorded around 1 million informal workers, 121,000 involuntary underemployed workers and at least 260,000 unemployed youth. Go-Jek may not be the solution to underemployment and a lack of reliable public transport in large Indonesian cities, but it is providing short-term opportunities in urban areas where job opportunities are few and where employers offer low wages.
outweighed by the losses incurred by the large number of rural poor who are net buyers of food, and the fact that food represents a large share of their total budg-ets (even larger, on average, than for the urban poor). The main beneiciaries of higher food prices are not the rural poor but the owners of agricultural land and capital, many of whom are based in urban areas.
During the early months of the new administration, anti-import policies were very visible. Statements from some high-level government oficials, including the president, indicated that the ability to control imports tightly is considered one indicator of a government’s success (MetroTVnews.com, 29 Feb. 2015). Jokowi also said that rent-seeking groups and organised-crime networks escalate prices in order to press the government to import rice. It is the rice-import ban, how-ever, that has created room for rent-seeking activities, which, during the irst half of 2015, made Indonesian rice prices at least 64% higher than international prices (Marks 2015). Rising anti-import policies were also part of a self-suficiency agenda that supported Jokowi’s political platform. Law 13/2010 on Horticulture, created during the Yudhoyono government, was the basis of a ive-year blue -print for 2010–14 from the Ministry of Agriculture. This law targets, among other things, self-suficiency in ive commodities: rice, sugar, soybean, beef, and corn (Patunru and Rahardja 2015).
Another policy also contributed to the rising poverty incidence from September 2014 to March 2015. Before the government cut fuel subsidies in November 2014, it had anticipated the inlationary impact of these cuts and its consequences on the poor. It accordingly allocated compensation to 15.5 million households. For ive months, Rp 200,000 per month per household was to be distributed in an effort to reduce the impact of the subsidy cuts. The irst phase of the compensation was given to the target households for two months (November and December 2014), using the 2014 budget (Tempo.co, 20 Nov. 2014). Owing to the delay in the new budget disbursement, however, the PSKS compensation was not distributed until April 2015. Therefore, the poor were practically unprotected during the irst three months of 2015, during which time the rice price escalated, particularly in March (the month of the annual Susenas survey). The estimated poverty incidence may have been lower if the cash transfers had been released earlier, as planned.
Immediately after the announcement of the new data on the rise in the inci-dence of poverty, the Indonesian media were dominated by the argument that the fuel-price increase in November 2014 increased poverty (see, for example, Republika, 15 Sept. 2015), which is misleading. Although higher fuel prices may have contributed to some extent, it was the sharp rise in the price of rice, caused by drought and made worse by a failed attempt to stabilise the price, that was the main factor in the increase in the poverty incidence.
Social Policies
The distributional impacts of current macroeconomic circumstances are likely to be hardest felt at the lower end of the income distribution, where, owing to lower levels of household savings, growth slowdowns and higher rice prices have a relatively greater impact on quality of life. Such impacts may be mitigated in the medium term, however, by Jokowi’s budget reallocations to infrastructure and his expansion of funds for social policy, many of which were important election commitments. Also, one should note that the regressive fuel subsidies have been
reduced in the budget—plans to eliminate them remain contentious—while infra-structure dominates the new iscal space (igure 7).14
Jokowi’s proposed increase to infrastructure spending, if realised, would cre -ate substantial additional employment and potentially reduce spatial inequality across the country. There are no guarantees, however, that the economic growth created by infrastructure investment will beneit the poor more than the rich, or that this investment will boost economic growth and reduce inequality more effec-tively than social spending targeted at poor or near-poor and vulnerable house-holds. Physical infrastructure investment, for instance, may give the poor greater access to employment opportunities. It may even create more jobs for unskilled workers than for skilled workers. And local multiplier effects are very likely (for example, opportunities for roadside food sellers near construction sites). Yet it may also complement private physical and human capital and therefore yield a higher return in richer areas, which are relatively abundant in private capital. This could increase income inequality rather than reduce it. To date, the empirical validity of an association between physical infrastructure and inequality has not been examined suficiently (Calderón and Chong 2004).
Social spending, too, is not guaranteed to reduce inequality. It depends who beneits and to what extent. The budget for social spending overall is domi -nated by education. Combined with other education spending, the total educa-tion budget is Rp 462 trillion ($38 billion), or a quarter of the total budget. That said, even with sizeable funding, there are substantial problems with education
14. Commentators argue that the government has only shifted the burden of subsidisation to Pertamina, the state-owned oil and gas company, which has been incurring consider-able uncompensated costs by selling petrol below market rates (Wall Street Journal, 25 Sept. 2015; Jakarta Post, 26 Sept. 2015).
FIGURE 7 Change in Government Spending, by Category, 2014–15 (Rp trillion)
-210 -180 -150 -120 -90 -60 -30 0 30 60 90 120 150 180 210 Infrastructure
Targeted social spending
Education
Health
Electricity subsidies
Fuel subsidies
Energy subsidies
Sources: Data from the Ministry of Finance and the National Team for the Acceleration of Poverty Reduction.
TABLE 6 Targeted Social Programs under Yudhoyono and Jokowi
Name of program Target Nominal assistance (Rp)
Budget (Rp trillion)
Yudhoyono School Operational Assistance
(BOS) All elementary & junior secondary schools
580,000 per student per year (primary school); 710,000 per student per year (junior secondary school); 1,000,000 per student per year (senior secondary school)
47.4
Jokowi 65.7
Budget increases by Rp 18.3 trillion
Yudhoyono Poor Students’ Assistance (BSM) 11.2 million poor enrolled schoolchildren
225,000–500,000 per student per semester 9.1
Jokowi Indonesia Smart Card (KIP) 20.3 million poor school-age children
15.5
Name of program changes. Target extended to all school-age children. Budget increases by Rp 6.4 trillion
Yudhoyono Direct Cash Assistance;
People’s Temporary Direct
Assistance (BLT; BLSM)
15.5 million households 150,000 per month per household 6.4
Jokowi Family Welfare Savings Program (PSKS)
200,000 per month per household 10.1
Name of program changes. Transfers to savings accounts replace cash payments. Monthly assistance increases. Budget increases by Rp 3.7 trillion
Yudhoyono Rice for the Poor (Raskin) 15.5 million households 1,600 per kilogram 18.2
Jokowi Prosperous Rice (Beras Sejahtera) 18.9
Yudhoyono Conditional cash transfer (PKH) 3.2 million very poor households 1.3 million–2.8 million per household per year (2013)
4.4
Jokowi 6.4 million very poor households 0.9 million–3.7 million per household per
year
6.4
Regional government becomes involved. Target coverage doubles. Range of nominal assistance changes. Budget increases by Rp 2.0 trillion
Yudhoyono National Health Insurance (JKN) 15.5 million households 20,000 per person per month 23.3
Jokowi Healthy Indonesia Card (KIS) 20.4
Name of program changes. Budget decreases by Rp 2.9 trillion
Yudhoyono National Program for
Community Empowerment
(PNPM)
6,000 subdistricts (kecamatan) & 70,000 communities, as of September 2014
14.6
Jokowi 3.5
Budget decreases by Rp 11.1 trillion
Jokowi Village Fund (Dana Desa)a 74,000 villages 280 million per village per year, on average 20.8
Program introduced in 2015
spending. Foremost, the large amount spent has not translated into improved learning outcomes, as assessed internationally by the OECD’s Programme for International Student Assessment (OECD 2014). Furthermore, there are large regional disparities in the quality of education delivered. In contrast to that of other countries, Indonesia’s spending on secondary education is not pro-poor and its spending on tertiary education is regressive (see Lustig 2015; Suryadarma and Jones 2015).
Jokowi has yet to take the opportunity to make education spending more pro-gressive. One of his election promises was to initiate a Smart Indonesia Card (KIP), which was based on the Smart Jakarta Card (KJP) that he introduced while gov-ernor of Jakarta. The KJP program entitles poor families with schoolchildren to receive Rp 180,000 to Rp 240,000 per eligible child per month. When the KIP pro-gram was implemented, however, it simply continued Yudhoyono’s Poor Students’ Assistance scheme (BSM). Its coverage expanded, but the nominal amount of assis-tance per student was the same—in effect, Rp 37,500 to 83,000 per student per month. In fact, aside from introducing the Village Fund, Jokowi’s government has in large part maintained the programs of the Yudhoyono period (table 6).
If Jokowi were to incorporate the KJP into the KIP program, the program’s expenditure alone would have a large impact on poverty and inequality levels. The amount of money distributed to each KJP holder, for example, is substantial compared with the Indonesian poverty line (which, in 2015, is around Rp 330,000 per person per month). If a poor family with two schoolchildren were given Rp 200,000 per child per month (the average amount of KJP assistance), they could be lifted directly out of poverty, depending on how the funds were spent. The KJP program is also targeted not only to the poor but also to the near poor, or 15.5 million households in total. This a large share of the population, and hence the program’s impact on inequality could be considerable.
Using data from Susenas, we estimated the quantitative impact of incorporat-ing the KJP program into KIP. Our simulation (the details of which are available on request) suggests that the new program would be twice as effective as BSM in reducing the poverty incidence, and that it would also reduce the Gini coeficient from 0.41 to 0.40. The budget needed to inance such a program would be close to Rp 30 trillion; this is not a negligible amount of money, but it is within the iscal space created by the fuel-subsidy reduction—though it would mean Rp 30 trillion less for infrastructure, for example.
REFERENCES
Bappenas (National Development Planning Agency). 2014. Rencana Pembangunan Jangka Menengah Nasional (RPJMN) 2015–2019, buku II: Agenda pembangunan bidang [National Medium-Term Development Plan (RPJMN) 2015–2019, book II: Field development agenda]. Jakarta: Bappenas.
BI (Bank Indonesia). 2015. Laporan kebijakan moneter: Ekonomi, moneter, dan keuangan; Tri -wulan II 2015 [Monetary policy report: Economic, monetary, and inancial; Quarter II, 2015]. Jakarta: BI.
BPS (Badan Pusat Statistik). 2015a. ‘Pertumbuhan ekonomi Indonesia triwulan II-2015’ [Indonesia’s economic growth in the second quarter of 2015]. Press release, 5 August.
http://www.bps.go.id/website/brs_ind/brsInd-20150805111616.pdf.
———. 2015b. ‘Proil kemiskinan di Indonesia Maret 2015’ [Proile of poverty in Indonesia in March 2015]. Press release, 15 September. http://www.bps.go.id/website/brs_ind/ brsInd-20150915122517.pdf.
Brueckner, Markus, and Daniel Lederman. 2015. ‘Effects of Income Inequality on Aggre
-gate Output’. Policy Research Working Paper 7317, World Bank, Washington, DC. Calderón, César, and Alberto Chong. 2004. ‘Volume and Quality of Infrastructure and the
Distribution of Income: An Empirical Investigation’. Review of Income and Wealth 50 (1): 87–106.
Cunha Neves, Pedro, and Sandra Maria Tavares Silva. 2014. ‘Inequality and Growth:
Uncovering the Main Conclusions from the Empirics’. Journal of Development Studies 50 (1): 1–12.
Dabla-Norris, Era, Kalpana Kochhar, Nujin Suphaphiphat, Frantisek Ricka, and Evridiki Tsounta. 2015. ‘Causes and Consequences of Income Inequality: A Global Perspective’.
IMF Staff Discussion Note SDN/15/13, International Monetary Fund, Washington, DC.
Damuri, Yose R., and Creina Day. 2015. ‘Economic Reform in Jokowi’s Indonesia’. East
Asia Forum. 20 May. http://www.eastasiaforum.org/2015/05/20/economic-reform- in-jokowis-indonesia/.
Edward, Peter, and Andy Sumner. 2015. ‘The Impact of the PPP Revision on Poverty in Indonesia, 1990–2012’. Mimeo, King’s College London and Newcastle University, UK.
Hill, Hal, and Haryo Aswicahyono. 2014. Indonesia’s Medium Term Development Plan: Back -ground Study on Competitiveness. Report prepared for the Asian Development Bank, Manila.
Hill, Hal, and Thee Kian Wie. 2008. ‘Moh. Sadli (1922–2008), Economist, Minister and Pub
-lic Intellectual’. Bulletin of Indonesian Economic Studies 44 (1): 151–56.
IMF (International Monetary Fund). 2015a. ‘Exchange Rate Archives by Month’. https:// www.imf.org/external/np/in/data/param_rms_mth.aspx.
———. 2015b. ‘IMF Primary Commodity Prices’. http://www.imf.org/external/np/res/ commod/index.aspx.
Lahoti, Rahul, Arjun Jayadev, and Sanjay G. Reddy. 2014. ‘The Global Consumption and
Income Project (GCIP): An Introduction and Preliminary Findings’. DESA Working Paper 140, United Nations Department of Economic and Social Affairs, New York. Leigh, Andrew, and Pierre van der Eng. 2009. ‘Inequality in Indonesia: What Can We Learn
from Top Incomes?’. Journal of Public Economics 93 (1–2): 209–12.
Lustig, Nora. 2015. ‘Inequality and Fiscal Redistribution in Middle Income Countries:
Bra-zil, Chile, Colombia, Indonesia, Mexico, Peru and South Africa’. CGD Working Paper
410, Center for Global Development, Washington, DC.
Manning, Chris, and Devanto S. Pratomo. 2013. ‘Do Migrants Get Stuck in the Informal
Sector? Findings from a Household Survey in Four Indonesian Cities’. Bulletin of Indo-nesian Economic Studies 49 (2): 167–92.
Marks, Stephen V. 2015. Non-Tariff Trade Regulations in Indonesia: Measurement of their Eco -nomic Impact. Report prepared for the Australia Indonesia Partnership for Economic Governance, Jakarta.
McCulloch, Neil. 2008. ‘Rice Prices and Poverty in Indonesia’. Bulletin of Indonesian Eco-nomic Studies 44 (1): 45–64.
Ministry of Trade. 2015. ‘National Price Table’. http://www.kemendag.go.id/en/ economic-proile/prices/national-price-table.
OECD. 2014. PISA 2012 Results: What Students Know and Can Do: Student Performance in Mathematics, Reading and Science, vol. 1, rev. ed. Paris: PISA, OECD Publishing.
Patunru, Arianto A., and Sjamsu Rahardja. 2015. ‘Trade Protectionism in Indonesia: Bad
Times and Bad Policy’. Lowy Institute Analysis. 30 July. http://www.lowyinstitute. org/iles/patunru_and_rahardja_trade_protectionism_in_indonesia_0.pdf.
Rodrik, Dani. 2015. ‘Premature Deindustrialization’. NBER Working Paper 20935, National Bureau of Economic Research, Cambridge, MA.
Suryadarma, Daniel, and Gavin Jones. 2015. Education in Indonesia. Singapore: Institute of Southeast Asian Studies.
Warr, Peter, and Arief Anshory Yusuf. 2014. ‘World Food Prices and Poverty in Indonesia’.
Australian Journal of Agricultural and Resource Economics 58 (1): 1–21.
World Bank. 2015. Indonesia Database for Policy and Economic Research. Updated 8 June.
http://data.worldbank.org/data-catalog/indonesia-database-for-policy-and-economic- research.