Energy Procedia 65 ( 2015 ) 121 – 130
ScienceDirect
1876-6102 © 2015 The Authors. Published by Elsevier Ltd. This is an open access article under the CC BY-NC-ND license (http://creativecommons.org/licenses/by-nc-nd/4.0/).
Peer-review under responsibility of the Scientific Committee of EBTKE ConEx 2014 doi: 10.1016/j.egypro.2015.01.044
Conference and Exhibition Indonesia - New, Renewable Energy and Energy Conservation
(The 3
rdIndo-EBTKE ConEx 2014)
Insights from the Experience with Solar Photovoltaic Systems in
Australia and Indonesia
Hugh Outhred
a,b*, Maria Retnanestri
a,caUniversity of New South Wales, UNSW, Sydney NSW 2052, Australia bIpen Pty Ltd, PO Box 6217 UNSW Sydney NSW 1466, Australia cSekolah Tinggi Teknologi Nasional, STTNAS, Yogyakarta 55281, Indonesia
Abstract
In the last five years, Australia has experienced a rapid deployment of household rooftop PV systems, to the extent that around 1.25 million households (15 % of all households) now have rooftop PV systems. Experience from this “social experiment” may provide useful insights for other countries considering similar scenarios. Indonesia has deployed PV systems since the 1970’s with a hiatus caused by the Asian Financial Crisis in 1997. Significant deployment of PV systems recommenced after the turn of the century for both off-grid and grid-connected applications, with the grid-connected PV systems being connected to isolated diesel power systems on the smaller islands of the Indonesian archipelago. This paper discusses the nature of the Australian and Indonesian experiences with PV systems from technical, social, economic and policy perspectives, with the intention of providing insights to other countries contemplating similar scenarios. A key recommendation is to adopt a carefully planned and implemented strategy that avoids triggering a divisive cultural contest.
© 2015 H. Outhred, M. Retnanestri. Published by Elsevier Ltd.
Peer-review under responsibility of the Scientific Committee of EBTKE ConEx 2014.
Keywords: Australia; Indonesia; photovoltaic; power systems; solar energy.
* Corresponding author. Tel.: +61 241 4385 240 E-mail address: [email protected]
© 2015 The Authors. Published by Elsevier Ltd. This is an open access article under the CC BY-NC-ND license (http://creativecommons.org/licenses/by-nc-nd/4.0/).
1.Introduction
In the last five years, Australia has experienced a rapid deployment of grid-connected household rooftop photovoltaic (PV) systems, to the extent that around 1.25 million households (around 15 % of all households) now have rooftop solar PV systems. Prior to that, PV systems in Australia had mainly been deployed in off-grid applications.
Indonesia has deployed PV systems since the 1970’s with a hiatus caused by the Asian Financial Crisis in 1997.
Significant deployment of PV systems recommenced after the turn of the century for both off-grid and grid—
connected applications, with the grid-connected PV systems being connected to isolated diesel power systems on the smaller islands of the Indonesian archipelago.
The aims of this paper are to review experience with solar PV systems in the Australia and Indonesia, to identify the positive and negative aspects of that experience and to develop insights that may be useful to other countries that are contemplating similar initiatives. The main focus of this paper is on grid-connected PV systems. Experience with small-scale renewable energy supply in remote Indonesian communities is discussed in [1].
2.Experience with grid-connected solar PV systems in Australia
Solar energy research and development effectively started in Australia in the 1950’s with an initial emphasis on solar thermal conversion processes [2]. Solar photovoltaic (PV) research and development commenced in the 1970’s
and from then on small, off-grid PV battery systems were then being deployed for isolated residential and commercial use [2]. The installed capacity of off-grid residential and commercial installations exceeded 7 MW by
the early 1990’s and 130 MW by the end of 2013 [3].
The first grid-connected PV systems were installed in Australia in the early 1990’s with rapid uptake from 2009. Total grid-connected PV system capacity exceeded 3 GW by the end of 2013, with all but 24 MW being small, distributed PV systems [3] with an average size of about 3 kW. The average rating of new distributed PV systems now exceeds 4 KW but the rate of installation appears to be slowing [4]. Five large grid-connected PV systems, of 102 MW, 53 MW, 20 MW, 13 MW and 10 MW respectively are currently under construction in Australia and are scheduled to commence operation in 2015 [3].
Table 1, based on Table 3 of [3], shows cumulative PV system capacity in Australia since 2005, illustrating the rapid growth of grid-connected distributed PV systems in the last five years. Table 3 in [3] extends this data back to
1992. The definition of “distributed” used in [3] includes PV systems installed at end-user premises and some other PV systems connected to an electricity distribution network (an illustrative example is given of a PV system installed on a motorway sound barrier).
Table 1. Cumulative installed PV systems in Australia (MW), 2005-2013 (based on [3])
Sub-market 2005 2006 2007 2008 2009 2010 2011 2012 2013
Off-grid residential 20 24 28 33 41 44 55 65 74
Off-grid other 33 37 39 41 43 44 47 53 58
Grid-distributed 7 9 15 30 101 480 1268 2276 3070
Grid-central 0.8 0.8 1 1.3 2.5 4 7 22 24
Total 61 70 82 105 187 571 1377 2415 3225
A number of factors have contributed to the rapid uptake of distributed grid-connected PV systems in Australia over the last five years, including:
x Rising residential electricity tariffs primarily resulting from increased distribution network tariffs and climate change mitigation policies
x Falling purchase prices for distributed PV systems and growing public acceptance of the technology
x Emergence of many small businesses engaged in PV system design and installation
Australian policy measures at Federal and State levels that supported distributed grid-connected PV systems in 2013 included feed-in tariffs (FiTs), green electricity schemes, renewable portfolio standards, investment funds, net metering, green mortgages, sustainable building requirements and utility programs [3], Table 4.
The most influential policy measures supporting the rapid development of distributed grid-connected PV systems in the last five years have been generous feed-in tariffs (FiTs) set by state and territory governments and the Federal
Government’s Renewable Energy Target (RET). In addition, the Federal Government’s Solar Flagship program supported the 102 MW and 53 MW PV systems mentioned previously and the Large-Scale Solar Auction run by the Australian Capital Territory (ACT) awarded 20-year FiTs to the 20 MW, 13 MW and 10 MW PV systems mentioned previously (www.environment.act.gov.au).
State and territory governments introduced FiTs for PV systems connected to the main electricity grids between 2008 and 2010, some schemes offering up to 60 c/kWh for all energy produced. Due to the take-up being far greater than governments anticipated, all of these schemes have now been either closed or considerably reduced in value to as low as 8 c/kWh for net exports only. Table 6 of [3] contains more detailed information. In some states, FiTs are now optional at the discretion of electricity retailers and some distribution network companies now restrict connection of small PV systems due to local network over-voltage constraints.
The Australian Government’s RET scheme consists of two parts - the Large-Scale Renewable Energy Target (LRET) and the Small-scale Renewable Energy Scheme (SRES). Both are certificate-based schemes in which owners of eligible generators can create certificates that can then be sold to parties (electricity retailers or large users of electricity) that are liable to surrender the certificates to the Clean Energy Regulator on an annual basis. However, while the LRET scheme has specific annual targets, the SRES scheme is open-ended with respect to volume. Wind farms have been the most successful technology under the LRET while solar PV and solar water heating have been the most successful technologies under the SRES.
The SRES provides an up-front capital subsidy to grid-connected PV systems of 100 kW or less via a deeming arrangement that gives the purchaser a number of certificates at time of installation equal to the predicted future electricity generation over a 15-year period, with one less year of deeming for installation each year after 2016. Initially the policy allocated five times the number of deemed certificates for the first 1.5 kW of capacity. However, the solar credit multiplier was later reduced and finally eliminated (ie set to 1) at the end of 2012. See [5] for more detailed discussion of the evolving design of the RET scheme.
In February 2014, the present Federal Government appointed a panel to review the RET and the panel has recently submitted its report [5]. It recommends closing the LRET to new entrants or substantially reducing its target, and either immediately closing or rapidly phasing out the SRES and, in the latter case, reducing the maximum eligible rating for the SRES to 10 kW. The government has yet to respond to these recommendations but there is strong political opposition to them: the future role of grid-connected PV has become culturally contested.
The SRES and the generous FiTs previously in place drove the rapid uptake of distributed PV systems and also a trend towards larger size systems chasing economies of scale. The average PV system size has now reached about 4.5 kW. However, future trends are uncertain due to the termination of the generous FiTs, uncertainly about the future of the SRES and increasingly common restrictions on network connection.
By contrast, there appears to be growing interest in the use of PV systems away from the main electricity supply systems to displace diesel fuel in remote power systems for residential, community and mine site electricity supply,
although this “off-grid” market will remain smaller than the “grid-connected” main power system market.
2.1.Current status and trends for solar PV systems in Australia
A recent PV system report by the Electricity Supply Association of Australia (ESAA) [6] estimates that PV systems are currently being installed in Australia at a combined rate of around 70 MW per month with an average size of about 4.5kW. It also estimates that residential penetration (the fraction of houses with rooftop PV) is now 23.5 % in South Australia, 21.7 % in Queensland and greater than 9 % in New South Wales, Victoria and Tasmania. Reference [3] estimates that PV systems produced 4.5 TWh in 2013 or 2.3 % of total electricity consumption in that year.
prices and net-export FiTs in the same cities. Table 2, based on Table 1 of [6] shows the ESAA’s “central estimates”
for a discount rate of 7.28 %, which reflects ten-year average household mortgage rates. Table 2 shows that the estimated LCOEs are less than the residential electricity prices in most cases but greater than the current net-export FiTs in all cases. The ESAA interprets this to mean that reduction of electricity purchase costs is now the main driver for household PV system purchase decisions rather than income from energy export, which used to be a strong driver under the earlier generous FiTs.
Due to concerns regarding cross-subsidy between households with and without a rooftop PV system, various commentators are now calling for retail tariff reform to provide more cost-reflective residential electricity pricing [7-10]. Typical recommendations are for time of use tariffs or, more radically, dynamic pricing. However, the Consumer Action Law Centre (CALC) [11] argues that residential consumers may struggle to understand these more complex tariffs and urges caution. In a similar vein, Edis [12] argues that households might be better off buying energy services from energy service providers rather than dealing with the complexity of buying electricity from electricity retailers and deciding whether to install their own rooftop PV systems. They could then delegate to the energy service provider the decision as to whether to install a rooftop PV system for the household and, if so, the energy service provider would carry the technical and financial risk in doing so. The household would, over time, pay for the rooftop PV system through purchases of energy services provided by it.
Table 2. Estimated LCOE (c/kWh, AUD2014) for PV systems with residential tariff and FiTs [6]
City System size (kW) Residential tariff (c/kWh) FiT (c/kWh)
2 3 4 5 10
Adelaide 18 16 16 15 14 30 8
Brisbane 18 16 16 15 14 26 8
Canberra 19 17 16 15 13 19 8
Hobart 24 22 20 19 18 29 8
Melbourne 23 20 18 18 17 28 8
Sydney 19 16 16 16 14 26 7
Perth 17 15 14 14 13 25 9
As pointed out in reference [13], distributed photovoltaic systems increase the complexity of power flows occurring within an electricity distribution network, which may require some changes to the network in order to accommodate. Energy no longer flows in a single direction, DNSPs must now plan, design and operate networks taking into consideration “negative loads” at customer premises and reverse energy flows. An additional consideration for networks and for customers is the ongoing reliability and performance of these systems over their full lifecycle.
Australian activities to identify and address technical issues associated with distributed generation (including PV systems) have been underway for many years. Reference [14] reported on a government-industry-university workshop held in 2002 to review status and needs associated with grid-connected PV, and which recommended further work on grid connection guidelines, technical standards, commercial arrangements and legal liabilities. Such work has since been underway.
Grid connection rules and technical standards have been developed to guide the design and enhance the
performance of PV systems in Australia. Two relevant Australian standards are AS/NZS5033: “Installation of PV arrays” and AS/NZS 4777: “Grid connection of energy systems via inverters”. Both are currently under further
revision to keep them up to date with respect to design trends and grid-connection requirements.
Energex, the franchise electricity distributor (distribution wires business) in Southeast Queensland has one of the highest penetrations of residential rooftop PV in Australia. It noted in its 2013 annual performance report (https://www.energex.com.au/about-us/corporate-reports/annual-reports) on page 19 that distributed PV systems introduce both technical and financial issues:
The trend to connect solar PV has raised issues on the impact of embedded generation in the network, including:
x Managing network voltage to ensure customers receive a safe and acceptable quality of supply
x Potential shortfalls in revenue from reduced energy consumption driving prices upwards
Smart Grid, Smart City (http://www.smartgridsmartcity.com.au) was a $100 million Australian government funded project, conducted by a consortium led by Ausgrid (the largest NSW electricity distributor, formerly called EnergyAustralia) between 2010 and 2014 that involved approximately 30,000 households and tested a range of smart grid technologies, interval metering and advanced tariffs as well as distributed resources including PV systems and batteries. It gathered information about the benefits and costs of implementing these technologies in an Australian setting.
With respect to distributed PV systems the consortium concluded field trial and modelling showed that the effectiveness of rooftop solar PV systems in reducing summer peak demand is limited, mainly due to misalignment of the timing of rooftop solar PV system output and peak network demand. The consortium recommended the introduction of time of use or dynamic residential tariffs and net FiTs to provide incentives to households to avoid oversizing PV systems and to orient them towards the west to improve late afternoon production. With respect to network impacts, the consortium concluded:
x The current levels of distributed generation penetration [mainly distributed PV systems] can be managed for many parts of the electricity network. Further studies should focus not just in areas where penetration of distributed generation is high or is expected to be high, but also where the network characteristics mean the effects of distributed generation at the local level may have a greater impact, such as weaker networks ([13], p188)
x These results indicate that at lower levels of the network, such as at the low voltage, 11kV distribution feeder or zone substation level, the contribution from photovoltaic systems in reducing in peak load is less significant than at the system-wide level. This is mainly due to the difference in timing between peak solar generation and times of peak demand particularly䯠 in residential areas with later afternoon or evening peaks where the majority of photovoltaic systems have been installed in recent years. With increasing uptake of this technology, primarily driven by customer value, it is unlikely that installations will be optimal for network providers; that is, significant benefits targeted at specific network investment needs will not be achieved. ([13], p190)
Interest is now growing in Australia in adding energy storage to grid-connected PV systems using either lead-acid or lithium-ion batteries and this is motivating further development of relevant technical guidelines and standards to improve designs and manage risks. The main objective of adding energy storage would be to smooth and delay PV system production to improve its correlation with household load, which tends to peak in the late afternoon or early evening. However adding energy storage increases cost, complexity, space requirements and modes of failure with potentially increased safety and fire risks and the cost-effectiveness of energy storage remains doubtful.
To reduce the risk of poor quality PV system design and installation, the Clean Energy Council (CEC) operates an accreditation scheme for designers and installers of stand-alone and grid-connected PV systems with endorsements for micro-hydro, small wind and hybrid systems including grid-connected battery storage (http://www.solaraccreditation.com.au/about.html).
The CEC has also developed a solar PV retailer code of conduct and maintains a list of approved PV modules and inverters that meet Australian Standards for use in solar PV systems. Only PV systems that use approved products and that have been installed by accredited installers are entitled to small-scale technology certificates (STCs) under the SRES.
Unfortunately, these arrangements have not been sufficient to guarantee that there won’t be technical or safety
problems with individual items of equipment or overall PV system performance. For example, due to instances of switch failure that in some cases have caused fires, the Australian Competition and Consumer Commission has issued product recalls for a number of models of DC isolator switches ( http://www.solaraccreditation.com.au/products/product-recalls.html). These recalls have affected many thousands of PV system installations and raised questions about the performance of some PV system installers.
With respect to overall PV system performance, EnergyAustralia [15] reported that an investigation into the
performance of rooftop PV systems installed in 2000 at the then athletes’ village built for the Sydney Olympic
3.5 % of systems per year. This could suggest that more attention may need to be paid to vigilant monitoring and maintenance to ensure continued satisfactory performance.
Ausgrid (previously called EnergyAustralia) returned to Newington in 2010 to conduct a field investigation with high penetration PV on urban distribution feeders. [13, p183] found that approximately 21 % of the photovoltaic systems appeared to be non-operational, and just under half of the impacted customers approached accepted a free system inspection when notified that their system did not appear to be operating. Of those inspected, the majority (around 92 %) of failed systems were due to inverter failure. Ausgrid reported this to the customers and suggested they repair the system. Notwithstanding that most of these customers were eligible for the 60 cent per kWh solar feed-in tariff under the NSW Solar Bonus Scheme, only a few of those customers (approximately 11 %) elected to invest in restoring their photovoltaic system to an operable state. These observations suggest a low level of customer interest in their photovoltaic system and/or getting it repaired.
Complicating factors that may apply here are (a) change of ownership of a house with a rooftop PV system and (b) rental of a house with a rooftop PV system. When a house with a rooftop PV system is sold, knowledge about and interest in the rooftop PV system may decline. If a house owner decides to rent a house that has a rooftop PV system, contractual arrangements with respect to PV system production become ambiguous and incentives to pay for repairs may become diluted.
In Australia, average length of home ownership is about 9 years. It is too early for extensive data to become available, however Energex, the Southeast Queensland distributor reports experiencing a nearly 5 %/year dropout rate from its 44 c/kWh PV gross FiT that commenced in 2010 and terminated in 2013. In this situation, dropout is most likely to occur when a house with rooftop PV on the FiT is sold or the owner rents the house to other occupants.
3.Experience with grid-connected solar PV systems in Indonesia
Solar PV systems have been installed in a wide range of grid-connected and off-grid applications in Indonesia since the 1970’s as shown in Table 3. Support remained high until the Asian financial crisis in 1997, which badly
affected projects such as the AusAID and the World Bank Solar Home System (SHS) projects [16,17].
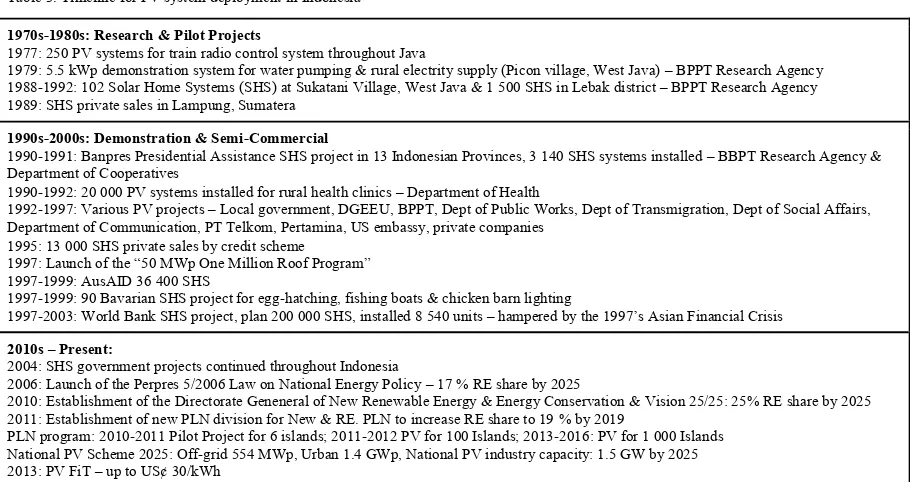
Table 3. Timeline for PV system deployment in Indonesia
1970s-1980s: Research & Pilot Projects
1977: 250 PV systems for train radio control system throughout Java
1979: 5.5 kWp demonstration system for water pumping & rural electrity supply (Picon village, West Java) – BPPT Research Agency 1988-1992: 102 Solar Home Systems (SHS) at Sukatani Village, West Java & 1 500 SHS in Lebak district – BPPT Research Agency 1989: SHS private sales in Lampung, Sumatera
1990s-2000s: Demonstration & Semi-Commercial
1990-1991: Banpres Presidential Assistance SHS project in 13 Indonesian Provinces, 3 140 SHS systems installed – BBPT Research Agency & Department of Cooperatives
1990-1992: 20 000 PV systems installed for rural health clinics – Department of Health
1992-1997: Various PV projects – Local government, DGEEU, BPPT, Dept of Public Works, Dept of Transmigration, Dept of Social Affairs, Department of Communication, PT Telkom, Pertamina, US embassy, private companies
1995: 13 000 SHS private sales by credit scheme 1997: Launch of the “50 MWp One Million Roof Program” 1997-1999: AusAID 36 400 SHS
1997-1999: 90 Bavarian SHS project for egg-hatching, fishing boats & chicken barn lighting
1997-2003: World Bank SHS project, plan 200 000 SHS, installed 8 540 units – hampered by the 1997’s Asian Financial Crisis
2010s – Present:
2004: SHS government projects continued throughout Indonesia
2006: Launch of the Perpres 5/2006 Law on National Energy Policy – 17 % RE share by 2025
2010: Establishment of the Directorate Geneneral of New Renewable Energy & Energy Conservation & Vision 25/25: 25% RE share by 2025 2011: Establishment of new PLN division for New & RE. PLN to increase RE share to 19 % by 2019
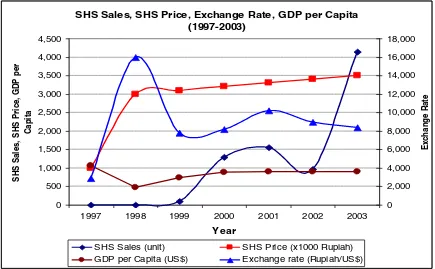
Figure 1 shows the timing of significant PV system projects in Indonesia in the period from 1989 to 2004 as well as the timing of important government policy decisions, per-capita GDP in USD and the IDR/USD exchange rate. The Asian financial crisis had a particularly severe effect on the Indonesian World Bank Solar Home System (SHS) Project, which commenced in 1997 [17].
Figure 1. Significant PV system projects, government policy decisions, GDP per capita (USD) and IDR/USD exchange rate from 1989 to 2004
Notes to Figure 1:
1) 1980s, the New Order Government considered PV’s potential for rural electrification, to help avoid the need to build expensive power stations, save on fossil fuel consumption & build domestic PV industry.
2) August 1997, Asian Economic Crisis started.
3) January 1998 - Rupiah lost 80 % of its value against the USD; Inflation rate reached 82 %; May1998 - National Reform movement, Indonesian 2nd President, Soeharto, stepped down after 32 years in power, Habibie was sworn as the 3rd President.
4) 1999, East Timor independence, Gus Dur elected as the 4th President, Decentralization enacted. 5) Gus Dur was recalled, Megawati was sworn in as the 5th President.
6) 2004 Direct Election, Susilo Bambang Yudhoyono elected & sworn in as the 6th Indonesian President
The timeline for the Indonesian World Bank Solar Home System (SHS) Project follows and is shown in Figure 2:
x 1997: Project start targeting 200 000 unit sales. Financial crisis devalued rupiah, 50 Wp SHS price arose from US$100 to US$350-500
x 1999: Sales – 92 units
x 2000: Removal of fuel subsidy, kerosene up 140%, diesel up 160%, electricity up 30 %, Sales – 1 299 units
x 2001: Sales – 1 552 units
x 2002: Minimum SHS capacity reduced to 10 Wp, Sales – 972 units
x 2003: Further fuel subsidy reduction, kerosene up 360 %, diesel 430 %, Sales – 4,139 units
x Total sales at project end 8 054 compared to the target of 200 000.
While a failure in terms of poor number of total sales, the project indicated the potential for SHS in rural Indonesia. The World Bank project legacy includes the accreditation of a national SHS testing laboratory, and the establishment of SHS technical standards for battery, lighting system performance and general guidelines for stand-alone PV systems.
overall target of 634 MWp by 2020 [18]. As an established, country wide utility PLN is in a strong position to maintain long-term project sustainability and facilitate cultural acceptance, compared to the earlier ad-hoc programs that often left users to cope with post-project issues.
Figure 2. Deployment of SHS in the World Bank Solar Home System (SHS) project
In 2013 the Government released PV Feed-in-Tariffs offering up to 30 US cent/kWh [19]. It is too early to assess the outcomes of this initiative.
Table 4 summarizes the pilot PV project undertaken by PLN in 2010-2012 as part of its 100 Island PV Project [20], in which PV systems were connected to small isolated diesel power systems to save diesel fuel, while Table 5 shows the current evolution of that concept to 1 000 isolated diesel supply systems [21]. Apart from saving diesel fuel, these projects also aim to develop the Indonesian PV industry and facilitate the newly released PV Feed-in-Tariff policy [22].
Table 4. The grid-connected PV system pilot project undertaken by PLN in 2010-2012 [20]
Location PV capacity (kWp) Operational by
Raja Ampat Island, Papua 30 kWp December 2010
Banda Naira Island, Maluku 100 kWp December 2010
Gili Trawangan Island, West Nusa Tenggara 200 kWp February 2011
Bunaken Island, North Sulawesi 335 kWp February 2011
Derawan Island, East Kalimantan 170 kWp March 2011
Tomia Island, South Sulawesi 75 kWp May 2011
Lembata Island 200 kWp September 2011
Miangas Island 30 Wp October 2011
Morotai Island 600 kWp April 2012
Table 5. PLN’s 1000-Island PV Development Program for 2013-2020 [21]
Location Number PV systems Total capacity (MWp)
Sumatra 304 122.2
Kalimantan 189 113.7
Java 20 6.1
Bali 1 0.3
West Nusa Tenggara (NTB) 15 44.5
East Nusa Tenggara (NTT) 99 45.2
Sulawesi 56 60.6
Maluku 29 33.5
Papua 66 44.9
4.Insights from the experience with grid-connected solar PV systems in Australia and Indonesia
Insights from the experience with respect to grid-connected distributed solar PV systems in Australia and Indonesia include:
x In planning the deployment of grid-connected distributed solar PV, technical, economic, social equity, safety & environmental issues should be all considered as well as the appropriate rate of deployment to assure effective acculturation. Standards and guidelines and workforce education programs should be designed and implemented prior to large-scale deployment.
x Technical progress in solar PV systems remains high, so deployment should not proceed too fast to reduce the risks of lock-in to what may soon become superseded technology.
x Well-designed and strong distribution networks can tolerate distributed solar PV systems at high penetration levels. However, weak or poorly designed networks may require remedial investment, which should be planned for and resourced prior to the deployment of distributed solar PV in such situations.
x Long-term performance of distributed solar PV systems is uncertain because it depends on the quality of manufacture, installation, performance monitoring and maintenance. There is some evidence that households should not be relied on to adequately maintain residential rooftop PV systems over their potential technical lives.
x The daily production characteristics of PV systems do not contribute much to reducing the late afternoon or early evening peak demand on distribution networks that serve typical residential areas in Australia. In Australia, PV system production correlates better with commercial loads, which also support larger PV systems facilitating the capture of economies of scale in PV system installation, operation and maintenance.
x Deployment of residential rooftop PV systems in Australia has revealed weaknesses in the cost-reflectivity of traditional Australian residential electricity tariffs, leading to concerns about the ensuing reduction of cash flow to the traditional supply industry and inequities between end-users with and without solar PV. Advanced metering and time-of-use or better still dynamic peak pricing should be implemented in conjunction with distributed solar PV systems but households may be confused by the complexity of such tariffs, leading to further equity concerns. A suggested response is to introduce energy service companies that focus on the cost effective provision of energy services to households rather than electrical energy.
x The willingness of Australian households to invest in rooftop PV systems and the ability of small businesses to scale-up their deployment capability underpinned the rapid deployment of rooftop PV systems in Australia. However, this also reduced the cash flow available to traditional supply industry participants, causing them to oppose further deployment of rooftop PV systems and contributing to a divisive cultural contest.
5.Conclusions
In the last five years, Australia has experienced a rapid deployment of household rooftop PV systems, to the extent that around 1.25 million households (around 15 % of all households) now have rooftop PV systems. With a change in government, the underlying policies that facilitated this outcome have now been either terminated or are
under review. Experience from this “social experiment” may provide useful insights for other countries considering similar strategies. Not surprisingly, the over-arching insight is that a carefully planned and implemented strategy that is culturally compatible is more likely to succeed than one that triggers a divisive cultural contest.
The Indonesian experience has some similarities to Australia in terms of boom-bust outcomes, particularly during the period from 1970 to 1997. However, the present Indonesian approach appears to be more likely to produce effective acculturation and valuable long-term outcomes in terms of cost-effective deployment, operation and maintenance of PV systems. Only time will tell if that turns out to be the case.
References
[1] Retnanestri M, Outhred H. Acculturation of renewable energy technology into remote communities: lessons from Dobrov, Bourdieu, and Rogers and an Indonesian case study.Energy, Sustainability and Society 2013, 3:9
[2] Morse R. Solar energy in Australia. Ambio 1977; Vol. 6, No.4: 209-215
[3] APVI. Australian PV in Australia report 2013, June 2014. [Internet] accessed 31 July 2014, from http://apvi.org.au/wp-content/uploads/2014/07/PV-in-Australia-Report-2013.pdf
[4] Clean Energy Council. Clean energy Australia report 2013. [Internet] accessed 3 August 2014, from www.cleanenergycouncil.org.au [5] Warburton D, Fisher B, In’t Veld S, Zema M. Renewable energy target scheme – report of the expert panel, August 2014. [Internet] accessed
on 28 August 2014, from https://retreview.dpmc.gov.au/ret-review-report-0.
[6] Energy Supply Association of Australia. Quarterly solar PV report September 2014. [Internet] accessed on 6 September 2014 from http://www.esaa.com.au/policy/solar_report
[7] Energy Networks Association. Enabling embedded generation – turning Australian electricity on its head, April 2014. [Internet] accessed on 5 August 2014 from http://www.ena.asn.au/wp-content/uploads/2014/04/ENABLING-EMBEDDED-GENERATION-Turning-Australian-electricity-on-its-head_Web.pdf.
[8] Energy Supply Association of Australia. Air-conditioners and solar – why electricity pricing needs to be reformed. Discussion Paper October 2013. [Internet] accessed on 27 April 2014 from http://www.esaa.com.au/policy/discussion_papers.
[9] Wood T, Carter L. Fair pricing for power. Grattan Institute report July 2014. [Internet] accessed on 6 July 2014 from http://grattan.edu.au/report/fair-pricing-for-power/.
[10] Simshauser P, Downer D. On the inequity of flat-rate electricity tariffs. AGL Working Paper 41 July 2014. [Internet] accessed on 6 September 2014, from http://aglblog.com.au/wp-content/uploads/2014/07/No.41-On-the-inequity-of-tariffs.pdf.
[11] Consumer Action Law Centre. Smart moves for a smart market, July 2014. [Internet] accessed on 7 September 2014, from http://consumeraction.org.au/report-smart-moves-for-a-smart-market/.
[12] Edis T. Are households the wrong people to be buying power stations? Climate Spectator, 12 August 2014. [Internet] accessed on 12 August 2014 from http://www.businessspectator.com.au/article/2014/8/12/solar-energy/are-households-wrong-people-be-buying-power-stations [13] Ausgrid. Distributed generation and distributed storage: SGSC technical compendium, July 2014. [Internet] accessed on 7 August 2014,
from https://ich.smartgridsmartcity.com.au.
[14] Outhred H, Spooner E. Network issues associated with distributed generation. Proceedings of Solar 2002 - Australian and New Zealand Solar Energy Society, Newcastle, November 2002.
[15] Energy Australia. Newington photovoltaic power systems energy value and reliability analysis, April 2008. [Internet] accessed on 6 Septem- ber 2014 from
http://www.transgrid.com.au/network/nsdm/documents/newington%20pv%20energy%20value%20and%20reliability%20analysis.pdf [16] Retnanestri M.The I3A framework – Enhancing the sustainability of off-grid photovoltaic energy service delivery in Indonesia, [PhD
Thesis] 2007 University of New South Wales.
[17] The World Bank. Implementation completion report (TF-28488) on a GEF grant in the amount of SDR 16.8 million to The Republic of Indonesia for the solar home systems project, Report no. 29153, 21 June 2004
[18]PLN. Rencana usaha penyediaan tenaga listrik [Electricity utilization plan] 2013-2022. [Bahasa Indonesia].
[19] ESDM. Peraturan Menteri Energi dan Sumber Daya Mineral Republik Indonesia nomor 17 tahun 2003 tentang pembelian tenaga listrik oleh PT Perusahaan Listrik Negara (Persero) dari pembangkit listrik tenaga surya fotovoltaik [Mine and Energy Ministrial Regulation number 17 year 2003 regarding the photovoltaic power purchase by PT PLN]. [Bahasa Indonesia]
[20] Sofyan M. The role of PLN in promoting solar PV in Indonesia, EKONID Workshop, Jakarta 26 March 2012 [21] Sofyan M. PLN – Solar PV development plan, Jakarta 8 February 2013
[22] Sofyan M. PLN solar development plan: target and experiences. German-Indonesian Renewable Energy Days, Jakarta 26 October 2011 [23] Bolinger M, Weaver S. Utility scale solar 2013. Lawrence Berkeley National Laboratory, September 2014. [Internet] accessed on 18
September 2014, from http://emp.lbl.gov/sites/all/files/LBNL_Utility-Scale_Solar_2013_report.pdf
![Table 1. Cumulative installed PV systems in Australia (MW), 2005-2013 (based on [3])](https://thumb-ap.123doks.com/thumbv2/123dok/1109379.884441/2.544.43.494.460.519/table-cumulative-installed-pv-systems-australia-mw-based.webp)
![Table 2. Estimated LCOE (c/kWh, AUD2014) for PV systems with residential tariff and FiTs [6]](https://thumb-ap.123doks.com/thumbv2/123dok/1109379.884441/4.544.42.489.265.354/table-estimated-lcoe-aud-systems-residential-tariff-fits.webp)

![Table 5. PLN’s 1000-Island PV Development Program for 2013-2020 [21]](https://thumb-ap.123doks.com/thumbv2/123dok/1109379.884441/9.544.53.500.74.190/table-pln-s-island-pv-development-program.webp)
