Summary We compared bark proteins from four contrasting (blister rust-resistant versus susceptible) half-sib seedling pairs of western white pine (Pinus monticola D. Don). Pooled pro-teins from resistant and susceptible groups (four trees per group) were separated by two-dimensional gel electrophoresis, silver stained, and analyzed with the aid of a laser scanner interfaced with a computerized gel documentation system.
Qualitative and quantitative protein differences were ob-served between resistant and susceptible groups. The number of proteins unique to a group was greater in the susceptible category than in the resistant category. Biosynthesis of some common proteins was enhanced near lesioned areas of suscep-tible seedlings. Many proteins shared similar charge and mass characteristics with those of pathogenesis-related (PR) pro-teins. Two protein bands were isolated and partially charac-terized by N-terminal amino acid sequencing: a 10.6-kDa band that was selectively enriched in all resistant individuals, and a 26.0-kDa band that was enriched in some susceptible individu-als. The significance of these protein differences and the pos-sible use of selected proteins as disease or resistance markers are discussed.
Keywords: Cronartium ribicola, disease markers, pathogene-sis-related proteins, resistance markers, slow canker growth.
Introduction
Western white pine (Pinus monticola D. Don) is a commer-cially important, fast-growing pioneer species that is widely distributed throughout the Pacific Northwest and California (Flora of North America Editorial Committee 1993). The high stumpage value of this conifer along with its ability to tolerate laminated root rot disease caused by Phellinus weirii (Murr.) Gilb., make it an attractive candidate for utilization in refores-tation (Theis and Sturrock 1995). However, the high suscepti-bility of P. monticola to the white pine blister rust, Cronartium ribicola J.C. Fisch., has necessitated the development of sev-eral rust-resistant white pine programs (Bingham et al. 1971, Hoff and McDonald 1980, Hunt 1990).
Blister rust-resistance mechanisms have been identified in both needle and bark tissues of P. monticola (Hoff and McDon-ald 1980). Although little is known about the physiological or
biochemical nature of blister rust-resistance mechanisms, it has been shown that the delayed onset, bark-specific mecha-nism known as ‘slow canker growth’ is associated with longer field survival of infected seedlings. This mechanism has a heritability value of 0.21--0.46, making the phenotype attrac-tive to tree breeders (Hoff and McDonald 1980).
Over the last 10--15 years, there have been many studies on pathogenesis-related (PR) proteins and their role in plant de-fense (Collinge and Slusarenko 1987, Bol and Linthorst 1990, Kolesnik 1991, Linthorst 1991). Recent studies have demon-strated wound-inducible chitinase genes in poplar (Populus) (Davis et al. 1991), and investigations of Scots pine (Pinus sylvestris L.) and Norway spruce (Picea abies (L.) Karst.) have shown that some proteins are induced in response to abiotic stress----a finding that is consistent with the well characterized responses to abiotic stresses observed in agricultural plants (Sandermann et al. 1989). General comparative studies of conifer bark proteins are sparse, probably because of the diffi-culties inherent in working with conifer tissue (Ekramoddoul-lah 1991, 1993). Nonetheless, correlation of specific bark proteins with a disease-related phenotype could lead to the possible development of molecular markers for early screening programs, before visible symptoms have developed. Further-more, characterization of such proteins would advance our understanding of their possible role in conifer defense. There-fore, the objective of this study was to determine whether specific bark proteins are correlated with ‘slow canker growth’ resistance in western white pine.
Materials and methods
Bark samples
A slow canker growth reaction known as ‘‘no swelling’’ (R.S. Hunt, Canadian Forest Service, Victoria, B.C., unpublished results) was selected as the resistance phenotype for this study. In November 1992, bark samples were collected from 7-year-old seedling pairs growing in an established progeny test site in Saanichton, B.C. Contrasting pairs (resistant and suscepti-ble phenotypes) were selected from four open-pollinated fami-lies (Seedlots 2391, 2398, 2411, and 2413). Eight individuals were sampled. From each individual, bark (epidermis,
Analysis of bark proteins in blister rust-resistant and susceptible
western white pine (
Pinus
monticola
)
JOANNE DAVIDSON
1,2and ABUL K. M. EKRAMODDOULLAH
11
Canadian Forest Service, Pacific Forestry Centre, 506 West Burnside Road, Victoria, British Columbia V8Z 1M5, Canada
2 University of Victoria, Centre for Forest Biology, Victoria, British Columbia V8W 3P2, Canada
Received September 24, 1996
periderm, cambium, and phloem) was taken from two distinct regions (i) a canker-free, or ‘healthy’ area and (ii) approxi-mately 1 cm distal to the margin of cankered or ‘bark reaction’ areas. Healthy and canker--bark reaction samples were proc-essed separately for each individual.
Extraction of proteins
Samples were stored in plastic bags at --20 °C for 1--2 days, then freeze-dried for 72 h, and ground in liquid nitrogen in a mortar with a pestle. Proteins were extracted from tissue as described by Ekramoddoullah (1993). Unless stated otherwise, all procedures were performed at room temperature (22--23 °C). All chemicals used in the extraction solutions were electrophoresis purity grade. Briefly, 1 ml of extraction solu-tion composed of 5% sucrose (Bio-Rad, Hercules, CA), 5% 2-mercaptoethanol (Sigma, St. Louis, MO) and 4% sodium dodecyl sulfate (SDS, Bio-Rad) at pH 3.8 was added to 50 mg of lyophilized, ground bark tissue and vortexed at high speed for 12--15 min. This mixture was centrifuged at 17,310 g for 15 min. The supernatant was collected, heated over boiling water for 3 min, cooled to room temperature and then purified by the addition of 1.2 ml of ice-cold acetone per 150 µl of extract. The mixture was kept at --20 °C for 1 h and the precipitated proteins were collected by centrifugation at 17,310 g for 10 min. The pellet was re-suspended in 200--250 µl (total volume) of extraction solution containing 1% nonidet (NP-40; Millipore, Toronto, Canada), pH 4.2. Dissolved extracts were heated for 3 min, centrifuged for 5--10 min, and stored at --20 °C. Extracts were concentrated with a Microcon-3 (mo-lecular weight cutoff = 3000 Daltons) microconcentrator (Amicon Canada Ltd., Oakville, Ontario). Because of interfer-ing reagents (i.e., SDS and 2-mercaptoethanol) and the pres-ence of residual phenolic compounds in the extract, a ‘dot blot’ method using polyvinylidene difluoride (PVDF) membranes (Millipore), Coomassie Brilliant Blue R-250 (CBB) stain (Sigma), and a computer-assisted, laser-based densitometer was used to determine total protein concentration (Ekramod-doullah and Davidson 1995).
One-dimensional gel electrophoresis
Individual protein extracts were separated on an equal protein basis by discontinuous SDS polyacrylamide gel electrophore-sis (PAGE), as described by Laemmli (1970), using a Protean 16-cm dual vertical slab gel apparatus (Bio-Rad) and a sepa-rating gel of 12% acrylamide overlaid with a 4% stacking gel. Low molecular weight protein standards (Bio-Rad) ranging from 14.4 to 97.4 kDa were run alongside the bark proteins. Electrophoresis was carried out at a constant current of 10 mA per 0.75 mm stacking gel and 15 mA per 0.75 mm separating gel using a Bio-Rad Model 3000/300 power source. To exam-ine differences between the resistant and susceptible groups, healthy and ‘canker--bark reaction’ protein samples from all contrasting seedling pairs were individually loaded on a single gel (16 lanes). Gels were run in duplicate. To study variation within groups, and between healthy versus lesioned tissue, protein samples from one contrasting seedling pair were loaded in triplicate onto one gel (12 lanes).
Following electrophoresis, gels were fixed and either silver stained (Hochstrasser et al. 1988), or stained with CBB (Fair-banks et al. 1971). Gel scanning was performed with the aid of a laser scanner (Molecular Dynamics, Model 110A, Sunny-vale, CA), and gels were processed with the aid of Protein +DNA ImageWare systems (PDI, Huntington Station, NY). The software program ONED (version 2.4) was used to ana-lyze SDS-PAGE data.
Two-dimensional gel electrophoresis
Analytical two-dimensional (2-D) electrophoresis was carried out in a Millipore Investigator 2-D system. Except where mentioned, all chemicals and reagents used were obtained from Millipore. The isoelectrofocusing (IEF) gels were com-posed of 5.65 ml of gel solution containing 9.5 M urea, 2% NP-40, 4.1% acrylamide and 20 mM 3-[(3-cholamidopropyl)-dimethylammonio]-1-propane-sulfonate (CHAPS, Sigma), 350 µl of 2-D optimized ampholyte solution, and 40 µl of 10% ammonium persulfate.
Electrophoresis was performed on both individual and pooled samples. In all experiments, the total protein loaded per IEF gel was 20--30 µg in a total volume of 20 µl, in a sample buffer composed of 0.1 g dithiothreitol (DTT), 0.4 g CHAPS, 5.4 g urea, 0.5 ml ampholyte solution (pH range 3--10), and 6.5 ml deionized water (Hochstrasser et al. 1988). Anode and cathode buffers consisted of 100 mM phosphoric acid and 100 mM NaOH, respectively. Isoelectric focusing was done for 17.5 h at a constant current of 110 mA per gel.
For the second dimension, IEF gels were extruded and equilibrated for 2 min in a buffer containing 0.3 M Tris (hy-droxymethyl) aminomethane (Tris) base, 0.075 M Tris-HCl, 3% SDS, 50 mM DTT, and 0.01% bromophenol blue (BPB). The IEF gels were overlaid on 20 × 20 cm, 12.5% Duracryl slab gels (0.375 M Tris, pH 8.8, 0.1% SDS) and placed in an anode tank containing 10 l of pre-chilled (12 °C) electrode buffer (25 mM Tris base, 192 mM glycine, 0.1% SDS, pH 8.8). The cathode buffer was twice the concentration of the anode buffer. Gels were run at 20 W per gel for approximately 5 h after which they were removed and fixed overnight in a 50% methanol:10% acetic acid solution. After silver staining (Mor-rissey 1981), gels were laser scanned and processed with the aid of PDI PDQuest computer software (version 4.0) (Garrels et al. 1984). Spot detection and quantitation, gel matching, estimation of isoelectric point (pI) and relative molecular weight (Mr), and statistical analysis (Student’s t-test, P = 0.05)
Western blot
Proteins separated by SDS-PAGE were transferred to PVDF membranes using a standard vertical tank (Model #EBU-100, C.B.S. Scientific Co., Delmar, CA). The transfer buffer con-sisted of 10% methanol in 10 mM 3-(cyclohexylamino)-1-pro-pane sulfonic acid (CAPS), pH 11. Proteins were electroblotted for 20--22 h at a constant voltage of 50 V and a constant temperature of 4 °C. Prestained protein standards (Rainbow standards; Amersham International Plc., Buckinghamshire, U.K.) with molecular weight ranges of 14.3 to 200 kDa were run with the bark proteins.
N-Terminal amino acid sequence analysis
Following transfer to PVDF membranes, immobilized proteins were visualized by CBB staining. Bands were then cut out and placed directly on an amino acid sequencer (Matsudiara 1987). N-Terminal sequence analysis was performed by a gas-phase microsequencer (Model 470A, Applied Biosystems, Foster City, CA) with an on-line PTH-analyzer and Model 900A system controller and data analyzer (Applied Biosystems). A basic local alignment search tool (BLAST) (Altschul et al. 1990) was used to determine homology with existing database sequences.
Immunodetection
Immunodetection of chitinase was performed as described by Tan and Ekramoddoullah (1991), with a 1/750--1/500 dilution of polyclonal barley anti-chitinase (Leah et al. 1991) in Tris-buffered saline, pH 7.5, containing 1% Tween-20 and 1% gelatin.
Results
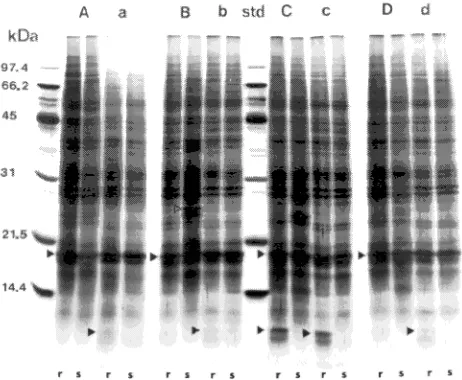
Protein extracts from individual seedlings were separated into 32 to 49 well-resolved bands by SDS-PAGE (Figure 1). Few consistent protein differences were observed from one seed-ling pair to the next; however, within seedlots there were differences between the healthy and lesioned tissues of both resistant and susceptible phenotypes. The number of unique (i.e., present in one group and absent in the other group) proteins was similar in the resistant and susceptible groups (see Table 1). A comparison of all four seedling pairs (in duplicate), in which 32 well-resolved bands were matched, showed that extracts from ‘healthy-resistant’ tissue were more protein-rich than extracts from ‘healthy-susceptible’ tissue. A 26-kDa pro-tein was found almost exclusively near lesioned tissue of susceptible individuals, although a small amount was detected in healthy tissues of one resistant individual from Seedlot 2391. A protein of approximately 10.6 kDa was selectively enriched in resistant individuals. Other proteins separated by SDS-PAGE included a 25.2-kDa band expressed near lesioned tissue in three out of four susceptible individuals. A 24.0-kDa protein was selectively enhanced near lesioned tissue in all four seedling pairs, whereas expression of a 23.4-kDa protein appeared to be completely repressed near lesioned areas of susceptible individuals. A 19 kDa band corresponding to a previously described Pin m III protein (Ekramoddoullah et al.
1995) is seen in Figure 1. This protein was more abundant in susceptible seedlings than in resistant seedlings.
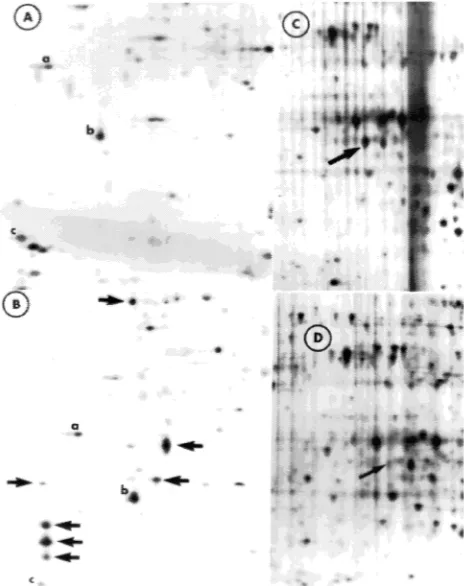
Figure 2 shows representative silver stained gels of pooled proteins from resistant and susceptible groups separated by 2-D electrophoresis. The number of well-resolved spots per gel
Table 1. Molecular mass (kDa) of bark proteins separated by SDS-PAGE. Unique proteins were present only in a resistant or susceptible individual of a contrasting seedling pair. Proteins in bold type corre-spond to the 10.6-kDa protein that was selectively enriched in resistant phenotypes.
Seedlot Healthy tissue Near lesioned tissue
2411-res 54.5 kDa, 45.3 kDa 45.3 kDa, 10.9 kDa 10.9 kDa
2411-sus 12.5 kDa 12.5 kDa, 33.8 kDa 33.0 kDa, 25.7 kDa 2413-res 24.7 kDa, 10.7kDa 44.1 kDa, 22.1 kDa 20.3 kDa, 24.7 kDa
10.7kDa
2413-sus 19.1 kDa 52.0 kDa, 19.1 kDa 2391-res No unique proteins No unique proteins 2391-sus 61.9 kDa, 58.2 kDa 61.9 kDa, 58.2 kDa 34.4 kDa, 25.4 kDa 2398-res 10.5 kDa 36.4 kDa, 20.1 kDa 13.5 kDa, 10.5kDa
2398-sus No unique proteins 25.3 kDa
Figure 1. Representative silver-stained gel of proteins separated by SDS-PAGE from four contrasting seedling pairs. Total protein loaded per lane was 5 µg. (A) and (a) = Seedlot 2413, margin and healthy samples respectively; (B) and (b) = Seedlot 2391, as above; (C) and (c) = Seedlot 2411, as above; (D) and (d) = Seedlot 2398, as above; (r) = resistant individual; (s) = susceptible individual. Low molecular weight marker proteins shown in the ‘std’ lane. Arrows point to protein bands that were sequenced. Open arrow (Bs lane) points to the 26.0-kDa band found in 2391-s; lower solid arrows (lanes ‘ar,’ ‘br,’ ‘Cr,’ ‘cr,’ and ‘dr’) point to the 10.6-kDa protein enriched in resistant seedlings. Large arrow points to a previously described 19-kDa protein (Pinm
ranged from 300 to 400. From a matchset containing 842 spots, there were significant group differences (Student t-test, P = 0.05) for 146 proteins. Of these, 14 were exclusive to the resistant group, 88 were exclusive to the susceptible group, and 44 proteins were common to both groups. Of the 44 proteins common to both groups, 30 were significantly enhanced in the susceptible group.
Twenty-one proteins were selected from the above-men-tioned group of 146 proteins on the basis of their relative quantity and position in the gel (see Table 2). Of these, 16 exhibited a more than threefold quantitative difference be-tween the resistant and susceptible groups, five were unique to the susceptible group, two were unique to the resistant group,
and 14 were common to both groups. Of the 14 common proteins, seven were enhanced in the resistant group and seven were enhanced in the susceptible group. Spot 4613 (33.6 kDa, pI = 5.9) was strongly present in three seedlings within the resistant group, and weakly to moderately present in the fourth group, and in all susceptible seedlings (Figure 3). Spot 1208 (23.3 kDa, pI = 5.1) was strongly present in all susceptible seedlings. Other significant spots (see Table 2) were not con-sistently represented.
From a matchset containing 526 spots, a total of 81 proteins were present in significant amounts (Student’s t-test) in pooled extracts taken from healthy tissues of both groups. Of these proteins, 18 were unique to the resistant group, 35 were unique to the susceptible group, and 28 were common to both groups. Twenty-four of 28 common proteins were enhanced in the resistant group. Table 3 shows 21 proteins selected from the above mentioned 81 proteins on the basis of their relative quantity and position in the gel. Five proteins were unique to the resistant group and four were unique to the susceptible group. Isolation of significant proteins was not attempted. No
Figure 2. Silver-stained two-dimensional electrophoresis gel of pooled proteins from four resistant (A) and four susceptible (B) groups. Molecular weight markers (17.5 to 76 kDa) are shown to the left (vertical axis). On the horizontal axis, pH increases from left to right. Single arrow in (A) points to SSp 4613. Arrows in (B), from top to bottom, point to SSp 402, 1208, 1209, 201 (reversed arrow), 111, 110, and 112.
Table 2. Significant1 bark proteins in susceptible versus resistant P. monticola seedlings displaying the ‘no swelling’ slow canker growth reaction. Italics represent spots significant by Student’s t-test only. Bold text indicates proteins selected for further study on the basis of their relative amounts and their location in the gel.
Sample spot number Isoelectric point Molecular mass (kDa) Protein amount expressed in protein data units (PDU)2 Susceptible Resistant
16 4.5 13.9 76.2 ± 11.9
106 -- 13.9 314.5 ± 65.2
110 4.5 18.0 1040 ± ± 118 18.9 ± ± 5.3
111 4.5 19.0 620.6 ±± 104 18.5 ± ± 7.8
112 4.5 17.2 419.0 ±± 73.6
201 4.5 21.6 125.4 ±± 23.9 18.6 ± ± 0.9
204 5.0 21.8 135.5 ± 22.4
205 5.0 23.3 101.8 ± 16.4 23.7
402 5.0 31.1 237.0 ±± 13.7 14.8
1208 5.1 23.3 829.4 ±± 92.1 46.4 ± ± 2.0
1209 5.1 21.7 331.8 ± ± 54.9
--3304 5.8 27.1 134.0 ± 16.6 274.5 ± 3.9
4610 5.9 34.6 333.7 ± 14.3 497.3 ± 13.2
4613 5.9 33.6 124.1 347.9 ± 16.9
6412 6.7 31.1 -- 101.3 ± 6.2
7108 7.2 16.5 72.7 ± 2.6 17.5 ± 9.3
7511 7.1 31.8 102.6 ± 17.8 479.2 ± 9.6
7518 7.0 32.4 -- 209.3 ± 31.4
8008 8.0 13.8 31.9 152.6 ± 5.6
8518 7.7 32.4 20.7 167.9 ± 16.2
8604 7.8 33.6 192.9 ± 58.1 484.5 ± 3.8
1 Student’s t-test, P = 0.05; foldchange greater than 3. 2
Values are the mean and SD of duplicate pooled samples.
Table 3. Significant1 bark proteins in ‘healthy’ susceptible versus ‘healthy’ resistant P. monticola seedlings displaying the ‘no swelling’ slow canker growth reaction. Italics represent proteins significant by Student’s t-test only. Bold text indicates proteins selected for further study.
Sample spot number Isoelectric point Molecular mass (kDa) Protein amount expressed in protein data units (PDU)2 Susceptible Resistant
213 -- 17.2 181.1 ±± 50.0 405.6 ±± 13.7
502 -- 28.6 86.1 ± 10.1 148.0 ± 4.0
1111 4.8 16.1 -- 59.1 ± 7.6
1401 5.0 25.3 102.7 ±± 26.9 232.2 ±± 12.1
1503 4.6 31.5 200.9 ± 29.2
--1805 4.6 49.8 58.7 ± 0.6 23.7 ± 3.7
2507 5.3 29.4 166.0 ± 3.4
--2606 5.3 31.8 113.8 ± 10.6
--3502 5.5 29.3 219.3 ± 45.9
--3603 5.5 33.7 188.2 ±± 21.3 74.9 ±± 2.4
5704 5.7 34.6 117.8 ± 0.9
--6205 5.8 16.5 213.2 ±± 14.1 36.7 ±± 0.9
6402 5.7 26.7 122.2 ± 6.3 274.9 ± 34.0
6604 5.8 32.9 55.0 ±± 4.5 207.0 ±± 4.4
6707 5.8 35.5 -- 490.2 ± 105.6
7702 5.8 34.4 69.8 ± 4.8 150.3 ± 11.9
7709 5.9 35.4 254.9 ± 5.9 405.6 ± 23.8
7715 5.9 35.0 -- 399.3 ± 45.7
8606 6.5 33.8 -- 141.3 ± 1.3
8707 6.2 35.6 -- 149.8 ± 5.6
9209 6.6 16.3 89.7 ± 9.2 41.4 ± 1.9
correspondence was observed between the spots identified in Tables 2 and 3.
For both healthy and near-lesioned area sample sites, unique (present in one group, absent in the other) proteins were more abundant in the susceptible group. Moreover, near-lesioned areas of the susceptible group had higher relative amounts of common proteins than the resistant group, whereas samples taken from healthy resistant tissue had higher relative amounts of shared proteins than the susceptible group.
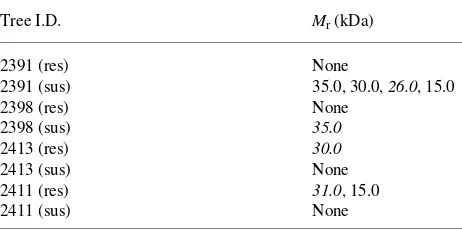
Qualitative differences detected with barley anti-chitinase were inconsistent between susceptible and resistant individu-als. For example, within Seedlot 2391, a 26 kDa immunoreac-tive band was strongly detected in the susceptible individuals but not in the resistant individuals, whereas within Seedlot 2398, a 35 kDa band was observed in the susceptible individu-als but not in the resistant individuindividu-als. In Seedlots 2413 and 2411, 30 and 31 kDa immunoreactive bands, respectively, were observed in resistant individuals but not in susceptible individuals (see Table 4).
Partial N-terminal amino acid sequences of the 26 and 10.6-kDa peptides are shown in Figure 4. Neither protein displayed significant sequence homology with other proteins found in the data bank.
Discussion
The small sample size of this study obviously limits the extent to which inferences may be made from the results obtained. Both the nature of the protein analysis and the availability of living contrasting seedling pairs (many susceptible seedlings had already died) restricted this particular sampling to eight individuals. Pooling of individual protein samples to form two groups became necessary to maximize available protein ex-tracts and to minimize experimental variation. Moreover, limi-tations of the PDQuest software made it necessary to reduce the experiment size to five ‘pooled’ gels versus 20 ‘individual’ gels. Significant proteins identified in pooled samples were later confirmed as ‘present or absent’ in at least two individuals within a group before being considered for further study.
The greater relative abundance of novel proteins in lesioned areas of susceptible versus resistant groups is consistent with
host defense responses that involve selective gene-inactivation or suppression of protein biosynthesis. Rust-resistant white pine individuals may constitutively lack some of the proteins necessary for successful infection, in a manner similar to incompatible agronomic host--pathogen interactions (Van der Plank 1982). The possibility that these proteins are fungal in origin has not been ruled out; however, proteins common to both resistant and susceptible seedlings tended to be generally enriched in lesioned areas of the susceptible group, whereas common proteins from healthy tissue were enriched in the resistant group. This further suggests that biosynthesis of se-lective proteins may be suppressed in the resistant group.
Many of the proteins (Tables 2 and 3) identified by 2-D electrophoresis shared similar mass and charge characteristics with known pathogenesis-related proteins. Such proteins are traditionally characterized as being of low molecular weight (i.e., less than 40 kDa), extractable at low pH, protease-resis-tant, and specifically induced in response to biotic and abiotic stresses (Kombrink et al. 1988, Bol and Linthorst 1990); how-ever, most PR proteins remain functionally uncharacterized. Of seven different proteins ranging in weight from 17 to 42 kDa, and shown to accumulate in azuki bean leaves in response to ethylene treatment, only one protein (27 kDa) was functionally identified as an acidic chitinase (Ishige et al. 1991).
Because of low constitutive amounts of total protein, and the phenolic contamination of our extracts, we were unable to isolate most of the significant protein bands seen in Table 1. However, the successful partial N-terminal amino acid se-quence of the 10.6 and 26.0 kDa peptides will facilitate the development of probes (antibody or nucleotide) that can be used on a larger sample. Interestingly, the 26-kDa band was found to correspond to a 26.0-kDa immunoreactive band (anti-chitinase) observed near lesions in a susceptible, but not in a resistant seedling from the same family (Seedlot 2391). Simi-lar bands were present in the healthy tissue of both resistant
Table 4. Relative molecular weight (Mr, kDa) of barley anti-chitinase
immunoreactive bands. Bands with strong relative signals are listed. Italicized values indicate qualitative differences within seedling pairs (i.e., band present in one seedling and absent in the other).
Tree I.D. Mr (kDa)
2391 (res) None
2391 (sus) 35.0, 30.0, 26.0, 15.0
2398 (res) None
2398 (sus) 35.0
2413 (res) 30.0
2413 (sus) None
2411 (res) 31.0, 15.0
2411 (sus) None
and susceptible seedlings from Seedlots 2411 and 2398, pro-viding circumstantial evidence that the 26-kDa band is of host origin, and is repressed in diseased tissue. The 10.6-kDa band needs to be correlated with phenotypic resistance in a sample of statistically valid size.
Acknowledgments
The authors acknowledge Dr. Richard Hunt for suggesting this project, for providing bark samples, and for his ongoing interest and encour-agement; Ms. Sandy Kielland of the University of Victoria for techni-cal assistance with N-terminal amino acid sequence analysis; and Dr. Barbara Hawkins of the University of Victoria for her interest and suggestions. This work was supported by Forest Research Develop-ment AgreeDevelop-ment (FRDA) II Grant No. FC-BT-007 to AKME. Part of this work was previously presented at the British Columbia regional meeting of the Canadian Phytopathological Society and published as an abstract (Davidson and Ekramoddoullah, 1994. Can. J. Plant Pathol. 16:72). JJD was the recipient of a University of Victoria Graduate Fellowship.
References
Altschul, S.F., W. Gish, W. Miller, E.W. Myers and D.J. Lipman. 1990. Basic logical alignment search tool. J. Mol. Biol. 215:403--410. Bingham, R.T., R.J. Hoff and G.I. McDonald. 1971. Disease
resis-tance in forest trees. Annu. Rev. Phytopathol. 9:433--452. Bol, J.F. and H.J.M. Linthorst. 1990. Plant pathogenesis-related
pro-teins induced by virus infection. Annu. Rev. Phytopathol. 28:113--138.
Collinge, D.B. and A.J. Slusarenko. 1987. Plant gene expression in response to pathogens. Plant Mol. Biol. 9:389--410.
Davis, J.M., H.R.G. Clarke, H.D. Bradshaw, Jr. and M.P. Gordon. 1991. Populus chitinase genes: structure, organization, and similar-ity of translated sequences to herbaceous plant chitinases. Plant Mol. Biol. 17:631--639.
Ekramoddoullah, A.K.M. 1991. Analyses of proteins of western white pine (Pinus monticola D. Don) needles. In Rusts of Pine. Eds. Y. Hiratsuka, P.V. Blenis, P.E. Crane and B.L. Laishley. For. Can., Northwest Reg., North. For. Centre, Edmonton, Alberta. Inf. Rep. NOR-X-317, pp 102--108.
Ekramoddoullah, A.K.M. 1993. Analysis of needle proteins and N-ter-minal amino acid sequences of two photosystem II proteins of western white pine (Pinus monticola D. Don). Tree Physiol. 12:101--106.
Ekramoddoullah, A.K.M. and J.J. Davidson. 1995. A method for the determination of conifer foliage protein extracted using sodium dodecyl sulfate and mercaptoethanol. Phytochem. Anal. 6:20--24. Ekramoddoullah, A.K.M., D. Taylor and B.J. Hawkins. 1995.
Charac-terization of a fall protein of sugar pine and detection of its homo-logue associated with frost hardiness of western white pine needles. Can. J. For. Res. 25:1137--1147.
Fairbanks, G., T.L. Steck and D.H.F. Wallach. 1971. Electrophoretic analysis C of the major polypeptides of human erythrocyte mem-brane. Biochemistry 10:2606--2616.
Flora of North America Editorial Committee. 1993. Flora of North America: North of Mexico. Volume 2: Pteridophytes and Gymno-sperms. Oxford University Press, New York, 380 p.
Garrels, J.I., J.T. Farrar and C.B. Burwell IV. 1984. The QUEST system for computer-analyzed two-dimensional electrophoresis of proteins. In Two-Dimensional Gel Electrophoresis of Proteins: Methods and Applications. Eds. J.E. Celis and R. Bravo. Academic Press, Inc., Toronto, pp 37--91.
Hochstrasser, D.F., M.G. Harrington, A.-C. Hochstrasser, M.J. Miller and C.R. Merril. 1988. Methods for increasing the resolution of two-dimensional protein electrophoresis. Anal. Biochem. 173:424--435.
Hoff, R.J. and G.I. McDonald. 1980. Improving rust-resistant strains of inland western white pine. USDA For. Serv., Research Paper INT-245, Ogden, UT, 13 p.
Hunt, R.S. 1990. Blister rust in inoculated and plantation-tested West-ern white pine in British Columbia. Can. J. Plant Pathol. 12:279--282.
Ishige, F., K. Yamazaki, H. Mori and H. Imaseki. 1991. The effects of ethylene on the coordinated synthesis of multiple proteins: Accu-mulation of an acidic chitinase and a basic glycoprotein induced by ethylene in leaves of Azuki bean, Vigna angularis. Plant Cell Physiol. 32:681--690.
Kolesnik, L.V. 1991. Synthesis and possible functions of plant proteins during the hypersensitive response. Fiziol. Rast. 38:1005--1013. Kombrink, E., M. Schröder and K. Hahlbrock. 1988. Several
‘‘patho-genesis-related’’ proteins in potato are 1,3-glucanases and chiti-nases. Proc. Natl. Acad. Sci. USA 85:782--786.
Laemmli, U.K. 1970. Cleavage of structural proteins during the as-sembly of the head of bacteriophage T4. Nature 227:680--685. Leah, R., H. Tommerup, I. Svendsen and J. Mundy. 1991. Biochemical
and molecular characterization of three barley seed proteins with antifungal properties. J. Biol. Chem. 266:1564--1573.
Linthorst, H.J.M. 1991. Pathogenesis-related proteins of plants. Crit. Rev. Plant Sci. 10:123--150.
Matsudiara, P. 1987. Sequence from picomole quantities of proteins electroblotted onto polyvinylidene diflouride membranes. J. Biol. Chem. 262:10035.
Morrissey, J.H. 1981. Silver stain for proteins in polyacrylamide gels: a modified procedure with enhanced uniform sensitivity. Anal. Biochem. 117:307--310.
Sandermann, H., Jr., R. Schmitt, W. Heller, D. Roseman and C. Lange-bartels. 1989. In Acid Deposition: Sources, Effects, and Controls. Ed. J.W.S. Longhurst. Technical Commun., Letchworth, Herts, U.K., pp 243--254.
Tan, Y. and A.K.M. Ekramoddoullah. 1991. Immunochemical charac-terization of the entomopathogenic fungus Beauveria bassiana. J. Invert. Pathol. 57:269--276.
Theis, W.G. and R.N. Sturrock. 1995. Laminated root rot in western North America. USDA For. Serv., Pacific Northwest Res. Stn. Gen. Tech. Rep. PNW-GTR-349, Portland, OR, 32 p.