Consumer and instrumental evaluation of Maine wild
blueberries for the fresh pack market
D.W. Donahue *, P.W. Benoit, B.J. Lagasse, W.R. Buss
Biosystems Science and Engineering Department,5710 Norman Smith Hall,Uni6ersity of Maine,Orono,ME04469-5710, USA
Received 10 July 1999; accepted 2 April 2000
Abstract
Maine wild blueberries prepared for the fresh pack market compete with cultivated blueberries for market share. In an effort to increase market share, Maine producers are seeking an understanding of consumer preference and how it relates to objective blueberry quality measures. Consumer and instrumental measurements were evaluated over a 3-year period from 1996 to 1998. Freshly harvested blueberries were sized according to diameter; 6 – 8, 9 – 10 and 11 – 12 mm. A consumer panel, recruited from the university and surrounding communities, ranged in age from 18 to 62 and was geographically and gender diverse. The panel was presented the various size classes of blueberries monadically in balanced random order and asked to rate the samples on a nine-point hedonic scale. Quasi-static compression measurements of firmness were paired with these individual sensory measurements. Statistical regression models and back propagation neural networks were used to determine and predict consumer response from the instrumental response. There seemed to be a compression of the consumer data to the upper end of the hedonic scale. Year and time of season were significant for the overall consumer response and the force and firmness instrumental measurements. Berry size was significant with respect to all sensory and instrumental measurements. The results of the overall sensory and instrumental evaluation revealed that size class 9 – 10 mm was the ideal size for fresh market selection, however, panelists preferred the large (11 – 12 mm) berries in visual acceptance evaluations. The statistical regression analysis revealed no linear relationships except for the size class 9 – 10 mm, where positive linear relationships were found between sensory and instrumental measurements. The neural networks were poor predictors of the sensory data based on the instrumental data. These findings highlight the difficulties in characterizing consumer preference with instrumental and hedonic measurements. © 2000 Elsevier Science B.V. All rights reserved.
Keywords: Sensory analysis; Blueberry; Physical properties; Statistical regression; Neural networks; Vaccinilim angastiofolium; Quality
www.elsevier.com/locate/postharvbio
1. Introduction
Maine wild (lowbush) blueberries (berries) are marketed by three methods, individually quick frozen (IQF), canned, and fresh pack for market. The fresh pack market is less elastic than the IQF
* Corresponding author. Tel.: +1-207-5812728; fax: + 1-207-5812725.
E-mail address: [email protected] (D.W. Donahue).
market because of the fragility of the product. Also, Maine wild fresh pack blueberries must compete for the end-of-season market in local, regional and national markets with cultivated (highbush) blueberries (D.K. Bell, Maine Wild Blueberry Commission, pers. comm.). Therefore, the fresh pack processors need as much informa-tion concerning their product as possible to remain competitive in the marketplace. In an effort to assist these processors with product information, a long-term study of the consumer and instrumental properties was initiated in 1996. The information provided herein summarizes findings of the first 3 years of study.
1.1. Sensory and instrumental response
Other researchers have determined similar rela-tionships between mechanical (textural) attributes and sensory qualities of fresh or processed fruits and vegetables (Abbott et al., 1984; Holt and Schoorl, 1984). These researchers found a positive relationship between instrumental measurements of mechanical properties (textural measurements) and sensory response data for apples and peaches, respectively. Donahue and Work (1998) and Don-ahue et al. (1999) related the sensory and
compres-sion textual measurements of Maine wild
blueberries and found a relationship between the firmness (slope of force – deformation curve) to an overall classification of consumer preference.
Rousset et al. (1995) used principal component analysis (PCA) techniques to illustrate high corre-lation between some sensory characteristics and instrumental measurements. They also showed a weak correlation between a sensory firmness
mea-sure and the firmness meamea-sured as a result of extrusion. Truong et al. (1997) established relation-ships between instrumental and sensory parameters of cooked sweet potato showing that measured shear stress accounts for most of the sensory response. Harker et al. (1997) evaluated several fruits and vegetables with both instrumental and sensory measurements. They demonstrated that shear, tensile and puncture measurements have a curvilinear relationship with sensory assessments of tissue hardness.
1.2. Neural network classification
In recent years, the use of Artificial Neural Networks (ANN) as prediction models for sensory-instrumental relationships has been investigated (Thai and Shewfelt, 1991; Bardot et al., 1994; Wilkinson and Yuksel, 1997). The robustness and
self-learning (Lippmann, 1987) properties of
ANNs are beneficial for modeling complex un-structured human judgement (Applegate et al., 1988). The architecture of an ANN refers to the number of layers and nodes in each layer. Feed-for-ward multi-layer perceptron networks, used in this study, consist of source nodes that constitute the input layer, one or more hidden layers of compu-tation nodes, and an output layer of compucompu-tation nodes. Fig. 1 is an example of a feed-forward network with a 2-2-1 architecture. A signal propa-gates through the network in a forward direction on a layer by layer basis (Haykin, 1999). Nonlinear sigmoid transfer functions are used in the hidden layer nodes to enable learning of any non-linear relationships between input and output variables. The training of an ANN involves automated itera-tive adjustment of the connections between nodes via a training algorithm. The error back propaga-tion (BP) algorithm makes adjustments based on the error between historical data and network predictions. BP is a common algorithm used in
sensory-instrumental prediction (Thai and
Shewfelt, 1991; Wilkinson and Yuksel, 1997). Measurement of texture is an important aspect of objective assessment of quality in fruit and vegetables. The goal of these studies is to relate consumer preference to physical attributes (firm-ness, flavor) thereby informing producers what
objectively measured attributes relate to consumer preference enabling Maine wild blueberry fresh pack selective packaging. The background infor-mation above provided a basis for the objectives of this project, which are:
1. determine whether instrumental measurements can predict consumer preference of Maine wild blueberries; and
2. determine whether statistical regression and/or neural network classifications techniques accu-rately predict consumer preference for Maine wild blueberries using data sets obtained in 1996, 1997 and 1998.
2. Materials and methods
2.1. Laboratory preparation
Based on previous results of unpublished stud-ies, mid season or late season was selected for these studies. Because of the length of the harvest season in 1997, it was possible to perform two panel studies, one mid season and one late season; the length of the 1996 and 1998 seasons allowed only one mid season panel to be completed. The following describes the laboratory preparation for each trial.
Blueberries were purchased on the same day they were harvested from the same fresh pack producer cooperative in Jonesboro, Maine. The fruit selected were of similar ripeness. The berries were packed into 13.61 kg boxes and transported to the University of Maine (UMaine) for further processing. At the UMaine Biological Engineering Laboratory the blueberries (berries) were sepa-rated into three size classes based on diameter, 6 – 8, 9 – 10, and 11 – 12 mm, using standard sizing templates and stored overnight at 10°C to await consumer and instrumental evaluation.
2.2. Consumer preference(sensory panel)
For each consumer preference test, 80 volunteer panelists were recruited on the day of the panel, from the University of Maine and surrounding communities, and were asked to rate the flavor, texture and overall attributes of the berries using
a nine-point hedonic scale (1, dislike extremely to 9, like extremely). Single teaspoon-sized three-digit coded samples of each size class were pre-sented to panelists in standard 118 ml souffle cups, monadically, in balanced random order. Panelists worked in individual booths with ample natural lighting supplemented by fluorescent light-ing approximately 2 m above booths. Panelists were instructed to evaluate each sample thor-oughly on their palate and rinse with commercial spring water between sample evaluations. Samples were evaluated at room temperature, approxi-mately 23°C, and the consumer panel was per-formed between 10:00 – 13:00 h. Ranked size preference for the berries was determined follow-ing the acceptability evaluation and was con-ducted in a separate testing area with similar lighting as described above. The size preference samples were presented in white porcelain bowls, approximately three tablespoons per sample. Then, general demographic data were obtained from the panelists, in particular, home state data were recorded to determine if there were regional panel bias. Purchasing information was also ob-tained from the panelists.
2.3. Instrumental measurements
As the teaspoon-size sample was drawn from the size class for the consumer panelist, a corre-sponding sub-sample of three individual blueber-ries from each size class was taken and a compression test following American Society of Agricultural Engineers (1995) standard was
per-formed using a FirmTech1® firmness instrument
(BioWorks, Inc., Stillwater, OK). Therefore, the consumer panel and mechanical tests were paired. The methods used for parallel plate compression testing are detailed in Donahue and Work (1998) and Donahue et al. (1999). Individual berries were
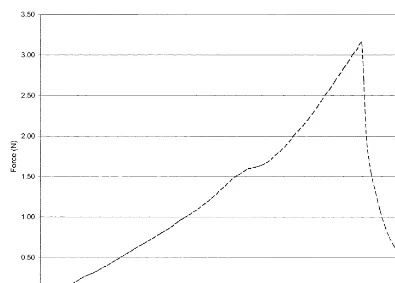
compressed at 50 mm s−1
to the point of rupture (usually 25% of berry diameter), where force and deformation were recorded electronically. Fig. 2 gives a typical force-deformation curve that
was recorded. Firmness (N m−1) was calculated
Fig. 2. An average force versus deformation curve collected illustrating the characteristic non-linear elasticity.
2.4. Data analysis, statistical regression
Simple general linear regression models
(GLMs) were developed to examine sources of variation and differences among years for the consumer and instrumental measurements (SAS, 1991). The GLMs were also used to predict rela-tionships between the consumer and instrumental measurements.
A Friedman two-way analysis of variance (AOV) for non-parametric data was performed to analyze differences related to berry size prefer-ences and purchase ranking scores (Steel et al., 1997). The Friedman test evaluates the null hy-pothesis that populations (rankings in this case) are identical. The berry size ranking was used to determine panelist size preference among the three size classes. The purchase ranking asked the pan-elist to rank which was most important: price; size; or availability.
2.5. Neural networks
potential training problems associated with the use of sigmoid transfer functions in the hidden layer(s). The RBP algorithm utilizes only the sign of the derivative to determine whether an update of weights connecting the nodes in the network is necessary (further information on RBP may be found in Neural Network Toolbox for use with Matlab, Demuth and Beale, 1998).
Training of all networks was carried out for a maximum of 300 epochs. Two data sets consisting of force and firmness measurements that were correlated with the overall consumer preference response were used to test and train the different networks. Data set 1 consisted of 755 data points for all sizes of blueberries while data set 2 con-sisted of 256 data points for only blueberries in the 9 – 10 mm size class. The results of the statisti-cal modeling analysis led us to evaluate the use of data set 2. Forty percent of the data in each set were used for training; the remaining 60% were used to test network performance. The percent error (number of times a prediction is wrong out of the test trials) was calculated as various net-works were tested. The percent error was then used to compare performance of different net-works to each other as well as to regression models for each size class of berries.
3. Results
3.1. General trends
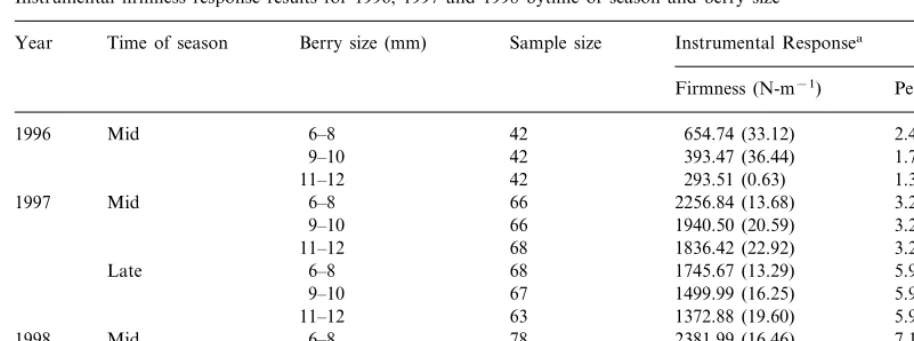
The basic sensory and instrumental data are summarized in Tables 1 and 2, respectively. The first season of the study (1996) seemed to yield comparatively soft fruit. There is no documented reason for this anomaly except that the fruit harvest may have been more late-season instead of mid-season. As is seen in Table 1, the general trend is for overall preference for larger (9 – 10, 11 – 12) berries. In Table 2, the peak force tends to be higher for the 1998 season. Firmness tends to be higher in the 6 – 8 mm size class over all seasons. This observation follows physical laws of geometry, and turgor pressure. Also seen in Table 2 is that peak force tends to be approximately the same within season and less effected by size class.
Berry size was significant (PB0.05) for the
consumer responses of flavor, texture, and overall as well as the instrumental responses of firmness and force. Regression analysis confirmed that the year of harvest and time of season was significant (PB0.05) with both instrumental responses
(firm-ness and force). Regression revealed no significant
(PB0.05) relationships between the consumer
re-Table 1
Consumer response results for 1996, 1997 and 1998 by time of season and berry size
Time of season Berry size (mm)
Year Sample size Consumer Responsea,b
Flavor Texture Overall
Mid
1996 6–8 42 6.05 (31.57) 5.98 (32.44) 5.95 (31.26)
9–10 42 7.10 (10.70) 6.93 (24.10) 7.24 (20.17)
7.12 (19.24)
11–12 42 7.07 (21.78) 7.02 (19.52)
6.61 (23.45) 6.67 (20.99)
1997 Mid 6–8 66 6.71 (22.80)
6.94 (17.00)
9–10 66 7.05 (18.16) 6.55 (22.14)
6.84 (21.93)
9–10 67 7.30 (16.30) 7.09 (19.61)
11–12 63 6.95 (23.74) 6.21 (28.34) 6.75 (23.11) 78
6–8 Mid
1998 6.18 (28.32) 5.86 (30.20) 6.12 (28.92)
6.69 (24.36) 6.41 (29.02)
9–10 78 6.74 (25.07)
11–12 75 7.01 (22.11) 6.63 (26.70) 6.87 (22.85)
aAverage shown is based on nine point hedonic scale.
Table 2
Instrumental firmness response results for 1996, 1997 and 1998 bytime of season and berry size
Time of season
Year Berry size (mm) Sample size Instrumental Responsea
Firmness (N-m−1) Peak force (N)
6–8 42
1996 Mid 654.74 (33.12) 2.47 (33.39)
9–10 42 393.47 (36.44) 1.70 (27.75)
11–12 42 293.51 (0.63) 1.39 (26.70)
6–8 66
Mid 2256.84 (13.68)
1997 3.24 (1.39)
9–10 66 1940.50 (20.59) 3.22 (1.28)
11–12 68 1836.42 (22.92) 3.20 (1.13)
Late 6–8 68 1745.67 (13.29) 5.91 (5.63)
9–10 67 1499.99 (16.25) 5.95 (2.02)
11–12 63 1372.88 (19.60) 5.95 (1.62)
6–8
1998 Mid 78 2381.99 (16.46) 7.11 (2.78)
9–10 78 2064.86 (19.63) 7.04 (3.62)
11–12 75 1947.16 (27.07) 7.01 (1.27)
aCoefficient of variation is given in parenthesis beside each value.
sponse and the instrumental responses. Removing the 1996 season data from regression analysis did not significantly alter the regression results.
Panelists’ geographic area of origination (north-ern New England vs. other) and gender were not significantly related to consumer preference, size preference or purchasing attributes. A Friedman two-way AOV measuring differences among
pan-elists, showed they preferred the larger
berries (11 – 12 mm) when they judged them visu-ally together. There were also no significant differ-ences among panelists’ reasons for purchasing fresh or frozen blueberries (price, size or availabil-ity).
3.2. Regression analysis
Since berry size was significant, the data were separated by berry size for further regression anal-ysis. GLMs were constructed where the consumer responses were regressed against the instrumental responses. For the 6 – 8 and 11 – 12 mm size classes there were no significant relationships between any of the consumer and instrumental responses. However, the 9 – 10 mm berry size showed a sig-nificant (PB0.05) positive correlation between all
sensory responses (flavor, texture, and overall) and the firmness instrumental response; the rela-tionship held true regardless of year. The impact
of this result could be useful in size sorting for the fresh pack market.
3.3. Neural network analysis
Table 3 compares the measures of performance for the best ANN for both data sets as well as the regression model developed from the 9 – 10 mm size class data. Endeavors to develop an ANN consumer predictor from instrumental measure-ments yielded poor results. Networks trained with data set 1 (all size classes included) fail to cor-rectly predict overall consumer response 88 – 100% of the time. Training with data set 2 (9 – 10 mm size class) produced slightly better results, yet still produced a very high percent error ranging from 62 to 72%. The percent of incorrect predictions
Table 3
Measures of performance for the best ANNs and the regres-sion model
SSE 265 1347 274
1.79 3.56
1.73 MSE
aTrained and tested with data form the 9–10 mm size class
slightly increased with an increase in network complexity, as number of nodes in the hidden layer was increased and the second hidden layer was added. By comparison, use of regression models to predict overall consumer response of-fered no improvement in the percent error. The regression model based on blueberries in the 9 – 10 mm size class produced the lowest percent error value of 62.5%, which is equivalent to the lowest error rate by any of the ANNs.
4. Discussion and conclusions
The year and season effect exhibited in the data suggest that berries get softer as time of season increases; this agrees with earlier studies (Don-ahue and Work 1998; Don(Don-ahue et al., 1999). There seems to be no regional or gender bias in the consumer panel. Overall panelists show a buy-ing preference for larger berries. The positive
rela-tionships between sensory and instrumental
measurements found in the 9 – 10 mm size class are interesting. From these results, it seems that the 9 – 10 mm size class was rated higher by consumer panelists, despite their stated preference for larger berries, therefore the 9 – 10 mm size class would be the ideal size for the Maine wild blueberry fresh pack market, with respect to firm-ness and overall quality. The authors feel that the majority of the people volunteering to participate on these consumer panels were pre-disposed to like blueberries. This is supported by the fact that
81.7% (617/755) of all overall sensory response
data were greater than a value of five on the hedonic scale. This suggests that self-selection of the blueberry consumer panel contributed to shift the consumer preference to the higher end of the hedonic scale. The compression of the hedonic scale as evidenced here follows similar discussions of Harker et al. (1997).
Comparison of the ANN and the regression model shows that neither will serve as an ade-quate consumer-instrumental predictor. The poor prediction capabilities of the ANNs and regres-sion models may be attributed to the large varia-tion in the consumer and instrumental data. This variation may be due to a lack of correlation
between the consumer response and the instru-mental measurements or to the huge variation in the berries themselves as evidenced by the coeffi-cient of variation for instrumental measurements in Table 2.
Based on the analysis of these Maine wild blueberry data the use of instrumental measure-ments to predict consumer sensory response is not possible. Further, using statistical regression and neural networks to predict consumer preference is not possible. However, these findings highlight the importance of collecting consumer data when de-veloping a method of berry sorting for the fresh pack market. It also underscores the need to find objective measures that relate to the consumer data and not vice versa.
Acknowledgements
The authors would like to express their appreci-ation to Dorothy deBruyne, John Fecteau and Matthew Pardilla for their assistance in the con-sumer and instrumental data collection portions of the study. We would also like to thank Del-mont Emerson, blueberry producer, for his tech-nical assistance during the study.
References
Abbott, J.A., Watada, A.E., Massie, D.R., 1984. Sensory and instrument measurement of apple texture. J. Am. Soc. Hort. Science 109 (2), 221 – 228.
American Society of Agricultural Engineers, 1995. ASAE S368.3 MAR95. ASAE standards 1995. In: Standards En-gineering Practices Data, 42nd edn. ASAE, St. Joseph, MI, pp. 466 – 470.
Applegate, L.M., Cash, J.I. Jr, Mill, D., 1988. Information technology and tommorrow’s manager. Havard Bus. Rev. 66 (6), 128.
Bardot, I., Bochereau, L., Martin, N., Palagos, B., 1994. Sensory-instrumental correlations by combining data anal-ysis and neural network techniques. Food Qual. Prefer. 5, 159 – 166.
Demuth, H., Beale, M., 1998. Neural Network Toolbox for use with Matlab: User Guide, Version 3. The Math Works Inc, Natick, MA.
Donahue, D.W., deBruyne, D.A., Fecteau, J.D., Storey, J.A., Hazen, R.A., 1999. Textural evaluation and consumer preference of Maine wild blueberries for the fresh pack market. J. Food Qual. 22 (5), 545 – 551.
Harker, F.R., Stec, M.G.H., Hallet, I.C., Bennett, C.L., 1997. Texture of parenchymatous plant tissue: a comparison between tensile and other instrumental and sensory mea-surements of tissue strength and juiciness. Postharvest Biol. Technol. 11, 63 – 72.
Haykin, S., 1999. Neural Networks: A Comprehensive Foun-dation, 2nd ed. Prentice Hall, Upper Saddle River, NJ. Holt, J.E., Schoorl, D., 1984. Mechanical properties and
tex-ture of stored apples. J. Textex-ture Studies 15, 377 – 394. Lippmann, R.P., 1987. An introduction to computing with
neural nets. Inst. Electr. Electron. Eng. Acoust. Speech Signal Process. Mag. 4(2), (April 1987), 4 – 22.
Mohsenin, N.N., 1986. Physical Properties of Plant and Ani-mal Materials: Structure, Physical Characteristics, and Me-chanical Properties, 2nd ed. Gordon and Breach, New York, NY, pp. 225 – 347.
Rousset, S., Pons, B., Pilandron, C., 1995. Sensory texture profile, grain physico-chemical characteristics and instru-mental measurements of cooked rice. J. Texture Studies 26, 119 – 135.
Statistical Analysis System, 1991. SAS Language, Version 6. SAS Institute Incorporated, Cary, NC.
Steel, R.G.D., Torrie, J.H., Dickey, D.A., 1997. Principles and Procedures of Statistics: A Biometrical Approach. Mc-Graw-Hill, Boston, MA, pp. 580 – 582.
Thai, C.N., Shewfelt, R.L., 1991. Modeling sensor color qual-ity of tomato and peach: neural networks and statistical regression. Trans. ASAE 34 (3), 950 – 955.
Truong, V.D., Walter, W.M. Jr, Hamann, D.D., 1997. Rela-tionship between instrumental and sensory parameters of cooked sweetpotato texture. J. Texture Stud. 28 (2), 163 – 185.
Wilkinson, C., Yuksel, D., 1997. Using artificial neural net-works to develop prediction models for sensory-instrumen-tal relationships; an overview. Food Qual. and Prefer. 8 (5 – 6), 439 – 445.