Jurnal Administrasi Bisnis (JAB)|Vol. 46 No. 2 Mei 2017| administrasibisnis.studentjournal.ub.ac.id
9
THE EFFECT OF FINANCIAL RISK AND ENVIRONMENTAL RISK ON
EARNINGS
(Case Study of PT Bank Tabungan Negara (Persero) Tbk Period 2006-2015)
Adelia Damayanti Mochammad Al Musadieq Faculty of Administrative Science
Brawijaya University Malang
E-mail: [email protected]
ABSTRAK
Tujuan penelitian ini yaitu untuk menjelaskan pengaruh Capital Adequacy Ratio (CAR), Non-Performing Loan Ratio (NPL), dan BI Rate terhadap Return on Equity (ROE) dan Return on Asset (ROA). Objek penelitian ini adalah PT Bank Tabungan Negara (Persero) Tbk. Jenis penelitian ini yaitu penelitian eksplanatif dengan pendekatan kuantitatif dan menggunakan metode analisis regresi linier berganda. Sampel dalam penelitian ini berjumlah 40 data untuk setiap variabel bebas dan variabel terikat. Jenis data merupakan data sekunder yang terdiri dari data time series kuartalan dari kuartal I 2006 sampai kuartal IV 2015. Hasil penelitian ini menjelaskan bahwa: 1) CAR, NPL, dan BI Rate berpengaruh signifikan terhadap ROE secara simultan; 2) CAR, NPL, dan BI Rate berpengaruh signifikan terhadap ROA secara simultan; 3) CAR berpengaruh positif signifikan terhadap ROE secara parsial; 4) NPL berpengaruh negatif signifikan terhadap ROE secara parsial; 5) BI Rate berpengaruh positif signifikan terhadap ROE secara parsial; 6) CAR berpengaruh positif signifikan terhadap ROA secara parsial; 7) NPL berpengaruh negatif tidak signifikan terhadap ROA secara parsial; 8) BI Rate berpengaruh negatif tidak signifikan terhadap ROA secara parsial. Hasil penelitian ini menunjukkan bahwa untuk meningkatkan profitabilitas, Bank BTN sebaiknya meningkatkan kecukupan modal, menurunkan resiko kredit, dan mengantisipasi kebijakan makroekonomi.
Kata kunci: Risiko keuangan, risiko lingkungan, laba
ABSTRACT
The objective of this research was to explain the effect of Capital Adequacy Ratio (CAR), Non-Performing Loan Ratio (NPL), and BI Rate on Return on Equity (ROE) and Return on Asset (ROA) simultaneously and partially. The object was PT Bank Tabungan Negara (Persero) Tbk. This research type was explanatory research with quantitative approach and used multiple linier regression analysis method. The samples were 40 data for each independent and dependent variable. The data were the secondary data which consist of quarterly time series data from quarter I 2006 to quarter IV 2015. The results explained that: 1) CAR, NPL, and BI Rate had significant effect on ROE simultaneously; 2) CAR, NPL, and BI Rate had significant effect on ROA simultaneously; 3) CAR had significant positive effect on ROE partially; 4) NPL had significant negative effect on ROE partially; 5) BI Rate had significant positive effect on ROE partially; 6) CAR had significant positive effect on ROA partially; 7) NPL had insignificant negative effect on ROA partially; 8) BI Rate had insignificant negative effect on ROA partially. This research results showed that to increase the profitability, Bank BTN should increase capital adequacy, decrease credit risk, and anticipate macroeconomic policy.
Jurnal Administrasi Bisnis (JAB)|Vol. 46 No.1 Mei 2017| administrasibisnis.studentjournal.ub.ac.id
10
INTRODUCTION
Bank is defined as business entities that collects funds from society in the form of savings and distribute it again to society in the form of credits and or other forms in order to improve the living standard of people (Indonesian Law No 10 Year 1998). Bank serves as financial intermediary between people who have excess funds to people who need funds. Bank contributes to the business and economic growth through that function, however, bank performance also very affected by the business and economic condition, so that, bank, business, and economic condition are dramatically interdependent.
Generally, banks are subjected to financial, operational, and environmental risks. Financial risks are risks that are caused by financial decisions. The financial decisions can result in loss for bank if they are not properly managed and can result in a profit if they are well organized. Financial risks also are subject to complex interdependencies that may significantly increase its overall risk profile. Operational risks are risks which are related to the overall business process of banks and the potential impact thereon of compliance with bank policies and procedures, internal system and technology, security of information, measures against mismanagement and fraud, and business sustainability concerns.
Operational risk also encompasses the bank’s
strategic planning, governance, and organizational structure, management of staff careers and internal resources, product and knowledge development,
and costumer acquisition approach.
Environmental risks are risks which are caused by
bank’s business environment, including
macroeconomic policy and policy concerns, legal and regulatory factors, and the overall financial sector infrastructure and payment systems of the jurisdictions in with location it operates. Environmental risks include all types of
exogenous risks that could endanger a bank’s
operations or undermine its ability to continue the business operations. Financial risks consist of capital adequacy and credit risk. Capital adequacy can be measured by using Capital Adequacy Ratio (CAR). Credit risk can be measured by Non-Performing Loan Ratio (NPL). Environmental risk
consists of Macroeconomic Policy.
Macroeconomic policy can be measured by benchmark interest rate or in Indonesia is BI Rate.
The bank’s capacity in managing those risks can impact on its income and earnings (Greuning and Bratanovic, 2009:101-102). Overall understanding of profitability sources and changes in the income
structure for both an individual bank and the banking system is important to all key players in the risk management process. “Risk management is a continual process of corporate risk
monitoring, control, reduction, and management”
(Gupta: 2016:35). It is for this reason that banks must conduct effective risk management to create maximum earnings.
Earnings are the most important factor for a business entities include bank, because the main objective of business entities is to create earnings. The ability of entities to create earnings is referred to the profitability. The profitability is broadly measured by Return on Equity (ROE) and Return on Asset (ROA). If these measures show that the ROE and ROA are higher than other firms in the same industry, it indicates that the bank has the high performance. ROE measures the percentage return of shareholders equity, while ROA measures the ability of the company to create income and earnings by utilizing the assets (Koch & MacDonald, 2015:93)
The number of commercial banks which conduct their activities in Indonesia is 118 banks. From those 118 banks, four of them are state owned banks which take a large effect to the financial sector in Indonesia. In the quarter IV of December 2015, the four state owned banks which consists of PT Bank Mandiri (Persero) Tbk or Bank Mandiri, PT Bank Rakyat Indonesia (Persero) Tbk or Bank BRI, PT Bank Negara Indonesia (Persero) Tbk or Bank BNI, and PT Bank Tabungan Negara (Persero) Tbk or Bank BTN were the first, the second, the fourth, and the seventh larger bank respectively in Indonesia based on total assets. Marta, (2016, March, 14) stated that at that time, the total assets of those four state owned banks reached 40% from total assets of Indonesian banking industry.
Bank BTN had the lowest total assets compared with other state owned banks. International Accounting Standards Board (IASB) (2006) defined that an asset is a resource that is controlled by the entity as a result of past events and from which future economic benefits are expected to flow to the entity, hence, although Bank BTN has been included on the seventh largest bank based on total assets, but it was less productive in managing their past activities
compared with other three state owned banks. “In
normal situations, the growth of a business’s
Jurnal Administrasi Bisnis (JAB)|Vol. 46 No.1 Mei 2017| administrasibisnis.studentjournal.ub.ac.id
11
total asset of Bank BTN is much lower than other three state owned banks so as the ROE and ROA of Bank BTN lower than other three state owned banks.
Bank BTN was established under
Postpaarbank and got many reforms. Now, it serves as the fully commercial bank which focuses on the housing finance and helps the government in implementing the public housing program. As of December 31, 2015, the Bank has 87 branches (including 22 sharia branches), 244 sub-branches (including 21 sharia sub‐branches), 486 cash offices (including 7 sharia cash offices), and 2,951 SOPPs (System on‐line Payment Point/on‐line Post office).
Bank BTN should develop an appropriate risk management decisions to anticipate financial, operational, and environmental risks. An appropriate decision can be constructed by knowing the risks that affect its earnings and understanding the relationship pattern between them, so that, the researcher conduct the research with the objective to explain the effect of Capital Adequacy Ratio (CAR), Non-Performing Loan Ratio (NPL), and BI Rate on Return on Equity
(ROE) and Return on Asset (ROA)
simultaneously and partially of PT Bank Tabungan Negara (Persero) Tbk.
LITERATURE REVIEW Financial Risk
Risk is defined as the probability of an unwanted event that results in negative consequences (Ostrom & Wilhelmsem, 2012:4). Financial risks are risks that are caused by financial decisions. The financial decisions can result in loss for bank if they are not properly managed and can result in a profit if they are well organized. Financial risks also are subject to complex interdependencies that may significantly increase its overall risk profile of bank (Greuning & Bratanovic, 2009:3). From that definition, it can be concluded that banks should be careful in taking decisions in order to avoid the financial risks which is caused by financial decisions. 1. Capital Adequacy
Capital adequacy signals the ability of bank to maintain capital commensurate with the nature and extent of all types of risk, also the ability of management to identify, measure, monitor, and control these related risks (Koch & Macdonald, 2015:127). Latumaerissa (2014:47) explain that capital for banks or other business companies, beside function as the main source for financing source of their
operations, also function as a buffer against potential losses, such as credit risk and
investment risk. Effective capital
management or the ability of bank to maintain its capital adequacy can increase the
profitability of bank and costumer’s security.
Capital adequacy can be measured by Capital Adequacy Ratio (CAR).
a. Capital Adequacy Ratio
Capital Adequacy Ratio (CAR) is ratio of minimum capital of a bank. Bank Indonesia formulated the calculation of CAR by comparing the capital with risk weighted assets. The risk weighted assets are consists of the credit risk, operational risk, and market risk. The change of capital will be affect the CAR value by adding the capital from existing shareholders, planning of Initial Public Offering (IPO), right issue, securities issuance, and other capital increase. 2. Credit Risk
Credit risk is risk that arises from default by counterparty in meeting their obligations (Koch & MacDonald, 2015:127). Credit risk can be measured by using Non-Performing Loan Ratio (NPL).
a. Non-Performing Loan Ratio
Non-Performing Loan Ratio (NPL) measures risk that associated with bank that gives loans, but in the substandard, doubtful, and loss. Because that, bank must be cautioned before giving its loans. NPL is a condition where the debtor could not paid its loans to the bank on due date (Mahmoeddin, 2002:4).
Environmental Risk
Environmental risks are risks which are
caused by bank’s business environment, including
macroeconomic and policy concerns, legal, and regulatory factors, and the overall financial sector infrastructure and payment systems of the jurisdictions in with location it operates (Greuning & Bratanovic, 2009:4). It is relates to changes in the political, economic, social and financial environment over which an organization has little influence, hence, it can be concluded that bank should anticipate and manage the environmental risks that affect its operations properly, because they have little influence to that.
1. Macroeconomic Policy
Jurnal Administrasi Bisnis (JAB)|Vol. 46 No.1 Mei 2017| administrasibisnis.studentjournal.ub.ac.id
12
determination of the benchmark interest rate. Macroeconomic policy can be measured by benchmark interest rate or in Indonesia is BI Rate.
a. BI Rate
In Indonesia, BI Rate is the interest rate with a tenor of one month that is announced by Central Bank or Bank Indonesia (BI) periodically for a certain period and has a function as stance of monetary policy (Siamat, 2005:139). BI rate is determined by Board of Governors of BI in the Board of Governors meeting quarterly in every January, April, July, and October. But in certain conditions, or if is deemed necessary, BI rate can be determined in other months.
Earnings
Earnings are the main determinant of bank’s
capacity to manage risk. The goal of financial management is to maximize the value of a bank, as determined by its profitability and risk level. Since risk is inherent in banking and unavoidable, the task of financial management is to manage risk in such a way that the different types of risk are kept at acceptable levels and profitability is sustained. Doing so requires the continual identification, quantification, and monitoring of risk exposures, which in turn demands sound policies, adequate organization, efficient processes, skilled analysts, and elaborates computerized information systems. In addition, risk management requires the capacity to
anticipate changes and to act so that a bank’s
business can be structured and restructured to profit from the change or at least to minimize losses (Greuning & Bratanovic, 2009:101). From that definition, bank as business entities must have the best strategy to create maximum earnings by managing the risks which are confronted properly. 1. Profitability
Profitability is the ability of company to create profit. Profitability focuses on a
company’s sources and levels of profits and
involves identifying and measuring the impact of various profitability drivers. Besides that, it also includes evaluation of the two major sources of profitability margins and capital utilization. Profitability analysis also focuses on reasons for changes in the profitability and sustainability of earnings
(Subramanyam & Wild, 2009:13).
Profitability can be measured by Return on Equity (ROE) and Return on Asset (ROA). a. Return on Equity
Return on Equity (ROE) is one of ratio that can be used to measure profitability of conventional bank. ROE indicates the earnings after taxes which are received by shareholders from their investment in stock.
b. Return on Asset
Return on asset (ROA) is ratio that can be used to measure profitability of conventional bank. ROA indicates the ability of the company to create income and earnings by utilizing the assets. Hypothesis
H1: Capital Adequacy Ratio (CAR), Non-Performing Loan Ratio (NPL), and BI Rate have significant effect on Return on Equity (ROE) simultaneously.
H2: Capital Adequacy Ratio (CAR), Non-Performing Loan Ratio (NPL), and BI Rate have significant effect on Return on Asset (ROA) simultaneously.
H3: Capital Adequacy Ratio (CAR) has significant effect on Return on Equity (ROE) partially.
H4: Non-Performing Loan Ratio (NPL) has significant effect on Return on Equity (ROE) partially.
H5: BI Rate has significant effect on Return on Equity (ROE) partially.
H6: Capital Adequacy Ratio (CAR) has significant effect on Return on Asset (ROA) partially.
H7: Non-Performing Loan Ratio (NPL) has significant effect on Return on Asset (ROA) partially.
H8: BI Rate has significant effect on Return on Asset (ROA) partially.
RESEARCH METHOD
This research type was explanatory research. Explanatory research aims to provide causal explanations of phenomena (Blanche, et al., 2006:44). Population of this research is all data for each independent and dependent variables. Samples in this research are 40 data which consist of quarterly time series data from quarter I 2006 to quarter IV 2015. This research was used purposive sampling. Data collection technique in this research was documentation. Data analysis methods of this research are as follows:
1. Descriptive Statistics Analysis
Jurnal Administrasi Bisnis (JAB)|Vol. 46 No.1 Mei 2017|
A multiple linier regression model requires the classical assumption test. There are four kinds of classical assumption test which justify the use of a multiple linier regression model as follows:
a) Autocorrelation Test; b) Normality Test;
c) Multicollinearity Test; d) (Cresswell, 2014:209). The inferential statistics analysis is as follows: a) Multiple Linier Regression Model; b) F test; c) T test; d) Determination Coefficient Analysis.
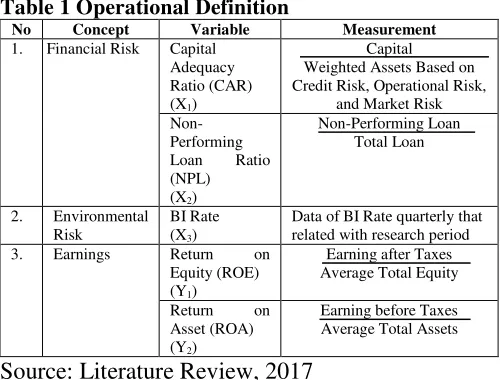
Table 1 Operational Definition
No Concept Variable Measurement
1. Financial Risk Capital
Data of BI Rate quarterly that related with research period Average Total Assets
Source: Literature Review, 2017
RESEARCH RESULT AND DISCUSSION 1. Descriptive Statistical Analysis
Table 2 Descriptive Statistics
Source: Data was Processed, 2017 2. Classical Assumption Test
a. Autocorrelation Test
P value of ROE is greater than significance level (0.149≥0.05). It means that there is no autocorrelation, so that the model of ROE is feasible to predict the dependent variable with independent variables. In contrast, table 7 shows the P
value of ROA is less than significance level (0.006<0.05). It means that there is autocorrelation, so that the model of ROA is not feasible to predict the dependent variable with independent variables. To overcome the problem, the researcher transformed the data into natural logarithm. P value of ROA after
transformation is greater than
significance level (0.149≥0.05). It means that there is no autocorrelation, so
that the model of ROA after
transformation is feasible to predict the dependent variable with independent variables. predict the dependent variable with independent variables.
c. Multicollinearity Test
VIF of ROE and ROA are greater than 10 for each independent variable. For the model of ROE, VIF value of CAR, NPL, and BI Rate are 1.125, 1.045, and 1.146 respectively. For the model of ROA after transformation, VIF value of CAR, NPL, and BI Rate are 1.112, 1.028, and 1.120 respectively. It means that there is no multicollinearity, so that the model of ROE and ROA are feasible to predict the dependent variable with independent variables.
d. Heteroscedasticity Test
P value of ROE and ROA are greater means that there is no heteroscedasticity, so that the model of ROE and ROA are feasible to predict the dependent variable with independent variables.
3. Inferential Statistical Analysis
a. Multiple Linier Regression Model
Jurnal Administrasi Bisnis (JAB)|Vol. 46 No.1 Mei 2017| administrasibisnis.studentjournal.ub.ac.id
14
b. F Test
Table 3 ANOVA Test of ROE
Model 1 F Sig. F Table Result
1Regression 18.319 .000b 2.859 H1 is Accepted
Source: Data was Processed, 2017
F is greater than Ftable (18.319>2.859) with P value is less than significance level (0.000<0.05). Based on these two comparisons, H0 is rejected and H1 is accepted. It means that CAR, NPL, and BI Rate have significant effect on ROE simultaneously.
Table 4 ANOVA Test of ROA
Source: Data was Processed, 2017
F is greater than Ftable (3.687>2.859) and P value is less than significance level (0.021<0.05). Based on these two comparisons, H0 is rejected and H2 is accepted. It means that CAR, NPL, and BI Rate have significant effect on ROA simultaneously.
c. T Test
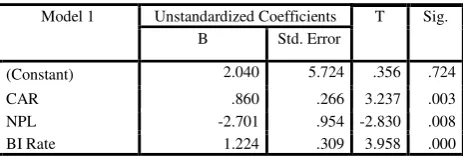
Table 5 Regression Coefficient of ROE
Source: Data was Processed, 2017
T of CAR is greater than t table (3.237>2.028) and P value is less than significance level (0.003<0.05). Based on these two comparisons, H0 is rejected and H3 is accepted. It means that CAR has significant positive effect on ROE partially.
T of NPL is greater than t table (-2.830>2.028) and P value is less than significance level (0.040<0.05). Based on these two comparisons, H0 is rejected and H4 is accepted. It means that NPL has significant negative effect on ROE partially.
T of BI Rate is greater than t table (3.958>2.028) and P value is less than significance level (0.000<0.05). Based on these two comparisons, H0 is rejected and H5
is accepted. It means that BI Rate has significant positive effect on ROE partially.
Table 6 Regression Coefficient of ROA
Source: Data was Processed, 2017
T of CAR is greater than t table (2.808>2.028) and P value is less than significance level (0.008<0.05). Based on these two comparisons, H0 is rejected and H6 is accepted. It means that CAR has significant positive effect on ROA partially.
T of NPL is less than t table (-1.542<2.028) and P value is greater than significance level (0.132>0.05). Based on these two comparisons, H0 is accepted and H7 is rejected. It means that NPL has insignificant negative effect on ROA partially.
T of BI Rate is less than t table (-0.914<2.028) and P value is greater than significance level (0.367>0.05). Based on these two comparisons, H0 is accepted and H8 is rejected. It means that BI Rate has insignificant negative effect on ROA partially.
d. Determination Coefficient Analysis
Table 7 Model Summary of ROE
Source: Data was Processed, 2017
The value of Adjusted R Square is 0.571. It means that CAR, NPL, and BI Rate could explain their effects on ROE 57%. Other 43% may be affected or explained by other variables which are not taken in this research model, such as Loan to Deposit Ratio (LDR), Gross Domestic Product (GDP), and operational risk variables.
Model 2 F Sig. F Table Result
1Regression 3.687 .021b 2.859 H2 is Accepted
Model R R Square Adjusted R
Square
Std. Error of the Estimate
1 .777a .604 .571 3.03586
Model 1 Unstandardized Coefficients T Sig.
B Std. Error
(Constant) 2.040 5.724 .356 .724
CAR .860 .266 3.237 .003
NPL -2.701 .954 -2.830 .008
BI Rate 1.224 .309 3.958 .000
Model 2 Unstandardized Coefficients t Sig.
B Std. Error
(Constant) -1.294 .888 -1.457 .154
CAR .869 .309 2.808 .008
NPL -.274 .178 -1.542 .973
Jurnal Administrasi Bisnis (JAB)|Vol. 46 No.1 Mei 2017| administrasibisnis.studentjournal.ub.ac.id
15
Table 8 Model Summary of ROA
Source: Data was Processed, 2017
The value of Adjusted R Square is 0.171. It means that CAR, NPL, and BI Rate could explain their effects on ROA 17%. Other 83% may be affected or explained by other variables which are not taken in this research model, such as Loan to Deposit Ratio (LDR), Gross Domestic Product (GDP), and operational risk variables.
Interpretation of Research Result
1. The Simultaneous Effect of Capital Adequacy Ratio, Non-Performing Loan Ratio, and BI Rate on Return on Equity Based on F test and P value, CAR, NPL, and BI Rate had significant effect on ROE simultaneously.
Greuning and Bratanovic (2009:101-102) has stated that banks are subjected to financial, operational, and environmental
risks. The bank’s capacity to manage those risks can impact on its income and earnings. This research result supported the basic
theory of Greuning and Bratanovic
(2009:101-102).
2. The Simultaneous Effect of Capital Adequacy Ratio, Non-Performing Loan Ratio, and BI Rate on Return on Asset
Based on F test and P value on Table 15 page 76, CAR, NPL, and BI Rate
had significant effect on ROA
simultaneously.
Greuning and Bratanovic
(2009:101-102) has stated that banks are subjected to financial, operational, and
environmental risks. The bank’s capacity to manage those risks can impact on its income and earnings. This research result supported the basic theory of Greuning and Bratanovic (2009:101-102).
3. The Partial Effect of Capital Adequacy Ratio on Return on Equity
Based on T test and P value, CAR had significant positive effect on ROE partially. Latumaerissa, (2014:47) has explained that effective capital management or the ability of bank to maintain its capital adequacy can increase the profitability of
bank and costumer’s security. This research
result supported the theory of Latumaerissa (2014:47). This research result also supported
the research result of Saputri and Oetomo (2016) which showed that CAR had significant positive effect on ROE.
4. The Partial Effect of Non-Performing Loan Ratio on Return on Equity
Based on T test and P value, NPL had significant negative effect on ROE partially. Latumaerissa, (2014:161-164) has stated that the higher credit volume of the bank will increase probability of its bank to create profit or earnings, but, every bank is often faced with non-performing loan. Non-performing loan could be caused by the weaknesses of bank in considering its
costumer’s credit or caused by the worsening
of economic condition. High non-performing loan will cause high cost of capital that is indicated by the operational cost of its bank, furthermore the high cost of capital will impact on the net profit of the bank. This research result supported the basic theory of Latumaerissa, (2014:161-164). This research result also supported the research result of Gizaw et al. (2014), Badan and Lestari (2015), and Saputri and Oetomo (2016) which showed that NPL had significant negative effect on ROE.
5. The Partial Effect of BI Rate on Return on Equity
Based on T test and P value, BI Rate had significant positive effect on ROE partially. The increasing of BI Rate can decrease the demand of credit, but if the credit expansion is not implemented, bank will bear the interest savings. The increasing
of BI Rate will impact on bank’s loss if it
could not be managed properly (Wijaya, 2010:111). This research result did not support the theory of Wijaya (2010:111). This research result also did not support to the research result of Zaman et al. (2014) which showed that Interest Rate had significant negative effect on ROE. The finding about the significant positive effect of BI Rate on ROE could be caused by the ability of Bank BTN to manage the increase of BI Rate by maximizing its equity capital as funding source, increase the collectability, and be careful in distributing credit for costumers, also conduct efficiency, hence, increasing of BI Rate could increase its ROE. This research result supported the research result of Badan and Lestari (2015) which indicated that Interest Rate had significant positive effect on ROE.
Model R R Square Adjusted R
Square
Std. Error of the Estimate
Jurnal Administrasi Bisnis (JAB)|Vol. 46 No.1 Mei 2017| administrasibisnis.studentjournal.ub.ac.id
16
6. The Partial Effect of Capital Adequacy Ratio on Return on Asset
Based on T test and P value, CAR had significant positive effect on ROA partially. Latumaerissa (2014:47) has explained that effective capital management or the ability of bank to maintain its capital adequacy can increase the profitability of
bank and costumer’s security. This research
result supported the theory of Latumaerissa (2014:47). This research result also supported the research result of Putri (2013) which stated that CAR had significant positive effect on ROA.
7. The Partial Effect of Non-Performing Loan Ratio on Return on Asset
Based on T test and P value, NPL had insignificant negative effect on ROA partially. (Latumaerissa, 2014:161-164) has stated that the higher credit volume of the bank will increase probability of its bank to create profit or earnings. However, every bank is often faced with non-performing loan. Non-performing loan could be caused by the weaknesses of bank in considering its
costumer’s credit or caused by the worsening of economic condition. High non-performing loan will cause high cost of capital that is indicated by the operational cost of its bank, furthermore the high cost of capital will impact on the net profit of the bank. This research result did not support the basic theory of Latumaerissa (2014:161-164). This research result also did not support to the research result of Putri (2010) and Gizaw, Kabede, and Selvaraj (2014) which showed that NPL had significant negative effect on ROA. This research result could be happened because Bank BTN not only allocated its liabilities capital for credit distribution, but also for saving in other bank which will generate other income, so that the loss which was caused by NPL could covered by income from that source, hence, NPL did not have significant negative effect on ROA. This research result supported the research result of Badan and Lestari (2015) and Maria (2015) which stated that NPL had insignificant negative effect on ROA.
8. The Partial Effect of BI Rate on Return on Asset
Based on T test and P value, BI Rate had insignificant negative effect on ROA partially. The increasing of BI Rate can decrease the demand of credit, but if the
credit expansion is not implemented, bank will bear the interest savings. The increasing
of BI Rate will impact on bank’s loss if it
could not be managed properly (Wijaya, 2010:111). This research result did not support the theory of Wijaya (2010:111). This research result also did not support the research result of Zaman et al. (2014) which showed that interest rate had significant negative effect on ROA. In this research, BI Rate had significant positive effect on ROE, but did not have significant effect on ROA. The relationship direction of BI Rate on ROA which was negative also different with direction relationship of BI Rate on ROE which was positive. The researcher guesses that a lack of the significant effect of BI Rate on ROA and the different relationship direction could be caused by the liabilities which are a part of ROA. Liabilities capital of Bank BTN is higher than its equity capital. Increasing of BI Rate could decrease its ROA, because increasing of BI Rate meant that Bank BTN also should pay its liabilities with higher interest rate. The effect of BI Rate on ROA which was insignificant could happen because the interest capital of Bank BTN is not only liabilities but also equity. When the BI Rate increased, Bank BTN prefer to utilize its equity capital as funding source, increase the collectability, and be careful in distributing credit for costumers, also conduct efficiency, but it was not optimal because Bank BTN have a high Loan to Deposit Ratio (LDR) which is above 100%. High LDR means that the amount of loan distributed is higher than deposits received, hence, the increasing of BI Rate have insignificant negative effect on ROA. The result supported the research result of Alim (2014) which showed that BI Rate had insignificant negative effect on ROA.
CONCLUSION AND RECOMMENDATION Conclusion
1. Based on F test and P value, CAR, NPL, and BI Rate had significant effect on ROE simultaneously.
2. Based on F test and P value, CAR, NPL, and BI Rate had significant effect on ROA simultaneously.
3. Based on t test and P value, CAR had significant positive effect on ROE partially. 4. Based on t test and P-value, NPL had
Jurnal Administrasi Bisnis (JAB)|Vol. 46 No.1 Mei 2017| administrasibisnis.studentjournal.ub.ac.id
17
5. Based on t test and P value, BI Rate had significant positive effect on ROE partially. 6. Based on t test and P value, CAR had
significant positive effect on ROA partially. 7. Based on t test and P value, NPL had
insignificant negative effect on ROA partially.
8. Based on t test and P value, BI Rate had insignificant negative effect on ROA partially.
Recommendation
1. For Bank Tabungan Negara (Persero) Tbk a. Bank BTN should increase its capital
adequacy and conduct proper risk management by increasing CAR.
b. Bank BTN should decrease its credit risk by decreasing NPL.
c. Bank BTN should anticipate
macroeconomic policy as like the determination of BI Rate.
2. For Further Researcher
a. The researcher recommends the further researcher to use other financial risk variables such as Loan to Deposit Ratio (LDR) that is indicated the liquidity risk, currency risk, and other environmental risk variables such as Inflation and Gross Domestic Product (GDP).
b. The researcher recommends the further researcher to conduct research about the effect of operational risk on earnings by using qualitative approach.
REFERENCES
Alim, S. 2014. Analisis Pengaruh Inflasi dan BI Rate Terhadap Return on Assets (ROA) Bank Syariah di Indonesia. Jurnal Ekonomi Modernisasi Vol. 10, No. 3: 201-220,
accessed on April 18, 2017 from
http://ejournal.
unikama.ac.id/index.php/JEKO/article/view/ 785.
Badan, A.Y.A. and Lestari, S.L. 2015. Faktor-faktor yang Mempengaruhi Profitabilitas Bank yang Terdaftar di Bursa Efek Indonesia. Trijurnal, accessed on April 19, 2017 from http://www.trijurnal.lemlit. trisakti.ac.id/index.php/semnas/article/dow nl oad/197/196.
Bank Indonesia. 2011. Surat Edaran Nomor 13/24/DPNP tentang Penilain Tingkat Kesehata Bank Umum, accessed on
December 22, 2016 from
http://www.bi.go.
id/id/peraturan/perbankan/Pages/SE%20N o.13_24_DPNP_2011.aspx.
____________. 2016. BI Rate, accessed on
December 22, 2016 from
http://www.bi.go.id/
en/moneter/bi-rate/data/ Default.aspx.
Bank Tabungan Negara. 2016. Laporan Triwulan, accessed on December 16, 2016 from http://www.btn.co.id/id/content/Hubungan-Investor/Laporan-Keuangan/Laporan Triwulanan?page=4.
Blanche, M.T., K. Durrheim., & D. Painter. 2006.
Research in Practice: Applied Methods for the Social Sciences. 2nd Ed. South Africa: University of Cape Town Press (Pty) Ltd., accessed on December 17, 2016 from https://books.google.co.id/.
Creswell, J.W. 2014. Research Design: Qualitative, Quantitative, and Mixed Methods Approaches. 4th Ed. United States of America: Sage Publication, Inc., accessed
on December 12, 2016 from
https://books.google.co.id/.
Gizaw, M., M. Kebede., & S. Selvaraj. 2014. The Impact of Credit Risk on Profitability Performance of Commercial Banks in Ethiopia. African Journal of Business Management Vol. 9, No. 2: 59-66, accessed on December 27, 2016 from http://www. academicjournals.org/journal/AJBM
/article-full-text-pdf/4A412A250102
Greuning, H.V. & S.B. Bratanovic. 2009.
Analyzing Banking Risk: A Framework for Assessing Corporate Governance and Risk Management. 3rd Ed. Washington, D.C.: The World Bank., accessed on December 17, 2016 from https://gen.lib.rus.ec/.
Gupta, A. 2014. Risk Management and
Simulation. New York: Taylor & Francis Group., accessed on December 26, 2016 from https://books.google.co.id/.
International Accounting Standards Board. 2006.
Conceptual Framework: Asset Definition.
IASB: London, accessed December 21, 2016 from
http://www.ifrs.org/Current-Projects/
IASB-Projects/Conceptual-Framework/Other
-Public-Meetings-Observer-Notes/ Documents/
WSSAGENDAPAPER1A.pdf.
Jurnal Administrasi Bisnis (JAB)|Vol. 46 No.1 Mei 2017| administrasibisnis.studentjournal.ub.ac.id
18
hukum
online.com/pusatdata/downloadfile/lt4cc e89fb14e43/parent/334.
Koch, T.W. & S.S. MacDonald. 2015. Bank Management. Boston: Cengage Learning., accessed on December 17, 2016 from https://gen.lib.rus.ec/.
Latumaerissa, J.R. 2014. Manajemen Bank Umum. Jakarta: Mitra Wacana Media.
Liembono, R.H. 2014. Analisis Fundamental. Jakarta: BEI5000.
Mahmoeddin, A. 2002. Melacak Kredit
Bermasalah. Jakarta: Sinar Harapan.
Maria, A. 2015. Pengaruh CAR, BOPO, NIM, NPL, dan LDR Terhadap ROA: Studi Kasus pada 10 Bank Terbaik di Indonesia Periode 2007-2011, accessed on April 18, 2017 from http:// repository.ubaya.ac.id/24357/. Marta, M.F. 2016. Kinerja Bank BUMN: Laba
Stagnan, Kredit Bermasalah Melonjak.
Kompas, accessed on December 22, 2016
from http://bisniskeuangan.kompas.
com/read/2016/
05/09/072514726/Kinerja.Bank.BUMN.Lab a.Stagnan.Kredit.Bermasalah.Melonjak.
Ostrom, L.T. and C.A. Wilhelmsen. 2012. Risk Assessment: Tools, Techniques, and Their Applications. New Jersey: A John Wiley & Sons, Inc, Publications., accessed on January 1, 2016 from https://books.google. co.id/.
Putri, F.S. 2013. Pengaruh Resiko Kredit dan
Tingkat Kecukupan Modal Terhadap
Tingkat Profitabilitas pada Perusahaan Perbankan yang Terdaftar di Bursa Efek Indonesia. E-journal of The State of Padang University. 1-19, accessed on
December 30, 2016 from
http://ejournal.unp. ac.id/students/index.php/ akt/article/viewFile/73/6.
Saputri, S.F.H. & Oetomo, H.W. 2016. Pengaruh CAR, BOPO, NPL, dan FDR Terhadap ROE pada Bank Devisa. E-journal of STIESIA Surabaya Vol. 5, No. 5: 1-19,
accessed on April 18, 2017 from
https://ejournal.stiesia.
ac.id/jirm/user/setLocale/id_ID?source=%2 Fjirm%2Farticle%2Fview%2F1553%2F0.
Siamat, D. 2005. Manajemen Lembaga
Keuangan: Kebijakan Moneter dan Perbankan. 5th Ed. Jakarta: Lembaga
Penerbit Fakultas Ekonomi Universitas Indonesia.
Subramanyam, K.R. & J.J. Wild. 2009.
Financial Statement Analysis. 10th Ed. Singapore: The McGraw-Hill Companies Inc.
Wijaya, K. 2010. Analisis Kebijakan Perbankan Nasional. Jakarta: PT Elex Media Komputindo.
Zaman, R., M. Arslan., M. Sohail, & D.R.K. Malik. 2014. The Impact of Monetary Policy on Financial Performance: Evidence from Banking Sector of Pakistan. Journal of Basic and Applied Scientific Research 4, No. 8, pp. 119-124, accessed on December
29, 2016 from