Modelling the long-term effect of irrigation with gypsiferous water on
soil and water resources
J.G. Annandale
a,∗, N.Z. Jovanovic
a, N. Benadè
b, P.D. Tanner
caDepartment of Plant Production and Soil Science, University of Pretoria, Hatfield 0002, South Africa bNB Systems, P.B. 15102, Sinoville 0129, South Africa
cAmcoal Environmental Services, P.B. X9, Leraatsfontein 1038, South Africa
Received 17 August 1998; received in revised form 13 January 1999; accepted 1 June 1999
Abstract
The use of gypsiferous mine water for irrigation of agricultural crops is a promising technology that could solve problems related to both shortage of irrigation water and disposal of effluent mine drainage. The long-term effect of irrigation with lime-treated acid mine drainage on soil properties and catchment salt load was investigated. The soil water–salt balance-crop growth model (SWB) and the CLIMGEN weather data generator were used to simulate 30 years of irrigation with gypsiferous mine water for different irrigation management scenarios, followed by 20 years of dry land summer cropping, to determine if the problem of salt disposal was merely being postponed. Generated weather input data were for Bethal (South Africa), soil input data for a Plinthic Ferralsol (FAO-UNESCO) and crop input data for a rotation of pearl millet (Pennisetum glaucumcv. SA Standard) and oats (Avena sativa L. cv. Overberg). The soil appeared to act as an effective salt sink, with large quantities of calcium sulphate (340–404 Mg ha−1) being precipitated in 30 years, and with negligible amounts of remobilization thereafter. Dissolved salts in the soil solution increased during winter when rainfall is negligible. The highest concentrations occurred deeper in the profile, which is desirable because rooting is less dense there and plant growth is thus less affected. Due to large amounts of gypsum precipitation near the surface, the ions in solution were mainly Mg2+and SO
42−. Simulated root weighed, saturation electrical conductivities indicated that summer cropping should present no problems, but for certain winter crops a leaching fraction should be applied to obtain maximum yields. Drainage water quality was variable, depending heavily on rainfall. Peak salt levels were around 9.6 g L−1. Depending on irrigation strategy, between 418 and 636 Mg ha−1of salts was leached over 30 years. Once irrigation ceased, very little leaching occurred. Annual irrigation depended on rainfall, but averaged at about 1100 mm per annum. About 350 mm of percolation occurred, resulting in net utilization of around 750 mm annually. About 40% of the salts added through irrigation could be immobilized in the soil profile. It is concluded that year round, high frequency irrigation, with a leaching fraction in winter, should be an effective and economical means of utilizing large quantities of gypsiferous water without causing irreparable damage to soil resources. ©1999 Elsevier Science B.V. All rights reserved.
Keywords:Acid mine drainage; Gypsiferous water; Irrigation; Model studies; Soil salinity; Weather data generator
∗Corresponding author. Tel.: 420-3223; fax:
+27-12-420-4120
E-mail address:[email protected] (J.G. Annandale)
1. Introduction
The mining industry is one of the most important industries in South Africa, both from the points of
view of gross national product and job creation. Min-ing is spread over a wide region, includMin-ing important high-potential agricultural areas. In the mining of min-eral resources, pollution problems are created, with adverse effects on the already scarce water resources (66% of the country is classified as semi-arid to arid with low and variable rainfall). Add to this the steady increase in population, and the maintenance and ef-fective utilization of agricultural potential and water resources becomes of paramount importance (Depart-ment of Water Affairs and Forestry, 1997).
Most South African coal and gold deposits contain pyritic formations. When exposed to oxygen, water and the catalytic action of Thiobacillus ferrooxidans
bacteria, iron pyrite is oxidized to sulfuric acid and iron sulphate (Thompson, 1980). This results in large quantities of acid mine drainage (AMD) being formed. The extremely high acidity of this water, with pH typically ranging from 2 to 4.4 (Jovanovic et al., 1998), prohibits discharge into natural streams, as the envi-ronmental impact would be severe. This is not a lo-cal problem, but occurs worldwide where similar de-posits are found, including old underground workings (Pulles et al., 1995).
Current measures to prevent pollution of the envi-ronment were summarized by Pulles et al. (1996). In several mines, AMD is treated with hydrated lime, Ca(OH)2, in order to neutralize acidity. Most of the re-sulting CaSO4is precipitated in sedimentation basins, but the effluent water is saline (gypsiferous), with an electrical conductivity (EC) typically in the range from 130 to 290 mS m−1, due mainly to the pres-ence of Ca2+and SO
42−in solution (Jovanovic et al., 1998). If freely discharged into the natural environ-ment, lime-treated AMD and similar waters emanating from mines could cause salinization of soils, rivers, dams and catchment areas.
The utilization of mine waste water must be bal-anced with the conservation of soil and water re-sources in such a way that the rere-sources and associated ecosystems are not degraded to such an extent as to render them useless and unproductive. Lime-treated AMD has previously been used for dust alleviation on dirt roads and for irrigation of lawns. The possible utilization of this water for irrigation of agricultural crops shows some promise (Du Plessis, 1983a). Large amounts of waste water could possibly be utilized for irrigation of high potential soils. Moreover, filtering
saline water through the soil and thereby precipitat-ing gypsum in the profile, could limit environmental pollution. The high cost of AMD amelioration could also be offset to some extent by farming income.
The feasibility of using mine water for irrigation of agricultural crops was evaluated by Barnard et al. (1998), in a three-year field screening trial carried out at Landau Colliery Kromdraai Opencast Section (near Witbank, Mpumalanga Province, South Africa). For the purpose of lime-treated AMD utilization, they rec-ommended fast growing species that use a lot of wa-ter. They concluded that irrigation with lime-treated AMD should not present a soil salinity or crop pro-duction problem within a relatively short time period. The problem of saline water management, however, has both short- and long-term implications (Bresler et al., 1982). Long-term changes in soil chemical prop-erties can be measured, but the execution of long-term experiments monitoring slow environmental processes can be prohibitively expensive and it is not always possible to wait for the outcome of such experiments. Computer models, combined with a weather data gen-erator, are useful tools for predicting environmental consequences of management practices.
Several crop production–salt movement models have already been published (Maas and Hoffman, 1977; Bresler et al., 1982; Du Plessis, 1983b; Wa-genet, 1984; Campbell, 1985). Most of them, how-ever, are either crop specific or do not simulate the mechanism of daily crop water uptake. In this study, a simple dynamic soil water–salt balance-generic crop growth model, SWB (Annandale et al., 1996a), was used to assess the long-term impact of irrigation with gypsiferous mine water on soil and water resources for a location in South Africa. Long-term weather records were generated using the CLIMGEN weather data generator of G.S. Campbell (Washington State University), a modified version of WGEN (Richard-son and Wright, 1984).
cessation of irrigation using mine water; (5) Indica-tion of the influence of drainage water on catchment salt load; (6) The impact of variations in seasonal and annual rainfall on the soil and drainage water charac-teristics; and 7) Water and salt balance.
2. Materials and methods
2.1. Description of the model
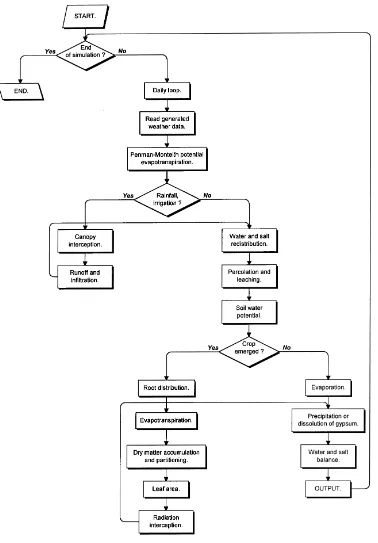
Soil water balance (SWB) is a mechanistic, multi-layer, daily time step, soil water–salt balance-generic crop growth model, developed from NEWSWB, a modified version of the model pub-lished by Campbell and Diaz (1988). A flow diagram for SWB is presented in Fig. 1.
A cascading soil water balance is used once canopy interception and surface runoff have been accounted for. Each soil layer is assumed to fill to field capacity and then pass on any remaining water to the layer below. Any water that passes beyond the bottom layer is assumed lost to deep percolation. Potential evap-otranspiration (PET) is calculated as a function of daily average air temperature, vapor pressure deficit, radiation and wind speed, adopting the internationally standardized FAO Penman–Monteith methodology (Smith et al., 1996). The two components of PET — potential evaporation and potential transpiration — are estimated from canopy cover. Actual transpiration is determined on a daily basis as the lesser of root wa-ter uptake or maximum loss rate. Total soil wawa-ter potential is used to determine the amount of water available for crop transpiration in each soil layer. The osmotic effect on crop growth is simulated by adding osmotic potential to the matric and gravitational soil water potentials. Osmotic potential is calculated as a function of ionic concentration (Campbell, 1985). The daily dry matter increment (DMi) is taken as the minimum of the water supply limited (Tanner and Sinclair, 1983) and radiation limited DMi (Monteith, 1977). A stress index, the ratio between actual and potential transpiration, is used as a limiting factor for canopy development.
Required input data are planting date, latitude, alti-tude, rainfall and irrigation water amounts and quality, as well as maximum and minimum daily temperature.
In the absence of measured data, SWB estimates solar radiation, vapor pressure and wind speed according to the FAO recommendations (Smith, 1992). In addi-tion, volumetric field capacity and permanent wilting point, initial volumetric soil water content and the con-tent of ionic species (Ca2+, Mg2+, Na+, K+, Cl−and
SO42−) are required for each soil layer. Since SWB is a generic crop growth model, the following crop specific parameters have to be experimentally deter-mined in order to accurately simulate the soil water balance: daily radiant transmission coefficient, vapor pressure deficit, corrected dry matter water ratio, radi-ation conversion efficiency, day degrees required for crop developmental stages, cardinal temperatures, dry matter partitioning parameters, specific leaf area and stress index. The SWB model includes a database of growth parameters for a wide range of crop and pas-ture species.
Chemical precipitation/dissolution of lime and gyp-sum is calculated on a daily time step per soil layer, using the model published by Robbins (1991). Crit-ical assumptions of the chemCrit-ical equilibrium model and the validation with lysimeter data are discussed in the same study. The model of Robbins (1991) solves chemical equilibrium by iteration. Within each itera-tion, activity coefficients and ion activities are calcu-lated for Ca2+, Mg2+, Na+, H+, SO
42−, HCO3−and CO32−
, and the solution phase is equilibrated with solid phase lime and gypsum. EC is calculated from individual ion concentrations (McNeal et al., 1970) for each soil layer. The SWB model ends the iteration procedure when the change in EC between the previ-ous and the following loop is<0.01 mS m−1.
The model of Robbins (1991) requires an input value for CO2partial pressure (pCO2) in soil air. The values of pCO2 can vary widely in cultivated soils, depending on soil physical properties, root depth and aeration. Its effect on soil chemistry is, however, very limited in the salinity range interesting for irrigation with mine water (Oster, 1990). A constantpCO2value of 0.3% (or kPa) is used in SWB. AtmosphericpCO2 is 0.03% (Reuss, 1991).
The SWB model calculates only concentrations of soluble ionic species and does not include the cation exchange procedure of Robbins (1991). It was assumed that Ca2+ would quickly saturate the soil
therefore not expected to significantly affect the parameters that determine crop water use and soil salinity in the long term. The introduction of the cation exchange subroutine would likely make the model more reliable for short-term simulations, but more inputs would then be required.
Weather data are generated using CLIMGEN, a two-component weather generator. The first compo-nent (CLIMPAR) determines statistical parameters required for long-term daily weather data generation, while the second component (CLIMGEN) generates weather data. CLIMGEN generates daily maximum (Tmax) and minimum air temperature (Tmin), as well as precipitation (P) from either historic daily weather data, if available, or from monthly averages. At least 20 years of rainfall and 10 years of historic tem-perature data are required in order to get a reliable simulation. The CLIMGEN weather data generator was assessed at South African sites by Clemence (1997), who showed the estimations to be quite satisfactory.
The SWB model is written in Delphi and runs in Windows 95. The Fortran code published by Robbins (1991) was translated and included in a user-friendly format in SWB. A copy of the model’s code and the model are available from the authors.
2.2. Input parameters for long-term predictions
Long-term simulations were carried out for a rota-tion of pearl millet (Pennisetum glaucumcv. SA Stan-dard) and oats (Avena sativa L. cv. Overberg) grown for forage, thereby providing high soil water consump-tion rates throughout the year. Crop parameters for pearl millet and oats were calibrated using data from the field trial carried out at Landau Colliery Krom-draai Opencast Section (Barnard et al., 1998). In that trial, optimal agronomic techniques for the area were implemented. The crops were sprinkle irrigated with lime-treated AMD and showed no signs of foliar in-jury. For the long-term simulations, SWB was modi-fied to simulate the harvesting of oats. This was done by reducing the calculated value of total dry mat-ter production (TDM) to 0.5 Mg ha−1, on days when TDM was equal to, or greater than, 3.5 Mg ha−1. SWB simulated the re-growth of the crop thereafter, until the planting of pearl millet.
Long-term simulations were carried out for an un-mined site, located in the area of the Kleinkopje open-cast coal mine (near Witbank). The soil is loamy sand (810 g kg−1sand, 50 g kg−1silt and 140 g kg−1clay), with a plinthic layer below 1.5 m. It is classified as Bainsvlei form–Redhill series according to the Soil Classification Working Group (1991), or as Plinthic Ferralsol (FAO-UNESCO, 1974). Soil physical and chemical properties reported by De Villiers (1987) were used as input in the model. Soil water content at field capacity and permanent wilting point were cal-culated as a function of soil texture, according to the equations recommended by Bennie et al. (1988).
The following irrigation water quality data were obtained from Amcoal (Landau Colliery) and used as model input: Ca2+= 0.013 mol L−1; SO42−= 0.021 mol L−1; and Mg2+= 0.008 mol L−1. This water emanates from old underground workings and needs to be disposed of in order to allow planned future opencast mining. The presence of other ions in the proposed irrigation water, including heavy metals, was neglected as their concentrations were very low. Rain water quality data reported by Bolt (1982) were used as model input.
Twenty years of historic weather data were collected for the meteorological station in Bethal, the nearest to the Kleinkopje mine with a reasonably long record of data, and used as input in the weather data genera-tor. It was assumed that similar weather conditions to those in Bethal would occur in the area surrounding the Kleinkopje mine. Fifty years of dailyTmax,Tmin andPwere generated by CLIMGEN in order to carry out the long-term crop growth and soil salinity simu-lations. Examples of generated weather data are pre-sented in Fig. 2 (monthly averageTmaxandTmin) and Fig. 3 (monthlyP). Realistic weather data was gener-ated by CLIMGEN compared to the typical weather conditions for the given site.
Fig. 2. Monthly average maximum and minimum air temperatures (TmaxandTmin) simulated with the CLIMGEN weather data
gen-erator for Bethal (South Africa).
Fig. 3. Monthly rainfall simulated with the CLIMGEN weather data generator for Bethal (South Africa).
of the soil water deficit (0.67 FC); and (3) irrigation amounts applying a 20% leaching fraction (20% LF). Irrigations were simulated for 30 years, after which another 20 years were simulated for dry land pearl millet grown during the summer rainy season. The purpose was to evaluate the drainage water quality af-ter the cessation of irrigation and to see whether sub-stantial remobilization of precipitated gypsum would occur.
3. Results and discussion
3.1. Quantities of gypsum immobilized in the soil profile over time
The SWB model precipitates or dissolves CaSO4, depending on solution concentration. This is affected
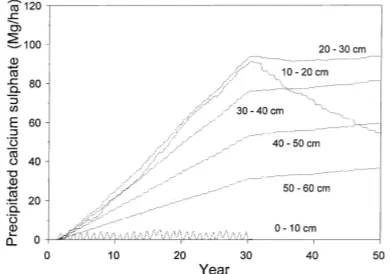
Fig. 4. Cumulative amounts of CaSO4 (Mg ha−1) precipitated at
different depths in the profile of loamy sand Plinthic Ferralsol for a pearl millet–oats rotation irrigated at field capacity for 30 years, followed by dry land cropping.
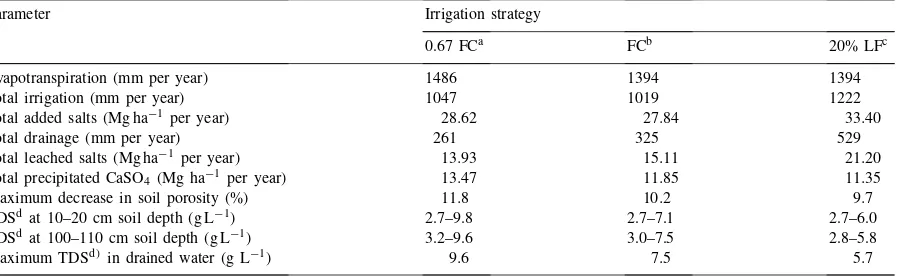
Table 1
Simulated values of water and salt balance parameters during 30 years of irrigation with mine water for three irrigation management strategies (Kleinkopje mine, Witbank, South Africa)
Parameter Irrigation strategy
0.67 FCa FCb 20% LFc
Evapotranspiration (mm per year) 1486 1394 1394
Total irrigation (mm per year) 1047 1019 1222
Total added salts (Mg ha−1 per year) 28.62 27.84 33.40
Total drainage (mm per year) 261 325 529
Total leached salts (Mg ha−1 per year) 13.93 15.11 21.20
Total precipitated CaSO4 (Mg ha−1 per year) 13.47 11.85 11.35
Maximum decrease in soil porosity (%) 11.8 10.2 9.7
TDSdat 10–20 cm soil depth (g L−1) 2.7–9.8 2.7–7.1 2.7–6.0
TDSdat 100–110 cm soil depth (g L−1) 3.2–9.6 3.0–7.5 2.8–5.8
Maximum TDSd) in drained water (g L−1) 9.6 7.5 5.7
aIrrigation amounts replacing 2/3 of the soil water deficit. bIrrigation amounts refilling the soil profile to field capacity. cIrrigation amounts applying a 20% leaching fraction. dTotal dissolved salts.
3.2. Influence of salt deposition on soil porosity
The present form of SWB is unable to predict fertil-ity changes as N, P, K and micronutrients are not sim-ulated. This is not seen as a serious disadvantage for practical applications, as it is relatively easy to mon-itor in the field and correct any nutrient deficiencies that may arise over time due to Ca2+
dominating the exchange complex. Soil physical effects, however, are of greater concern, as these may not always be easy to remedy. Low concentrations of Na+ in AMD and
the saline conditions should ensure a good structure, so infiltration is expected to be unimpeded by surface crusting. The only possible concern is that of CaSO4 precipitation clogging soil pores. This could reduce aeration and hydraulic conductivity. Pore clogging can be simulated by calculating the volume that the pre-cipitated CaSO4will occupy. The volume of CaSO4 (V) clogging soil pores in each layer was calculated as follows:
V= Mass CaSO4
Density CaSO4 (1) The density of CaSO4 was assumed to be 2.3 Mg m−3. The density of soil solid particles was assumed to be 2.65 Mg m−3 and volumetric soil porosity (Ps) was calculated as follows:
Ps =1− ρb
2.65
(2)
whereρbis the bulk density of the soil (Mg m−3). The decrease in soil porosity (Psd) per unit area was then calculated:
Psd= V Ps dz
(3)
where dz represents the depth of soil layer in meters. Model predictions indicated that a reduction of pore volume up to 11.8% could occur in the top soil lay-ers after 30 years of irrigation with gypsiferous wa-ter (Table 1). Precipitation of CaSO4was predicted to occur mostly in the surface layers where cultivation should be an effective remedy to pore clogging. More accurate simulations would result from a model based on Richard’s equation/Darcy’s law as one could then bring in the effect of pore clogging on hydraulic con-ductivity.
3.3. Salt concentrations in the soil profile over time
Fig. 5. Simulated total dissolved salts (TDS) in drainage water for Plinthic Ferralsol and pearl millet–oats rotation irrigated at field capacity for 30 years, followed by dry land cropping.
determined value of a saturated CaSO4solution (Bolt and Bruggenwert, 1978). Higher TDS values were pre-dicted to occur at depths below the root system where salts are flushed by irrigation water and rainfall. Lower and more stable TDS values were generally calculated when applying a leaching fraction (Table 1).
3.4. Expected percolate quality during and after irrigation with mine water
The model keeps track of the amount and quality of water percolating below the rooting depth (1.1 m). Drainage water quality was highly dependent on rain-fall and salt dynamics in the soil profile. The irriga-tion strategy followed had a noticeable effect, with the deficit irrigation resulting in a more concentrated per-colate (Table 1). Total dissolved salts in drained wa-ter peaked at around 9.6 g L−1for the deficit or 0.67 FC strategy, equivalent to a solution electrical conduc-tivity of about 1300 mS m−1(US Salinity Laboratory Staff, 1954). It was calculated that TDS in percolating water would have a decreasing trend after the cessa-tion of irrigacessa-tion and in most years no leaching would occur (Fig. 5).
3.5. Effect of drainage water on catchment salt load
The total mass of salts leached can be determined from the quality and quantity of the leachate integrated over the irrigated area. In Table 1, salts leached dur-ing the 30-year simulation are presented for the three irrigation strategies. An average of between 13.93 and
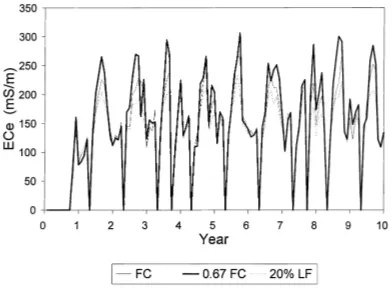
Fig. 6. Simulated root weighted soil solution electrical conductivity at saturation (ECe) for Plinthic Ferralsol, pearl millet–oats rotation
and three irrigation management strategies (FC: field capacity, LF: leaching fraction).
21.20 Mg salts per hectare per year, mostly MgSO4, can be expected to be leached over 30 years, depend-ing on water management. The deficit irrigation strat-egy resulted in the least leaching, and the leaching fraction strategy, the most.
3.6. Impact of annual and seasonal variations in rainfall on soil and drainage water quality
Fig. 7. Predicted salt leaching (Mg ha−1 per month) for Plinthic
Ferralsol and pearl millet–oats rotation irrigated at field capacity.
As a result of the higher soil solution concentrations during the dry period of the year, CaSO4is expected to precipitate mostly in winter. During the rainy sea-son, conditions for limited dissolution of CaSO4 will materialize. The critical period of the year from the point of view of salt leaching is summer (Fig. 7).
3.7. Water and salt balance
Simulations with SWB gave valuable estimates of the volume of water that could be used and mass of salts that could be disposed of, by adopting different management practices. This can therefore assist the planning of the required area to be irrigated, should this be deemed to be a feasible option for utilizing such water. Considerable volumes of gypsiferous wa-ter could be used by the cropping system simulated (Table 1). It is interesting to note that the deficit irriga-tion strategy requires approximately the same amount of irrigation water as the FC strategy. This is occurring because of the greater direct evaporation component of the deficit irrigation strategy, caused by a higher fre-quency of irrigation. Average crop evapotranspiration is 1400 mm per annum. Annual irrigation depends on rainfall, but averages out at about 1100 mm per annum, or 11 000 m3ha−1. In practice, this may be slightly less if logistical problems are encountered with removing an old crop and planting a new one timeously. On av-erage, about 350 mm of percolation occurs resulting in a net utilization of around 750 mm annually.
Table 1 reports the predicted total amounts of salts added through irrigation, precipitated in the form of
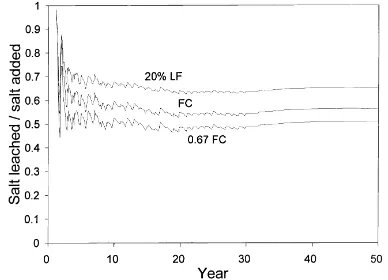
Fig. 8. Predicted salt leached/salt added ratio for Plinthic Fer-ralsol, pearl millet–oats rotation and three irrigation management strategies (FC: field capacity, LF: leaching fraction).
CaSO4and leached out of the soil profile. About 40% of the salts added through irrigation water could be immobilized in the soil profile. The greatest amount of salts added and leached was predicted for the strat-egy applying a leaching fraction (20% LF), whilst the largest amount of precipitated CaSO4was for the deficit strategy (0.67 FC). Salts intercepted by crop canopies and the salt mass dissolved in the soil solu-tion were calculated to be negligible components of the salt balance over the long term. The 0.67 FC deficit irrigation strategy resulted in the lowest cumulative salt leached/salt added ratio (Fig. 8). A high frequency irrigation strategy may, therefore, be recommended for the purpose of using lime-treated AMD for irrigation of agricultural crops. Similar results have been ob-tained for simulations with a mine rehabilitated soil profile and lucerne-fescue perennial pasture (Annan-dale et al., 1996b).
4. Summary and conclusions
The water balance–soil salinity model presented in this work, was specifically developed to solve prob-lems concerning the utilization of lime-treated acid mine drainage. It proved to be a useful tool for pre-dicting the outcome of various irrigation management scenarios.
problem of salt disposal was merely being postponed. According to the long-term simulations for a pearl millet–oats rotation on a sandy soil, substantial vol-umes of water can be used, and masses of salt dis-posed of, through irrigation. This can be best achieved through high frequency irrigation of crops year round. It is important to have as large a transpiring canopy as possible at all times. The soil appears to act as an effective salt sink, with large quantities of calcium sulphate (340–404 Mg ha−1) being precipitated over 30 years and with negligible amounts of remobiliza-tion thereafter. Possible pore clogging with precipi-tated gypsum is not seen as a serious problem as it is expected to occur in the top soil layers, where the soil solution tends to concentrate due to crop water uptake. The accompanying cultivation should open up the soil structure thereby alleviating the problem. Dis-solved salts in the soil solution are expected to increase during winter when rainfall is negligible. The highest concentrations occurred deeper in the profile, which is desirable, because rooting is less dense there and therefore plant growth is less affected. Due to large amounts of gypsum precipitation near the surface, the ions in solution were mainly Mg2+and SO
42−. Sim-ulated root weighted ECeindicated that summer crop-ping should present no problems, but for certain winter crops a leaching fraction should be applied to attain maximum yields. Drainage water quality was variable, depending heavily on rainfall. Peak salt levels were around 9.6 g L−1, equivalent to a solution electrical conductivity of about 1300 mS m−1. Between 418 and 636 Mg ha−1of salts, mainly MgSO
4, were predicted to be leached over 30 years. Once irrigation ceased, very little leaching occurred. As far as seasonal varia-tions are concerned, most gypsum precipitated in win-ter and most leaching occurred in summer. It is con-cluded that year round, high frequency irrigation, with a leaching fraction in winter, should be an effective and economical means of disposing of large quantities of salt and water without causing irreparable damage to soil resources.
The SWB model should give a good first approx-imation of the movement of water in well-drained, fairly uniform profiles. One should, however, be aware of the limitations of such soil water balance mod-els. Textural discontinuities and impermeable layers have marked effects on water movement and this can only be reasonably described by a finite-difference
model, which moves water according to Darcy’s law (i.e., using water potential and hydraulic conductivity). Another disadvantage of the cascading model is that upward flow of salts and water is not simulated. This could be important especially if a high, or perched, water table is present.
The model could be further developed by introduc-ing a subroutine quantifyintroduc-ing aluminum hydroxide in-teractions in the soil solution. In addition, the simula-tion of root water uptake under saline condisimula-tions could be improved by accounting for decreased root per-meability (O’Leary, 1970; Majeed et al., 1994; Ferrer and Stockle, 1996), or local osmotic potentials at the root–soil interface (Stirzaker and Passioura, 1996).
Acknowledgements
The authors wish to acknowledge the Water Re-search Commission (Pretoria, South Africa) and the Chamber of Mines (Johannesburg, South Africa) for funding.
References
Annandale, J.G., Benadè, N., van der Westhuizen, A.J., Campbell, G.S., 1996a. The SWB (Soil Water Balance) irrigation scheduling model. In: Proc. Int. Conf. on Evapotranspiration and Irrigation Scheduling, San Antonio, TX, USA, pp. 944–949. Annandale, J.G., Jovanovic, N.Z., Benadè, N., 1996b. Modelling the long-term effect of irrigation with gypsiferous water on soil and water resources. Rep. Coal Division of Anglo American Corporation of South Africa Ltd., 20 pp.
Barnard, R.O., Rethman, N.F.G., Annandale, J.G., Mentz, W., Jovanovic, N.Z., 1998. The screening of crop, pasture and wetland species for tolerance of polluted water originating in coal mines, Water Res. Comm. Rep. No. 582/1/98, Pretoria, South Africa.
Bennie, A.T.P., Coetzee, M.J., van Antwerpen, R., van Rensburg, L.D., Du T. Burger, R., 1988. ’n Waterbalansmodel vir Besproeiing Gebaseer op Profielwatervoorsieningstempo en Gewaswaterbehoeftes. Water Res. Comm. Rep. No. 144/1/88, Pretoria, South Africa.
Bolt, G.H., 1982. Soil Chemistry. B. Physico-Chemical Models. Elsevier, New York, 527 pp.
Bolt, G.H., Bruggenwert, M.G.M., 1978. Soil Chemistry. A. Basic Elements. Elsevier, New York, 281 pp.
Bresler, E., McNeal, B.L., Carter, D.L., 1982. Saline and Sodic Soils. Springer, New York, 236 pp.
Campbell, G.S., Diaz, R., 1988. Simplified soil-water balance models to predict crop transpiration. In: Bidinger, F.R., Johansen, C. (Eds.), Drought Research Priorities for the Dryland Tropics. ICRISAT, India, pp. 15–26.
Clemence, B.S.E., 1997. A brief assessment of a weather data generator (CLIMGEN) at South African sites. Water SA 23, 271–274.
Department of Water Affairs and Forestry, 1997. White paper on a national water policy for South Africa. Dept. of Water Affairs and Forestry, Pretoria, South Africa, April 1997, 37 pp. De Villiers, J.M., 1987. Soil Inventory and Land Capability
Assessment of ‘Landau Replacement’. Rep. Coal Division of Anglo American Corporation of South Africa Ltd., 16 pp. Du Plessis, H.M., 1983a. Using lime treated acid mine water for
irrigation. Water Sci. Technol. 15, 145–154.
Du Plessis, H.M., 1983b. An evaluation of a mathematical model that predicts crop yield depression associated with soil salinity. In: Proc. 10th Nat. Cong. Soil Sci. Soc. South Africa, East London, South Africa, pp. 49–53.
FAO-UNESCO, 1974. Soil map of the world, vol. 1 legend. UNESCO, Paris.
Ferrer, F., Stockle, C.O., 1996. A model for assessing crop response and water management in saline conditions. In: Proc. ICID/FAO Workshop on Irrigation Scheduling. Rome, Italy, 12–13 September, 1995, pp. 167–176.
Jovanovic, N.Z., Barnard, R.O., Rethman, N.F.G., Annandale, J.G., 1998. Crops can be irrigated with lime-treated acid mine drainage. Water SA 24, 113–122.
Maas, E.V., 1986. Salt tolerance in plants. Appl. Agric. Res. 1, 12–26.
Maas, E.V., Hoffman, M., 1977. Crop salt tolerance — current assessment. J. Irrig. Drain. Div. 103, 115–134.
Majeed, A., Stockle, C.O., King, L.G., 1994. Computer model for managing saline water for irrigation and crop growth: preliminary testing with lysimeter data. Agric. Water Manage. 26, 239–251.
McNeal, B.L., Oster, J.D., Hatcher, J.T., 1970. Calculation of electrical conductivity from solution composition data as an aid to in situ estimation of soil salinity. Soil Sci. 110, 405–414. Monteith, J.L., 1977. Climate and efficiency of crop production in
Britain. Philos. Trans. R. Soc. London, Ser. B 281, 277–294. O’Leary, J.W., 1970. The influence of ground water salinity on
plant growth. In: Mattox, R.B. (Ed.), Proc. Symp. Ground Water Salinity, 46th Annu. Meet. of the Southwestern and Rocky Mountain Div. of AAAS, Las Vegas, NV.
Oster, J.D., 1990. Steady-state root zone salt balance. In: Tanji, K.K. (Ed.), Agricultural Salinity Assessment and Management. ASCE, 345 East 47th St., New York, NY, pp. 469-481. Pulles, W., Howie, D., Otto, D., Easton, J., 1995. A Manual on
Mine Water Treatment and Management in South Africa. Water Res. Comm. Rep. No. TT 80/96, Pretoria, South Africa. Pulles, W., Heath, R., Howard, M., 1996. A Manual to Assess and
Manage the Impact of Gold Mining Operations on the Surface Water Environment. Water Res. Comm. Rep. No. TT 79/96, Pretoria, South Africa.
Reuss, J.O., 1991. The transfer of acidity from soils to surface waters. In: Ulrich, B., Sumner, M.E. (Eds.), Soil Acidity. Springer, New York, pp. 203–217.
Robbins, C.H., 1991. Solute transport and reactions in salt-affected soils. In: Modeling Plant and Soil Systems. Agronomy Monograph No. 31, ASA-CSSA-SSSA, 677 S. Segoe Rd., Madison, WI 53711, pp. 365–395.
Richardson, C.W., Wright, D.A., 1984. WGEN: A Model for Generating Daily Weather Variables. US Dept. of Agriculture, Agricultural Resources Services.
Smith, M., 1992. Expert consultation on revision of FAO methodologies for crop water requirements.FAO, Rome, Italy, 28–31 May, 1990, 60 pp.
Smith, M., Allen, R.G., Pereira, L.S., 1996. Revised FAO methodology for crop water requirements. In: Proc. Int. Conf. on Evapotranspiration and Irrigation Scheduling, San Antonio, Texas, pp. 133–140.
Soil Classification Working Group, 1991. Soil Classification. A Taxonomic System for South Africa. Dept. of Agricultural Development, Pretoria, South Africa, 150 pp.
Stirzaker, R.J., Passioura, J.B., 1996. The water relations of the root-soil interface. Plant. Cell Environ. 19, 201–208. Thompson, J., 1980. Acid mine waters in South Africa and their
amelioration. Water SA 6, 130–134.
Tanner, C.B., Sinclair, T.R., 1983. Efficient water use in crop production: research or re-search? In: Taylor, H.M., Jordan, W.R., Sinclair, T.R. (Eds.), Limitations to Efficient Water Use in Crop Production. ASA-CSSA-SSSA, 677 S. Segoe Rd., Madison, WI 53711, pp. 1–27.
US Salinity Laboratory Staff, 1954. Diagnosis and improvement of saline and alkali soils. US Dept. of Agriculture Handbook 60, 160 pp.