11 (2000) 393 – 411
Technological progress, structural change and
productivity growth: a comparative study
Jan Fagerberg *
Center for Technology,Inno6ation and Culture,Uni6ersity of Oslo,P.O. Box1108Blindern, 0317Oslo, Norway
Received 4 January 2000; received in revised form 14 July 2000; accepted 25 July 2000
Abstract
The relationship between the economic structure of a country and its productivity growth has received a lot of attention in recent decades. For instance, several theoretical models in this area now suggest that countries that specialize in technologically progressive industries will enjoy high rates of growth compared to other countries. This paper focuses on the impact of specialization and structural changes on productivity growth in manufacturing, using a sample of 39 countries and 24 industries between 1973 and 1990. The results show that while structural change on average has not been conducive to productivity growth, countries that have managed to increase their presence in the technologically most progres-sive industry of this period (electronics) have experienced higher productivity growth than other countries. © 2000 Elsevier Science B.V. All rights reserved.
Keywords:Technological progress; Structural change; Productivity growth
1. Introduction
The relationship between the economic structure of a country and its productivity growth has received a lot of attention in recent decades. For instance, several theoretical models in this area now suggest that countries specializing in technolog-ically progressive (‘high tech’) activities will enjoy high rates of productivity growth compared to other countries (see, e.g. Lucas, 1988, 1993; Grossman and Helpman, 1991). Countries specializing in ‘low-tech’ activities, on the other hand, should be
E-mail address:[email protected] (J. Fagerberg).
expected to have relatively slow productivity growth. In a globalized world, this may not imply slower growth in welfare in the latter as long as differences in productivity growth are fully reflected in prices. However, if producers of high-tech products are able to keep most of the rewards from faster technological progress to themselves by controlling prices (Reinert, 1993), the prospects for countries special-ized in low-tech may be rather bleak. In such a case, it may pay off for a country to change its pattern of specialization towards more promising areas through policy intervention, as suggested by Lucas (1988).
Despite the growing interest, and the novelty of some recent modeling efforts, this is not a new line of research. Arguably, the idea that the economic structure — and changes in this pattern — matters for growth is as old as economics itself (Reinert, 1993, 1995). Salter (1960), in his now classic work on productivity and technical change, emphasized that the scope for technological progress/productivity advance differ markedly across industries. Hence, ‘a flexible structure of production is an important element in the high rate of productivity increase, for it allows an economy to rapidly redistribute its resources so as to take maximum advantage of changing patterns of technological progress’ (ibid. p. 9). In his empirical analysis of UK productivity growth in the first half of the 20th century he showed that this flexibility, i.e. the ability to undertake structural change, was of great empirical importance: ‘This suggests that structural changes play a role equally important as increases in productivity within individual industries’ (ibid. p. 151). The growth-ac-counting literature (Denison, 1967; Chung and Denison, 1976) also emphasized
structural change as a major impetus to growth1. However, in contrast to the
detailed analysis of Salter, these later studies focused mainly on the shift from agriculture to manufacturing. Consequently, the growth accounting literature has little to say about the possible impact of specialization and structural change within manufacturing on productivity growth. This holds also for the more recent exercises in this tradition (e.g. Young, 1995).
This paper focuses on the relationship between specialization, structural change and productivity growth in manufacturing in recent decades. The perspective is similar to that of Salter in the sense that we analyze the manufacturing sector as composed of a number of different industries. However, we share with Denison the comparative approach to studies of economic growth: the present sample includes 39 market economies (on different levels of development), basically all countries within this category for which data are available. The next section presents the data and shows how productivity growth differs across industries and countries. We also analyze the extent to which rapid productivity growth goes hand in hand with low price growth. Then we turn to the relationship between structural change and productivity growth, using both an accounting approach (shift-share methodology) and econometric testing. The final section outlines the main findings and discusses the implications for policy.
2. An overview of the data
The data used in this paper are drawn from the UNIDO Industrial Statistics Database 1996, supplied by the Industrial Statistics Branch of the United Nations Industrial Development Organization (diskette version). While the database exists both at the 3-digit and 4-digit level of the International Standard Industrial Classification (ISIC), only the former was used, since the coverage of the latter is much more limited in terms of variables, time span and countries. Another problem is that many countries report data for combinations of one or more ISIC groups. In many cases this could not be resolved and we had to exclude either the countries or industries in question from the analysis. Because of such differences in reporting we decided to merge the three subgroups in ISIC 36 into one industry (Glass, pottery, etc.)2
. In addition, petroleum and coal products (ISIC 353 and 354) were excluded from the analysis, since data for these products were lacking for many countries. There were also some problems for other industries, especially metals, but these problems were in most cases resolved by checking the records of the database against published statistics. This left us with 24 industries (Table 1).
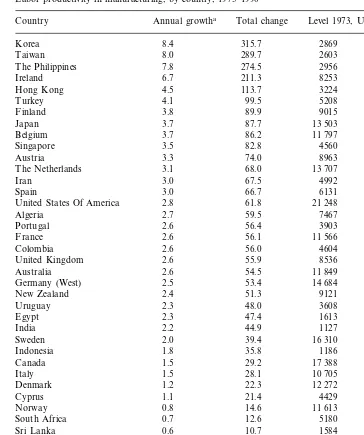
To ensure comparability across countries, the analysis was limited to what can be broadly described as market economies (as opposed to the so-called socialist or communist countries such as the former USSR). Regarding the time period, we wanted to focus on the decades following the end of the post-war growth boom (Abramovitz, 1994), i.e. the most recent decades. After some experimentation the years 1973 and 1990 were chosen, since this combination allowed us to include the largest number of countries. This left us with 39 countries, characterized by large differences in productivity levels and performance (Table 2). Although many of these countries are European, Asia and America are also relatively well represented. However, due to data limitations, we were only able to include three countries from Africa.
The main focus of our study is on labor productivity defined as value added per
worker3. In the database value added is reported in dollars in current prices,
employment in numbers of workers. To facilitate comparison between the two years we wished to deflate the value added data for 1990 to constant 1973 prices. Since no suitable deflator was available in the database, we decided to construct a price index based on data for industrial production (which were included in the UNIDO database both in current prices as an volume index) and apply this to value added as well. Hence, the price index applied here is both industry and country specific4.
2A similar problem arises for Indonesia and The Netherlands for sectors 371 and 372. This was solved by treating the two sectors as one (i.e. 371) for these two countries. Note that sector 372 is small relative to sector 371 in both countries, so this is not likely to cause much problem.
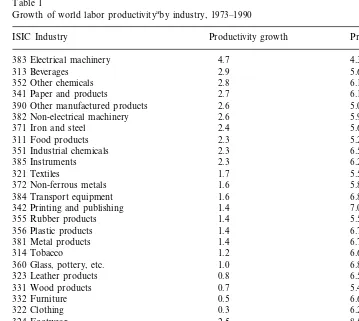
Table 1 reports growth of labor productivity in constant prices at the industry level for the world as a whole (i.e. the 39 countries included in our sample). Overall productivity growth, as calculated in this study, was 2.3% per year. The differences across industries were quite substantial. However, the true differences may be even larger, since statistical agencies often fail to distinguish properly between quality improvements, commonly assumed to be frequent in technologically progressive industries, and price increases (Griliches, 1979). At the very top, electrical machin-ery (which includes much of electronics5), productivity increased by 4.7% per year over the period, nearly two percentage points more than the second most fast
Table 1
Growth of world labor productivityaby industry, 1973–1990
Productivity growth Price growth
341 Paper and products 2.7 6.1
5.0
371 Iron and steel 2.4
311 Food products 2.3 5.2
6.5
372 Non-ferrous metals 1.6 5.8
1.6
384 Transport equipment 6.8
342 Printing and publishing 1.4 7.0
355 Rubber products 1.4 5.5
6.7 1.4
356 Plastic products
381 Metal products 1.4 6.7
6.6
324 Footwear −2.5 8.5
2.3
aConstant prices, average annual rate of growth.
Table 2
Labor productivity in manufacturing, by country, 1973–1990
Country Annual growtha Total change Level 1973, US dollars 2869
World 2.3 48.0 12 298
aConstant prices, average annual rate of growth.
electronics). There were, however, also a number of traditional industries in this category, such as beverages, food products, paper, iron and steel, etc. The remain-ing fourteen industries all grew less than 1.8% per year, and consist to a large extent of typically ‘mature’, low-tech industries producing for the mass market, such as, for instance, rubber products, plastic products, metal product, textiles, clothing and footwear. Hence, there appears to be a relationship between the degree of techno-logical sophistication of the industry and productivity growth, although there are probably also other factors at play.
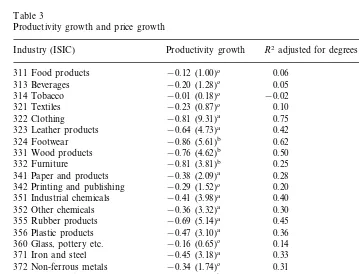
The table also reports growth in prices at the industry level in US dollars. On average it appears as if industries with high productivity growth have relatively low price growth and vice versa. In fact, of the eight most fast-growing industries, five had below average price growth. Conversely, seven of the eight slowest growing industries had above average price growth. However, as shown by the coefficient of
Table 3
Productivity growth and price growth
Industry (ISIC) Productivity growth R2adjusted for degrees of freedom
−0.12 (1.00)c 0.06
332 Furniture −0.81 (3.81)b 0.25
341 Paper and products −0.38 (2.09)a 0.28
−0.29 (1.52)c 0.20 342 Printing and publishing
351 Industrial chemicals −0.41 (3.98)a 0.40
−0.36 (3.32)a
352 Other chemicals 0.30
0.45 355 Rubber products −0.69 (5.14)a
−0.47 (3.10)a
356 Plastic products 0.36
360 Glass, pottery etc. −0.16 (0.65)c 0.14
−0.45 (3.18)a
371 Iron and steel 0.33
372 Non-ferrous metals −0.34 (1.74)c 0.31 0.53
−0.87 (6.20)b 381 Metal products
382 Non-electrical machinery −0.70 (4.27)b 0.48
−1.04 (6.37)b 0.47
aSignificantly different from both zero and−1 at the 5% level. bSignificantly different from zero, but not from−1, at the 5% level.
variation (bottom line), there is much more variation in productivity growth than in price growth, indicating that changes in productivity do not always carry over to prices (or at least not fully so). To explore this further we present in Table 3 estimates of the relationship between price growth and productivity growth for each industry. Following traditional (neoclassical) theory, in a (perfectly) competitive market a reduction in unit costs caused by technological progress should result in a similar decrease in prices. Hence, the estimated coefficient should under these conditions be expected to be equal to −1. But to the extent that firms are able to influence prices (have market power), it may be that some of the fruits of technological progress are appropriated within the industry itself and is reflected in increased factor rewards there rather than in lower prices. In the extreme case in which an industry has sufficient market power to keep the rewards from technolog-ical progress entirely to itself, there would be no relationship whatsoever between price growth and productivity growth (in this case the estimated coefficient should be expected to be zero). However, since the calculation of productivity growth in constant prices depends on the very same price indices that are used to calculate price growth, ordinary least squares would normally lead to biased estimates. To avoid such bias we applied 2SLS (two stage least squares) and instrumented productivity growth with a set of variables that are assumed to be correlated with it (but not with price growth)6.
The results7
(Table 3) reveal that in about one third of the cases the estimated coefficient is low in absolute value, and not significantly different from zero at the 5% level, consistent with the assumption of high market power. These are in most cases typical ‘low-tech’ industries processing natural resources (beverages, tobacco,
textiles and glass/pottery, for instance). There is another third for which the
estimated coefficient is high in absolute value and not significantly different −1. This group includes some relatively unsophisticated manufactures mostly destined for the mass market (footwear, wood products, furniture and metal products) but also electrical and non-electrical machinery and instruments, the three industries most intimately connected to the electronics revolution. The implication, then, should be that these industries are fairly ‘competitive’ in nature. The remaining industries (of which many belong to the chemical sector) fall in the intermediate range, indicating some — though incomplete — spillover from technological progress to prices. However, it needs to be stressed that the data and methods used here are rough, and that the results therefore should be regarded as just indicative.
6We used a combination of sector and country specific instruments. The sector specific instruments were: The initial level of productivity relative to the country average, the initial level of productivity relative to the industry average, growth of employment, the initial share of the sector in total manufacturing employment and change in the sector’s share of total manufacturing employment. The data used to calculate these instruments were taken from the UNIDO data base. The country specific instruments included enrollment rates in primary and secondary schools, investment as a share of GDP, exports as share of GDP, size of population and growth of gdp per capita (Source: World Bank).
Still it is worth nothing that there is very little support in these data for the idea that market power is especially pronounced in technologically progressive, ‘high tech’ industries.
Table 2 reveals that the differences in productivity growth are much larger across countries than over industries. This may reflect that the alleged failure of productiv-ity statistics to adequately reflect qualitative change is less of a problem at the aggregate level than at the level of the individual industry. For instance, unmea-sured quality advances in a supplier industry often end up as meaunmea-sured increases in output in user industries using these supplies, and would hence tend to be included in aggregate productivity growth. But it may also reflect that there is more to cross-country differences in productivity growth than just structural change. At the top of the list we find many of the so-called newly industrializing countries of Asia (Korea, Taiwan and Philippines) joined by some of their counterparts in Europe (Ireland, Turkey and Finland). Japan also does rather well. Among the other industrialized countries that were relatively advanced two decades ago already, the larger ones cluster towards the middle of the list, while there is considerably more diversity in among the smaller economies in this category (with the Central European ones doing relatively well and those from Northern Europe lagging). The South American countries also show a weak performance. Hence there are several examples here of groups of countries with common characteristics displaying a similar performance, giving some support to the idea of ‘growth clubs’ (e.g. Baumol, 1986; Durlauf and Johnson, 1995; Quah, 1996).
3. Accounting for structural change
What is the impact of differences across countries in patterns of specialization and structural change on productivity growth? In the following we will use the data just described to analyze this question.
In so doing we will make use of an empirical methodology designed to analyze such issues, often called ‘shift-share analysis’. It has been used frequently by among others economic geographers, economic historians, industrial economists and trade analysts8. Essentially it is a purely descriptive technique that attempts to decompose the change of an aggregate into a structural component, reflecting changes in the composition of the aggregate, and changes within the individual units that make up the aggregate. As such it is closely related to analysis of variance.
There are many versions of this methodology, the main difference being the choice of base year or ‘weights’: initial year, final year, some kind of ‘average’, linked,etc., and each version usually has its critics as well as defenders. The reason for this state of affairs is the well known result in index number theory that if, say, initial or final year weights are applied throughout in a decomposition, a residual will necessarily occur. So what many versions of this methodology do is to try to
reduce this residual as much as possible. An alternative solution, that we will pursue here, is to make an economic interpretation of the residual. This is not so difficult, since the very reason for a residual is that the variables taken into account in the analysis interact, i.e. it is an interaction-effect (see Fagerberg and Sollie, 1987).
Formally, the method applied here may be derived as follows: DefineP=Labor
productivity Q=Value added, N=Labor input (man-years, for instance).
Then
(labor productivity in industry i) (2)
Si=
Ni
%
i
Ni
(the share of industry i in total employment) (3)
Then, by substituting Eqs. (2) and (3) into Eq. (1):
P=%
i
[PiSi] (4)
Assume
DP=P1−P0, DS=S1−S0, etc.
Then, using Eq. (4), we have:
DP=%
The first term (I) is the contribution to productivity growth from changes in the
allocation of labor between industries. It will be positive if the share of high productivity industries in total employment increases at the expense of industries with low productivity. Thus, it reflects the ability of a country to move resources from low to high productivity activities.
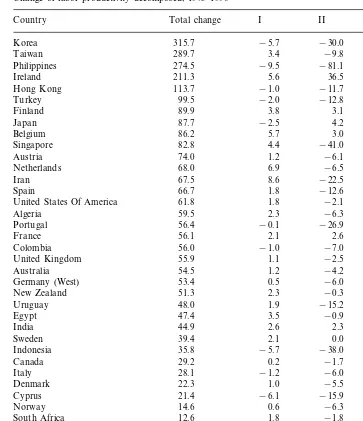
The second term (II) measures the interaction between changes in productivity in
Table 4
Change of labor productivity decomposed, 1973–1990
II III
Country Total change I
−30.0
315.7 351.4
Korea −5.7
Taiwan 289.7 3.4 −9.8 296.0
−81.1
Philippines 274.5 −9.5 365.2
36.5 169.2
Belgium 86.2 5.7 3.0 77.5
−41.0 119.5
United Kingdom 55.9 1.1 −2.5 57.2
−4.2 57.5
This effect will be positive if the fast growing sectors in terms of productivity also increase their share of total employment. Hence, it reflects the ability of a country to reallocate its resources towards industries with rapid productivity growth.
The third (III) is the contribution from productivity growth within individual
Table 4 gives the results from the calculations. The overwhelming part of total productivity growth is accounted for by productivity growth within individual industries (III). Transfer of resources from low to high productivity activities (I) does not appear to have been an important factor. The interaction effect (II) had somewhat more impact, but negatively in most cases (the main exception being Ireland). Hence, in contrast to the period studied by Salter, countries in the 70s and 80s did not change their economic structure in a way that was conducive for overall productivity growth. This confirms previous results from other studies based on much smaller samples of countries (Dollar and Wolff, 1988; Timmer and Szirmai, 1999).
It may be pertinent to ask why these results differ so much from those reported by Salter for an earlier period and more limited sample. To answer this question, it is useful to recall that for structural change to have a positive effect on overall productivity growth, there are two conditions that have to be fulfilled. First, there have be some changes in the sectoral composition of labor over time, that is, some industries have to increase their share of the total labor force at the expense of others. Second, these changes have to be correlated with productivity (effect I) or its rate of growth (effect II). Comparing the evidence studied by Salter with the data used here suggests important differences between the two samples in these respects.
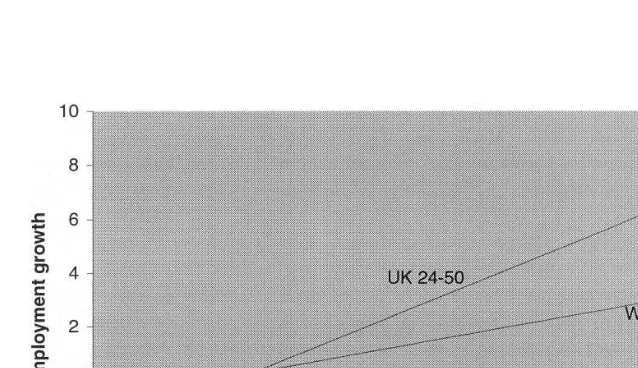
First, it appears to be the case that technical change in the period/sample studied by Salter was much more employment (and — consequently — output) expanding
than in the period under study here (Fig. 1)9. This is reflected in the steeper curve for the period studied by Salter. In fact, the data suggest that in that sample, 1% higher productivity growth was associated with 1.4% higher growth in employment, while in our sample the relationship between productivity growth and employment is less than one half of that level. This implies that even if productivity growth, including the dispersion around its mean, had been identical in the two samples, there would be much less structural change in our sample than in that of Salter.
Second, although the estimated relationship between employment and output growth was positive and significant in both samples, the explanatory power of the regression was much higher in Salter’s case than in our sample. In the period/sample studied by Salter, the rule that industries with rapid productivity growth also increased their shares of total output and employment at a rapid rate was almost without exception. For the more recent UNIDO sample, this picture is much more blurred. A closer look at the data for the world as a whole reveals that although electrical machinery displayed very high productivity growth, employment in this industry did not expand particularly fast, whether measured through its rate of growth or the change in its share of total employment. In terms of the former it was surpassed by six other industries, five of which had average or below average productivity growth. As for the latter, there were three industries with larger increases in the share of total employment: food products, plastic products and printing and publishing, all with average or low rates of productivity growth.
Hence, the results point to an important difference between the period/sample
studied by Salter and the one under study here10. In the former industries
characterized by rapid technological change, such as electricity generation, synthetic fibers, etc., also increased their shares of total production and employment at a fast rate. This means that changes in supply, associated with new technological opportu-nities, went hand in hand with changes in demand. However, the technologically leading industry in the period under study here, i.e. electronics, has not been associated with changes in the structure of demand to the same extent as the
9The results were:
UK sample (28 industries 1924 – 1950): n= −0.82+0.58y,R2=0.84
(4.66) (11.81)
UNIDO sample (24 industries 1973 – 1990): n= −0.44+0.38y,R2=0.38
(1.64) (5.89)
wherenis employment growth andyis output (or value added) growth. Estimated with ordinary least squares, absolute t-statistics in brackets. The relationship illustrated in Fig. 1 is obtained by substituting productivity growth (y−n) into the estimated equations. Salter also provide data for a sample of 27 US industries between 1923 and 1950, the result in that case was:
n= −1.52+0.50y,R2=0.68 (5.92) (7.39).
Evidently, trend productivity is higher in the US than in the other samples, otherwise the results are close to the UK sample.
technologically leading industries 50 years ago. As a consequence, structural change, as accounted for the methods used in this section, has not been as important for productivity growth as it was in the earlier period/sample studied by Salter.
4. The impact of the electronics revolution
The results reported in the previous section should not be taken to imply that structural changes are unimportant or that the electronics revolution does not matter for productivity growth. What it shows is that structural changeon a6erage
was not conducive to productivity growth. This does not mean that specific
structural changes that countries underwent were without economic importance. One industry that deserves further scrutiny in this respect is the electrical machinery industry, which by far has the highest rate of productivity growth of all industries in our sample. Moreover, among the industries in our sample, this is the one that has been most affected by the electronics revolution. In fact, one might argue that this industry is at the heart of this revolution, since it both produces electronic components and uses them intensively.
What we are going to explore in this section is to what extent it matters for the productivity growth of a country whether it increases the share of its resources that is devoted to the electrical machinery industry. In a pure accounting sense (as in the previous section) it should, because in most countries electrical machinery is characterized by both a high productivity level and high productivity growth. To take the most fast growing country of our sample, Korea, as example, our calculations show that a 1% increase in the share of total employment working in
this industry increased overall productivity growth with around 0.2%11
. Such numbers may differ somewhat from country to country, depending on the level and growth of productivity in the electrical machinery industry relative to other industries. For the world as a whole the effect seems to be a bit lower, about 0.1%. There is also a potential downside to this calculation, not taken into account here, because these workers might alternatively have been engaged in something else. Arguably, the total effect would look very different if these workers were taken from another high-growth, high-productivity industry instead of a declining one. There are, however, reasons to believe that the numbers presented here are closer to a lower than a higher bound. This is so because accounting methods of the type developed in the previous section fail to capture the indirect effects that technolog-ical progress in electronics has had for other industries. First, as already noted, there are some doubts as to whether producers of electronics have really been able to appropriate the full economic benefits from the continuous improvements in quality and performance that characterize technological progress in this industry. If not it implies that parts of the recorded productivity improvements in other
industries should be classified as originating from the electronics industry. The evidence reached in Section 2 of this paper, indicating more competitive pricing in this industry than in most others, may indicate that this is more than just a theoretical possibility. Furthermore, new and improved products originating in the electronics industry, but used in other industries, are likely to be conducive to innovation in products, processes, organization and management in these industries (so called induced innovations), leading to increased performance. Finally, new knowledge developed through the ‘electronics revolution’, may find new — and unexpected — applications in other industries, leading to new innovations and increased productiv-ity there.
In short, it is likely that technological progress in electronics spills over to other industries and gets recorded as productivity increases there, so that the actual importance of electronics for growth becomes underestimated by accounting-methods of the type applied here. In fact available evidence from several countries indicate that such indirect effects may be quite substantial (Goto and Suzuki, 1989; Bernstein, 1997; ten Raa and Wolff, 1999). Getting a grasp on the geographical boundaries of such spillovers may be trickier, however. If this is a worldwide effect, all countries might be expected to gain equally from it, not only those that have a high (and/or increasing) presence in the electronics industry. But available research on technolog-ical spillovers indicates that this is rarely the case. On the contrary distance and country borders are typically shown to have a strong impact (Henderson et al., 1993; Maurseth and Verspagen, 1999). Why this is so is a complex issue, which we cannot pursue here. What we may safely assume, however, is that an important part of such spillovers is local and national in character. This implies that a country’s performance in production of electronics may be expected to have growth effects at the national level exceeding what a pure accounting exercise what lead us to believe12
.
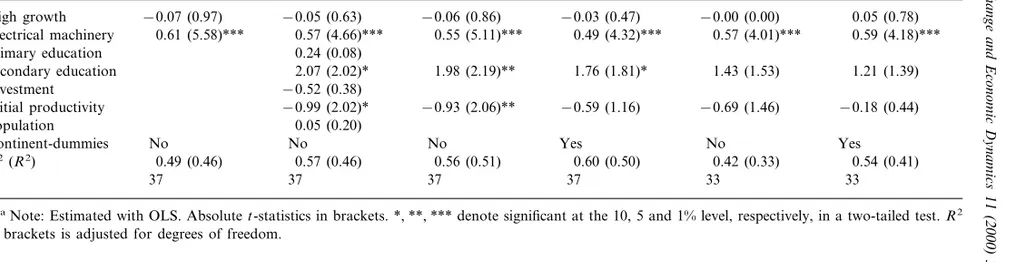
To explore this issue empirically we regress actual productivity growth in manufacturing on the change in the share of the electrical machinery industry in total manufacturing employment. We also include the change in the share of the work force going to other ‘high growth’ industries (defined as the upper third of the distribution, see Table 1) to allow for the possibility a similar impact there. However, since productivity growth of manufacturing at large may also be influenced by other variables than structural change, we also report regressions with other conditioning variables included. These are all from the country level and may be regarded as representing the pool of resources available for manufacturing in a given country. The conditioning variables (source: World Bank) include the initial productivity level (included as a measure of the scope for catch-up in technology), enrollment in education, the share of investment in GDP, size of population and continent-dummies (to allow for geographical clustering of performance).
407
Fagerberg
/
Structural
Change
and
Economic
Dynamics
11
(2000)
393
–
411
Table 5
Structural change and productivity growtha
5.5
5.1 5.2 5.3 5.4 5.6
0.05 (0.78)
−0.03 (0.47)
−0.06 (0.86) −0.00 (0.00)
−0.05 (0.63)
−0.07 (0.97) High growth
0.49 (4.32)*** 0.57 (4.01)*** 0.59 (4.18)*** Electrical machinery 0.61 (5.58)*** 0.57 (4.66)*** 0.55 (5.11)***
Primary education 0.24 (0.08)
1.43 (1.53) 1.21 (1.39) 2.07 (2.02)* 1.98 (2.19)** 1.76 (1.81)*
Secondary education
Investment −0.52 (0.38)
−0.18 (0.44)
−0.93 (2.06)** −0.59 (1.16) −0.69 (1.46)
−0.99 (2.02)* Initial productivity
0.05 (0.20) Population
Yes No Yes
No
Continent-dummies No No
0.60 (0.50) 0.42 (0.33) 0.54 (0.41)
0.57 (0.46)
R2(R2) 0.49 (0.46) 0.56 (0.51)
33 37
37 33
37 37
N
aNote: Estimated with OLS. Absolutet-statistics in brackets. *, **, *** denote significant at the 10, 5 and 1% level, respectively, in a two-tailed test.R2
The results are listed in Table 5. Versions with and without conditioning variables, as well as with and without continent-dummies, are reported. It turns out that increasing the share of electrical machinery (which we see as a proxy for electronics) in total employment is good for productivity growth, while it does not matter much what happens to the other high growth industries. The estimate is highly significant and remarkably stable across different specifications. The explanatory power is also quite respectable. Moreover, the predicted impact is large. If 1% of the workforce switches to electrical machinery from other industries, this will be associated with about 0.5% higher growth (compared to what would otherwise have been the case). Among the other variables, the scope for catch up (measured by the initial productivity level) and enrollment in secondary education received most support, but the inclusion of continent-dummies reduced the significance of these conditioning variables. Investment as a share of GDP did not turn up as an important factor, perhaps because manufacturing investment is only one among several elements that constitute total investment in a country.
Since many the fast-growing countries generally increased the share of electrical machinery in total employment quite significantly, the results reached here means that a large part of these countries’ exceptionally high productivity growth may be statistically ‘explained’ by their inroads in electronics and related industries. Four countries moved four per cent or more of their workforce from other industries to the electrical machinery industry; Korea, Singapore, Taiwan and Japan. On average, for these four countries, the estimated growth-bonus from increasing employment in the electrical machinery industry amounts to about one half of actual productivity growth in these countries. The estimate appears large, though, and one might suspect that the reported results to some extent depend on the inclusion of these four countries in the sample. The regressions in the two columns to the far right in Table 5 test for this possibility by excluding these four observations. It turns out that the estimated impact on overall productivity growth of moving resources to electrical machinery is not affected by the inclusion of these countries.
Thus, the results reported in this section point to substantial benefits accruing to countries that change their economic structure towards the technologically most progressive industries, in this case electronics. These benefits are partly related to the fact that electronics is a high-productivity, high-growth industry. However, the lion’s share of these benefits appears to be of the indirect type, in the form of positive spillovers from this industry to other industries and sectors in these countries13.
5. Conclusion
This paper has focused on the impact of structural changes on productivity growth in manufacturing. It was inspired by previous findings for the UK in the first half of the 20th century, showing that structural change played a very important role for overall productivity growth. The results reported here, based on a sample of 39
countries between 1973 and 1990, indicate that structural change still matters, but in a different way than before. The main difference concerns the role played by new technologies in generating structural change. In the first half of the 20th century, growth of output, productivity and employment were strongly corre-lated. Employment in industries based on new technologies (such as electricity and synthetic materials) expanded rapidly at the expense of more traditional industries, implying an important role for structural change in explaining overall productivity growth. More recently this relationship between output, productivity and employment has become more blurred. New technology, in this case the electronics revolution, has expanded productivity at a very rapid rate, particularly in the electrical machinery industry, but without a similarly large increase in the share of that industry in total employment. In fact, the industries that increased their role in total employment most substantially were generally traditional indus-tries — mostly geared towards private consumption — with average to low productivity growth. Hence, in recent decades, new technology has not been linked with structural changes in demand, output and employment in the same way as before. This explains why structural change — in a pure accounting sense — was more important for productivity growth previously than it appears to have been more recently (at least up to 1990).
However, this does not mean that the electronics revolution — or the struc-tural changes associated with it — have not been important for overall produc-tivity growth in the period under study here. First, the electrical machinery industry (which is the industry most intimately related to the electronics revolu-tion) has experienced much higher productivity growth than any other industry, implying a growth bonus for countries with a superior performance in this industry. Second, there have been important spillovers to productivity growth in other industries, and available research indicates that these have been stronger at the local or national level than globally. Hence, the results presented in this paper suggest that countries that during the period under study here managed to establish themselves firmly in the electronics industry got a sizeable growth bonus from these investments.
Acknowledgements
The work on this paper has benefited from economic support from the European Union’s TSER program, for which I am grateful. A preliminary version was presented at the Economic Dynamics and Structural Change workshop, Eindhoven, 3 – 4 October, 1999. I wish to thank Tao Zhang for research assistance, and the participants at the workshop and the editor and referee of this journal for comments and suggestions, retaining sole responsibility for remaining errors and omissions.
References
Abramovitz, M., 1994. The origins of the postwar catch-up and convergence boom. In: Fagerberg, J., Verspagen, B., von Tunzelman, N. (Eds.), The Dynamics of Technology, Trade and Growth. Elgar, Aldershot, pp. 21 – 52.
Amable, B., 1996. The Effects of Foreign Trade, Specialization and Growth: Does Specialization in Electronics Foster Growth? TEIS Working Paper, MERIT, University of Maastricht.
Baumol, W.J., 1986. Productivity growth, convergence and welfare: what the long run data show. American Economic Review 76, 1072 – 1085.
Bernstein, J., 1997. Interindustry R&D spillovers for electrical and electronic products: the Canadian case. Economic Systems Research 9, 111 – 125.
Chung, W.K., Denison, E.F., 1976. How Japans Economy Grew so Fast: The Sources of Postwar Expansion. D.C: Brookings Institution, Washington.
Denison, E.F., 1967. Why Growth Rates Differ: Post-War Experience in Nine Western Countries. DC: Brookings Institution, Washington.
Dollar, D., Wolff, E.N., 1988. Convergence of industry labor productivity among advanced economies, 1963 – 1982, The Review of Economics and Statistics, vol. LXX, No. 4 November, 549 – 558. Durlauf, S., Johnson, P., 1995. Multiple regimes and cross-country growth behaviour. Journal of
Applied Econometrics 10, 365 – 384.
Fabricant, S., 1942. Employment in Manufacturing, 1899 – 1939. National Bureau of Economic Re-search, New York.
Fagerberg, J., 1994. Technology and international differences in growth rates. Journal of Economic Literature 32, 1147 – 1175.
Fagerberg, J., Sollie, G., 1987. The method of constant market share analysis reconsidered. Applied Economics 19, 1571 – 1583.
Fagerberg, J., Verspagen, B., 1999. Modern Capitalism in the 1970s and 1980s, In: Setterfield, M. (Ed.). The Political Economy of Growth, Inflation and Employment. MacMillan, London.
Goto, A., Suzuki, K., 1989. R&D capital, rate of return on R&D Investment and Spillover of R&D in Japanese manufacturing industries, The Review of Economics and Statistics, vol. LXXI (4), 555 – 564.
Griliches, Z., 1979. Issues is assessing the contribution of research and development to productivity growth. Bell Journal of Economics 10, 92 – 116.
Grossman, G.M., Helpman, E., 1991. Innovation and Growth in the Global Economy. The MIT Press, Cambridge (USA).
Henderson, R., Jaffe, A.B., Trajtenberg, M., 1993. Geographic localization of knowledge spillovers as evidenced by patent citations. Quarterly Journal of Economics 108, 577 – 598.
Lucas, R.E., 1988. On the mechanisms of economic development. Journal of Monetary Economics 22, 3 – 42.
Lucas, R.E., 1993. Making a miracle. Econometrica 61, 251 – 272.
Maurseth, P., Verspagen, B., 1999. Europe: One or Several Systems of Innovation? In: Fagerberg, J., Guerrieri, P., Verspagen, B. (Eds.), The Economic Challenge for Europe: Adapting to Innovation-based Growth. Elgar, Aldershot.
Quah, D.T., 1996. Twin peaks: growth and convergence in models of distribution dynamics. Economic Journal 106, 1045 – 1055.
Pavitt, K., 1984. Patterns of technical change: towards a taxonomy and a theory. Research Policy 13, 343 – 374.
ten Raa, T., Wolff, E.N., 1999. Engines of Growth in the US Economy. Department of Economics, Tilburg University/New York University, Mimeo.
Reinert, E., 1993. Catching-Up From Way Behind. A Third World Perspective on First World History. In: Fagerberg, J., Verspagen, B., Von Tunzelmann, N. (Eds.), The Dynamics of Technology, Trade and Growth. Elgar, Aldershot, pp. 168 – 197.
Reinert, E., 1995. Competitiveness and its predecessors — a 500-year cross-national perspective. Structural Change and Economic Dynamics 6, 23 – 42.
Salter, W.E.G., 1960. Productivity and Technical Change. Cambridge University Press, Cambridge. Timmer, M.P., Szirmai, A., 1999. Productivity Growth in Asian Manufacturing: The Unimportance of
Structural Change. Groningen Growth and Development Centre/Eindhoven Centre for Innovation Studies, Mimeo.
Young, A., 1995. The tyranny of numbers: confronting the statistical realities of the east asian growth experience. Quarterly Journal of Economics 110, 641 – 680.