Korespondensi dengan Penulis:
Apriani Dorkas Rambu Atahau: Telp. +62 6281225087819 Email: [email protected]
LOAN PORTFOLIO COMPOSITION
AND PERFORMANCE OF INDONESIAN BANKS:
DOES OWNERSHIP MATTER?
Apriani Dorkas Rambu Atahau
Fakultas Ekonomika dan Bisnis Universitas Kristen Satya Wacana Salatiga Jl. Diponegoro No. 52-60, Salatiga,
ABSTRACT
As a country which is hard-hit by the crisis, Indonesian banking industry underwents banking reform with changes in its bank ownership structures. The changes may have impacted the loan portfolio compositions of banks. However, there is no study that has empirically tested the impact of the ownership structures on loan portfolio composition and performance in Indonesia, although the facts that credit risk is a major bank risk.
The objective of this research is to examine the loan portfolio composition of Indonesian banks in the post crisis period and to determine whether bank ownership plays a role in the composition and performance of the portfolios. This study used secondary data from the Indonesian Banking Directory of the Indonesian Central Bank and all commercial bank annual reports provided by Infobank magazine. The research sample consists of 109 commercial banks in the year 2011. The data is analysed by using multiple regression methods. It is envisaged that the research will give a broad insight on how different bank ownership types select their loan portfolio strategies when composing their loan portfolios.
Key words: banks, loan portfolio composition, performance, bank ownership types, Indonesia
1
BACKGROUND
Banks perform many roles in the economy. Basically, banks act as intermediaries between savers and borrowers (Patrick, 2001). Other roles performed by banks are providing funds to firms, facilitating the payment system, underwriting securities, ameliorating the asymmetric informa-tion problem, providing inter-temporal smooth-ing of risks and finally contributsmooth-ing to the
eco-nomic growth (Tandelilin et al., 2007, Allen and Carletti, 2008). However, the excessive risk taking of banks affects economic fragility, business-sector fluctuation and economic growth (Laeven and Levine, 2009).
do-mestic economic and financial structures, which implied weaknesses in the corporate governance of the underlying banks. Alijoyo et al. (2004), men-tions that the tw o major corporate governance problems in the banking sector w ere the w eak supervision from the central bank and the viola-tions of banking regulaviola-tions by the banks.
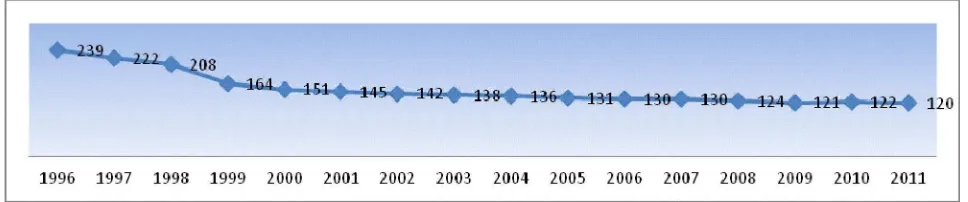
The financial crises led to a massive bank restructuring with the assistance of the Interna-tional Monetary Fund and the World Bank. The restructuring consisted of the closing down of in-solvent institutions, providing overdraft facilities as liquidity support for commercial banks, the es-tablishment of the Indonesian Bank Restructuring Agency (IBRA), merging and privatisation of state-owned banks, relaxation of limitations on private ownership of banks, and external auditing by over-seas auditors (Harada and Ito, 2006, Hadad et al., 2011). As a result, the number of commercial banks in Indonesia reduced from 229 before the crises to 152 in 1999, and continued to decrease to 120 banks in December 2011 (Kameyama et al., 2005). The declining trend in the number of commercial banks over the period of 1996-2011 is reflected in the fig-ure 1.1 below:
The massive restructuring of the Indonesian banking industry not only reduced the number of banks but also changed bank-ownership structures since government ownership decreased and pri-vate ownership (mostly foreign) increased. After privatisation of government-ow ned banks, the
market share of remaining government-ow ned banks decreased to 36.4 percent in December 2011 from 45 percent in December 2003 (Indonesian Banking Statictics, 2003 and 2011). Foreign bank2 market share increased especially after the aboli-tion of foreign bank branch limits and relaxaaboli-tion of ownership limits that occured in 1999 through the enactment of BankLaw (BL) 10/ 1998. The re-laxation of limitations enabled foreign investors to obtain ownership in Indonesian banks of up to 99 percent, either through the capital market or by ways of mergers and acquisitions. The formerly called private domestic banks w hich were to be nationalised by the government under the Indo-nesian Bank Restructuring Agency (IBRA) had the ownership transferred to foreigners because many Indonesian banks were not financially able to par-ticipate in their recapitalisation program. As such, the ownership share of foreign investors in the Indonesian banking sector increased, as can be seen in figure 1.2 and 1.3below.
Source: www.bi.go.id
Figure1.1: Number of Indonesian Com mercial Banks: 1996-2011
Source: w w w.bi.go.id
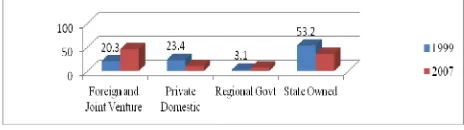
Figure 1.2 Total Assets of Different Bank Ow nership Types: 1999 and 2007
Sour ce: Pr ast om iyono, 2008
The figure showsthatover the period1999-2007, the total assets of foreign banks and joint venture banks have increased tremendously. Re-gional Development banks also showed a similar trend, but their asset growth was far less than that of the former group. On the contrary, private-do-mestic and government-owned banks experienced a decline in total assets, with a significant decrease in the case of the private banks. It indicates the transition of market share from the private-do-mestic and government-ow ned banks to foreign and joint venture banks. It implies the bigger role played by foreign and joint venture banks in the Indonesian banking industry. Loan disbursements, as measured by total loans in figure 1.3, provides similar information.
sure to non related single borrowers, 25 percent for non-related group borrowers and 10 percent for related party borrow ers. This forms part of the new banking architecture which was designed to enhance financial stability and contains pruden-tial regulations to limit the risky lending practices while at the same time fostering the implementa-tion of good bank governance.
The increasing role performed by foreign and private-domestic banks in the Indonesian banking industry in the post crisis, together with the prudential regulations introduced by Bank Indonesia for lending practice could have made definite differences to loan portfolio compositionsof different bank ownership types.
As intermediary institutions, banks play an important role in providing funds to borrowers. Bank ownership types have affect bank loan port-folios since it may imply a focus on different cus-tomer types. This is confirmed by De-Haas et al. (2010) that bank loan portfolios are determined by bank characteristics such as ownership and size. According to Berger et al. (2005a), loan portfolio composition changes can be associated with own-ership changes.
Different bank ownership types may focus on different borrower types, as reflected in their loan portfolio compositions (De-Haas et al., 2010). The different loan portfolio compositions result from inter-alia differences in organisational struc-ture, access to liquidity, exposure to asymmetric information (Degryse et al., 2012), motives, tech-nology and innovation capability (Berger et al., 2005a).
The composition of loan portfolios reflects to what extent banks apply focus or diversifica-tion strategies3. The diversification strategy is based on the modern portfolio theory of Marko-Figure 1.3 Total Loans of Different
Bank Ow nership Types: 1999 and 2007
Sour ce: Pr ast om iyono, 2008
The nationalisation of banks after the Asian Financial Crisis was an intense restructuring ef-fo rt undertaken by the go v ernment. The de-liberalisation of the banking sector was not lim-ited to bank consolidation, but also included nu-merous prudential policies. Limitations instituted on bank lending exposures to single borrow ers, bo rro w er gro ups and related parties, kno w n aslegal lending limits are some of the prudential policies imposed by Bank Indonesia to manage bank co ncentration risk in lending. The latest regulation(PBI No 8/ 13/ PBI/ 2006) sets 20 percent of bank capital as a maximum threshold for
expo-3The construction should t ake into account som e fact ors such as asset m ix, loan t ypes, diversificat ion, geographic lim its, exper tise, policy form ulation and
witz (1952), and largely followed by experts in fi-nancial institutions (Winton, 1999). According to idiosyncratic risk hypothesis, diversification elimi-nate the specific (idiosyncratic) risk which enable banks to reduce their monitoring efforts and there-fore lowering their operating costs, which ceteris paribus should lead to higher cost efficiency (Rossi et al., 2009). Furthermore, the benefit of diversifi-cation stems from employing economies of scope across different categories such as economic sec-tors and geographical areas (Laeven and Levine, 2007). Numerous benefits and costs of diversifica-tion were identified as indicated in Attachment1. Although the authors did not have similar research objectives regarding diversification, At-tachment 1 shows that most of them indicate risk reduction as the benefit o f diversification and agency problems as the associated cost. However, many researchers4 found that diversification do not always result in reducing risks and improving return.It increases the risk in the Brazil and Ital-ian banking sectors and reduces the performance of the banks in China, Germany and small Euro-pean countries(Tabak et al., 2011).
Some governing rules like the legal lending limits that are placed on banks by the central banks are diversification favourable, whilst other regu-lations regarding branching, entry, and asset in-vestment restrictions often encourage focus strat-egies (Berger et al., 2010). However, the existence of regulatory guidelines instigating diversification that result in a large number of individual clients and industries may increase monitoring cost and reduce cost efficiency (Rossi et al., 2009). Further-more, due to the fact that managers are risk averse, they may incur additional cost in search for high quality loans to apply diversification. Those
fac-tors may reduce diversification risk-return effec-tiveness.
A focus strategy opposed to a loan portfolio diversification strategy, suggests concentration on specific segments where a bank has superior knowl-edge and monitoring ability. Focusing on a spe-cific segment is effective when banks face infor-mation asymmetry (Acharya et al., 2002), Kamp et al. (2005),Berger et al. (2010), Tabak et al. (2011)). Due to different degrees of asymmetric informa-tion about borrow ers, the composiinforma-tion of bank loans across sectors may differ (Dell’Ariccia and Marquez, 2004). Re-allocation of loans (commonly know n as flight to captivity5), to sectors w here greater adverse selection problems exist may hap-pen when banks face mere intrinsic overall com-petition from other outside lenders entering the market. It means that more lenders may attract borrow ers in sectors subject to low information asymmetries. The existing informed lenders may have to deal with more captured (but also higher risk) borrowers in sectors not previously forming part of their market (Dell’Ariccia and Marquez, 2004). As indicated by Laeven and Levine (2009), the extent of bank loan portfolio risk taking has to be linked with the ownership structure of a bank. Based on the aforementioned statements of re-searchers about the relationship betw een loan portfolio composition and bank ownership, it is assumed that the major reform in the banking sec-tor that consisted of changes in bank ownership structures may have resulted in substantial changes to loan portfolio compositions of banks. However, there is no study to date that has empirically tested the impact of the ow nership structures on loan portfolio composition in Indonesia albeit the fact that loan risk is a major bank risk (Hammes and
4 Am ong ot her s are W inton(1999), Acharya (2002), and Hayden (2006)
5 Flight t o capt ivity im plies that banks r e-allocat e t heir por tfolio tow ar ds m or e capt ive borrow er s w hen shocks to their balance sheet, or fr om their com pet itive
Shapiro, 2001, Goeltom, 2005). Although Micco and Panizza (2006) have done a comprehensive study regarding the ownership impact on performance, they did not consider the role of loan portfolio compositions. This research expands the study of the ow nership impact on bank performance by incorporating loan portfolios. It aims to examine the loan portfolio composition of Indonesian banks and to determine whether government-, domes-tic-, and foreign-owned banks differ in terms of loan portfolio composition, risk and return. Ac-cordingly, this research contributes to the academic literature by using bank-level information about loan portfolio composition, risk and performance, and relates it to bank ownership structures.
The findings shows that loan portfolios of government-owned banks are more concentrated on sectors not directly related to economic devel-opment, such as consumption, whereas domestic-and foreign-ow ned banks have more diversified loan portfolios. Domestic-owned banks are mostly involved in lending to enterprises in trade, hotels and restaurants. Foreign-ow ned banks are the major player in lending to business services and several other sectors such as manufacturing. Dif-ferences in the loan portfolio composition and con-centration risk of government-, domestic-and for-eign-owned banks result in different loan portfo-lio returns. Government-owned banks show the highest lo an portfolio return co mpared to the other bank ownership types. Focusing on segments w ith low intrinsic risk provides government-ow ned banks with a better return. The findings support the corporate finance theory according to which banks should implement focus strategies to reduce agency problems and exploit their manage-ment expertise in certain sectors. Their findings do not support the traditional banking and
port-folio theory according towhich banks should di-versify their loan portfolio to reduce risk (Hayden et al., 2006).
2 LITERATURE REVIEW
Degryse et al. (2012) found the differences in loan portfolio composition of different bank ow nership types based on data from 110 Polish banks. Their findings show that foreign banks charge lower lending rates and have lower inter-est spreads. The lending rate difference is caused by their loan portfolio composition relating to dif-ferences in transparent, short-term and foreign-exchange borrowers.
Using ordinary least square regression, De-Haas et al. (2010) confirmed differences in the loan portfolio composition of bank ow nership types bytheir research of 220 banks in 20 transition coun-tries. They used several loan type variables such as mortgages and other consumer lending; small and medium enterprises; lending to large entre-preneurs; and lending to state-owned entrepre-neurs. The results show that State-owned banks still lend more to state-ow ned enterprises than domestic and foreign banks. Foreign banks focus on mortgage lending and lending to subsidiaries of international firms, but their focus on foreign clients is limited to the corporate segment. The research did not include economic sector category analysis, but this may be due to the inexistence of micro-level data to conduct such analysis. Also other previous research about loan portfolio com-position using economic sector categories and bank ownership types, could not be retrieved.
Research that only considered loan portfo-lio composition, generally examined the effect of diversification on bank return and risk.6 Unlike
6Am ong others ar e: Rossi et al. (2009), Tabak et al. (2011), Kam p et al. (2005), Langrin and Roach (2009), Kam p et al., (2007), M encia (2012), Acharya et al. (2002),
loan portfolio composition, research about concen-tration risk is limited. Düllmann and Masschelein (2006),Dietsch and Petey (2009), and Bandyo -padhyay (2010) are among the few authors who measured the impact of concentration risk on bank capital. Düllmann and Masschelein (2006) exam-ined the relationship between business-sector con-centration and economic capital for loan portfo-lios. Dietsch and Petey (2009) focused on the mea-surement of risk under Pilar 2 of the Basel II regu-lation. They extended a one factor credit default mo del to measure the concentratio n potential within large portfolios of small and medium busi-nesses. Bandyopadhyay (2010) demonstrated that the regional, industry and individual loan portfo-lio concentration may be assessed using the eco-nomic capital approach.
Researchers such as Berger et al. (2005a) and Iannotta et al. (2007) investigated banks perfor-mance difference between bank ownership types. Their unit of analysis w as bank performance al-though loan portfolio performance formed part of it. Berger et al. (2005a) used portfolio reallocations after changes in bank ownership types to test the significance thereof. The findings indicate that the performance of government-ow ned banks that were privatised are better in terms of capital allo-cation efficiency since more credit is provided to industries that co ntribute mo re to the GDP. Iannotta et al. (2007) investigated the performance and risk of European banks with different bank ownership structures. They found significant dif-ferences in the performance and risk of different ownership types. Private banks appear to be more profitable than both mutual and public sector banks with higher profit from net returns on their earn-ing assets. On the risk side, public sector banks have poorer loan quality and higher insolvency risk than other types of banks, while mutual banks have better loan quality and lower asset risk than both private and public sector banks.
The significant characteristic differences be-tween the major bank ow nership types (govern-ment-, do mestic-, and fo reign-o w ned banks) based on research findings are summarised in At-tachment 2. In this regard it is evident that many research findings indicate that:
a) Government-ow ned banks apply low credit availability due to connected lending;provide loans that the private sector would not grant; have high risk exposure due to its Non Per-forming Loans (NPLs); and show low profit and cost efficiency, have different loan port-folio composition and performance compared to that of other types of ownership.
b) Domestic-owned banks apply more aggresive lending and havehigher portfolio risks than foreign banks; have limited access to external liquidity;butbetter local market knowledge. c) Fo reign-o w ned banks apply better credit
availability due to less connected lending, and advanced risk management technology and superior access to capital markets and tech-nologies; may result in different composition and performance.
In view of the performance related charac-teristics of the different bank ownership types, it is hypothesized that there exists loan portfolio composition and risk differences among different types of bank ownership. As a result their perfor-mance may also differ.
3 RESEARCH M ETHOD
3.1 Sample, Types and Sources of Data
sample due to different accounting/ financial re-porting standards compared to that of the con-ventional banks.
This research uses secondary data from The Indonesian Central Bank Library, Infobank maga-zine and the library of The Indonesian Banking Development Institute (LPPI). The central bank library provides individual bank ownership data and financial statements whereas Infobank maga-zine supply notes of financial statements for each individual bank from which information regard-ing loan allocation, based on loan types and eco-nomic sectors, can be retrieved. The data regard-ing the comparative exposures of individual In-donesian banks to all the different economic sec-tors and different finance types will make the re-sults more accurate in comparison to other stud-ies about this topic. Finally, LPPI supplement the loan allocation data which are not provided by Infobank magazine.
3.2 Variable Definition and M easurement
The dependent variable in this research is loan portfolio return as measured by the ratio of net interest income to total loans. There are three independent variables in this research: bank own-ership types, concentration risk and intrinsic risk. For analysis purposes banks are categorised into three types of ow nership(government, domestic and foreign) according to the criteria of Mian (2003) and Magalhaes et al. (2010), by first calculating the total ownership percentage of government-, for-eign- and domestic-owners for each bank. This research uses 20% threshold which is consistent with the previous research conducted by La-Porta et al. (2002), Dinc (2005), Haw et al. (2010) and Taboada (2011). This research uses two dummy variables to identify the three types of bank
own-The concentration risk is measured using a Hirschman Herfindahl Index (HHI) as done by Winton (1999), Acharya et al. (2002) and Hayden et al. (2006). For this research, there will be two types of HHI’s, namely Economic Sector7 HHI (E-HHI) and Loan Type HHI (T-(E-HHI). Loan concen-tration means high exposure to one or a few of these sectors, whilst diversification means a more equal loan portfolio distribution (Tabak et al., 2011). The intrinsic risk is measured by usingthe ratio of non-performing loans (NPLs) to total loans. Bank size in addition tobank ownership is used asa con-trol variable and isexpressed as the logarithm of total assets. Attachment 3reflects all the variables, their definitions and how they are measured.
3.3 M ethod of Analysis
This research is based on quantitative data analysis since it deals with numerical data w ith ratio data types. The descriptive statistics of the variables: mean, median, maximum, minimum and standard deviation are calculated to obtain a brief understanding of data tendency and deviations. To determine the impact of different ownership types on the composition, risk and performance, this research employs multiple regressions, with the equation in attachment 4.
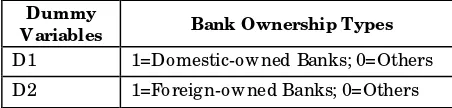
Dummy
Variables Bank Ownership Types
D1 1=Domestic-owned Banks; 0=Others
D2 1=Foreign-owned Banks; 0=Others
Table 3.1 Dummy Variables of Bank Ow nership Types ership. Table 3.1 shows the detail of these dummy variables (government-owned banks are treated as the base case variable).
7The Indonesian econom ic sector s to w hich banks can lend are equal to 10 according to cent ral bank classification as follow s: Agriculture, hunting and agricultural
4 RESULT AND DISCUSSIONS
Prior toanalyzing the data, the test of classi-cal assumptions: normality, linearity, homoscedas-ticity and multicolinearity was conducted since the usage of multiple regressions requires several as-sumptions (attached are the SPSS results). The test-ing of normality, linearity and homoscedasticity assumptions were done by examining the residual scatterplots (Tabachnick and Fidell, 2007). The re-sults showthat the assumptions of normality,
lin-earity and homoscedasticity are satisfactory. The same result was found for multicolinearity8. Based on the results, it could be concluded that the re-gression model used in this research satisfied the underlying assumptions.
4.1 Descriptive Statistics
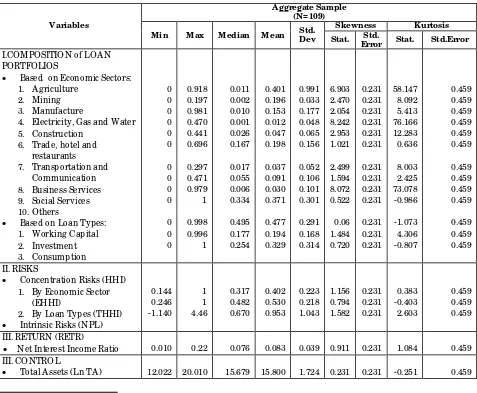
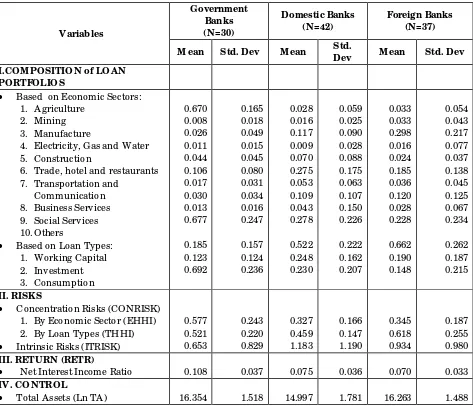
Table 4.1 contains the summary statistics of the variables in the model. The first part presents the descriptive statistics regarding loan allocation
Variables
Aggregate Sample (N=109)
M in M ax M edian M ean Std. Dev
Skewness Kurtosis
Stat. Error Std. Stat. Std.Error
I.COMPOSITION of LOAN PORTFOLIOS
Based on Economic Sectors:
1. Agriculture
2. Mining
3. Manufacture
4. Electricity, Gas and Water
5. Construction
6. Trade, hotel and
restaurants
7. Transportation and
Communication
8. Business Services
9. Social Services
10.Others
Based on Loan Types:
1. Working Capital
2. Investment
Concentration Risks (HHI)
1. By Economic Sector
(EHHI)
2. By Loan Types (THHI)
Intrinsic Risks (NPL)
0.144
III. RETURN (RETR)
Net Interest Income Ratio 0.010 0.22 0.076 0.083 0.039 0.911 0.231 1.084 0.459
III. CONTROL
Total Assets (Ln TA) 12.022 20.010 15.679 15.800 1.724 0.231 0.231 -0.251 0.459
8 The norm ality assum ption is sat isfied since the r esidual scatterplot reveals a pileup of residuals in the cent re of the plot at each value of pr edict ed score and a
norm al dist ribution of residual tr ailing off sym m et rically from the cent re, the linear ityassum ption also satisfied since the overall shape of the scatterplot is rectangular, the heteroscedasticity assum ption is satisfied since the residual scatterplot do not form a pattern, but random ly distributed, multicollinearity assum ption is satisfied since VIF value les than 10 and the corr esponding toler ance value m or e t han 0.1
based on economic sectors and loan types. The variation for loans allocated to each sector is higher than that for loan types. The deviation between the mean and median for loan allocation to each sector is also higher than that of loan types. Ob-serving the skew ness statistics and standard er-ror provides evidence of the skewness in the dis-tribution of loans allocated to each sector and type of finance. Only loans allocated as working capi-tal show normal distribution since the skewness falls within the range between -2 and +2. The
posi-tive skew ness for all variables indicate the ten-dency of scores to be clustered to the left – repre-senting low values. On the other hand, the major-ity positive kurtosis statistics indicate that some distributions are relatively peak (clustered in the centre). The non-normal distribution due to posi-tive skew ness for loan allocation to each sector and type of finance indicates the need for formation. Therefore those values were all trans-formed to natural logarithm (ln) as the appropri-ate methods for the positively skewed
distribu-V ariables
I.COM POSITION of LOAN PORTFOLIOS
Based on Economic Sectors:
1. Agriculture
2. Mining
3. Manufacture
4. Electricity, Gas and Water
5. Construction
6. Trade, hotel and restaurants
7. Transportation and
Communication
8. Business Services
9. Social Services 10.Others
Based on Loan Types:
1. Working Capital
2. Investment
Concentration Risks (CONRISK)
1. By Economic Sector (EHHI)
2. By Loan Types (THHI)
Intrinsic Risks (ITRISK)
0.577 III. RETURN (RETR)
Net Interest Income Ratio 0.108 0.037 0.075 0.036 0.070 0.033
IV . CONTROL
Total Assets (Ln TA) 16.354 1.518 14.997 1.781 16.263 1.488
tion (Tabachnick and Fidell, 2007). The values of other variables (concentration risk, intrinsic risk, and return) were not transformed since the re-sidual scatterplot of regression involving these variables indicate a normal distribution.
The mean of (ln) bank size is 15.8 or approxi-mately 32,289,973 million Rp (about 3,588 million US$). In percentage, the NPL (net) is low with an average ofless than 1 percent (0.953 %). It is com-paratively low to the 5% threshold enacted by the central bank.By analyzing the mean and the stan-dard deviation of HHI as concentration measure, it can be seen that loan portfolios based on eco-nomic sectors are less concentrated than portfo-lios based on loan types. It implies more diversi-fied loan portfolios in terms of economic sectors rather than loan types. However, both measures show that overall the Indonesian bank loan port-folios seem to be moderately concentrated. This is similar with the case of Brazilian banks which also falls in the range ofmoderate HHI with HHI 0,316 and only more diversified than Argentina with HHI 0.55 (Tabak et al., 2011).
Table 4.2 show s that go vernment-ow ned banks have the highest concentration risk based on sectors, however they have the lowest intrin-sic risk and highest return. As stated by Deutsche Bundesbank (2006), focusing on specific segments may create concentration risk but as long as the targeted sector consists of high quality borrowers with low intrinsic risk,it may result in high return. As government-owned banks focus on consumer loans withdirect salary deduction,the associated intrinsic risk is low. Consumer loans provide gov-ernment-owned banks with high return since the interest rate earned from this segment is high com-pared to that of other types of financing. Based o n d ata fro m Ind o nesian Statistics Bureau (www.bps.go.id), the average consumer loan in-terest rate is approximately 1.5-2 % higher than that of other types of financing. Moreover, since managers of government banks are mostly
gov-ernment bureaucrats, their risk averse profile may affect their decision to focus on specific segments since applying diversification will incur additional cost for searching high quality borrowers in other segments (Rossi et al., 2009).
4.2 Loan Portfolio Composition of Different
Bank Ow nership Types
their home country experience in the retail mar-ket (De-Haas et al., 2010). They possess better ac-cess to capital markets (Berger et al., 2005a) and external liquidity from their parent banks, com-pared to domestic banks (Mian, 2003). In terms of size, government-and foreign-ow ned banks are relatively similar in size whereas domestic-owned bank are on average smaller.
4.3 Loan Portfolio Performance (Risk and
Return) of Different Bank Ow nership Types
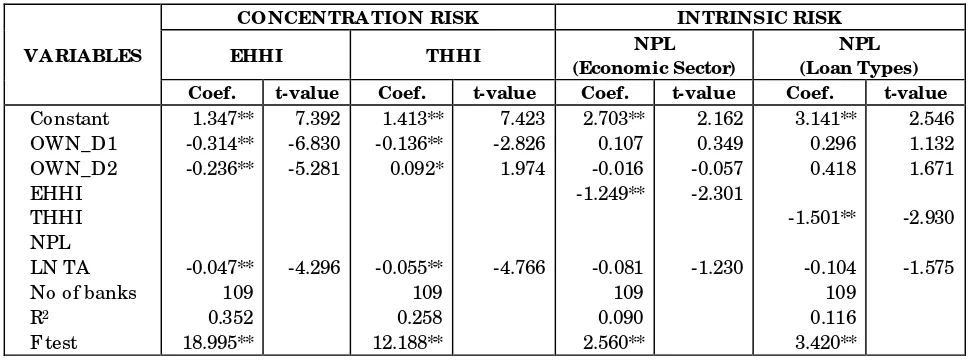
Table 4.5 presents the results of the ordi-nary least square estimation of equation (2) and (3). The estimated coefficients of the ow nership econo mic secto r and lo an type co ncentratio n risks,are all significant (column 2 and 4). These results give evidence that bank ownership types influence concentration risk. Based on the sign of
the coefficients, it is clear that domestic- and for-eign-ow ned banks have less concentrated loan portfolios relating to economic sectors than gov-ernment-owned banks. How ever, based on loan types, foreign-owned banks tend to be more con-centrated than other types of bank ownership.This is supported by the findings regarding the high mean exposure of 0.618 exposure of foreign banks in table 4.2. On the other hand, the coefficient of bank size as the control variable is negative and significant. It means larger bank tend to have a more diversified lo an po rtfolios than smaller banks.
Unlike concentration risk, bank ow nership types do not show significant relationship with intrinsic risk. The coefficients are positive (mean-ings that domestic-and foreign-owned banks ex-perience higher intrinsic risk than government banks) but they are not significant. However, there are significantnegative relationships between both
Variables Dependent Variable: Loan Portfolio Composition
1# 2 3 4 5 6 7 8 9 10
Constant -8.341 -11.697** -8.470** -9.327** -4.052** -2.246** -10.279** -9.315** -5.848** -2.541** Own_Dummy1 -0.159 3.267** 2.644** 0.377 0.464 0.969** 2.776** 2.542** 1.196** -1.032** Own_Dummy2 -0.075 3.556** 3.570** 0.037 0.130 0.840** 2.492** 2.685** 1.454** -1.708** Ln TA 0.278** 0.284** 0.216** 0.253 0.011 -0.026 0.267** 0.279** 0.051** 0.122
No of banks 109 109 109 109 109 109 109 109 109 109
R2 0.08 0.537 0.565 0.048 0.016 0.135 0.374 0.403 0.167 0.253 F test 2.592* 26.240** 44.120** 0.865 0.495 5.319** 17.532** 19.354** 4.269** 11.855**
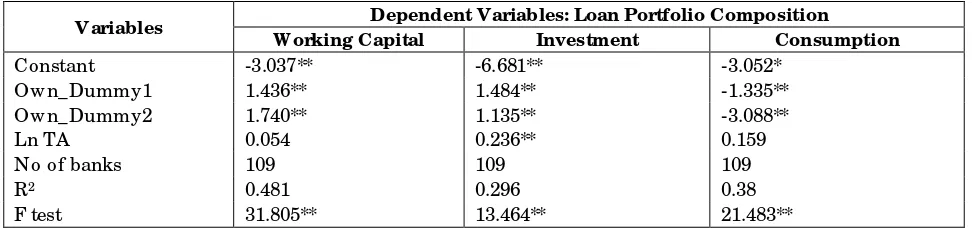
V ariables Dependent V ariables: Loan Portfolio Composition
W orking Capital Investment Consumption
Constant -3.037** -6.681** -3.052*
Own_Dummy1 1.436** 1.484** -1.335**
Own_Dummy2 1.740** 1.135** -3.088**
Ln TA 0.054 0.236** 0.159
No of banks 109 109 109
R2 0.481 0.296 0.38
F test 31.805** 13.464** 21.483**
Table 4.3 Relat ionship bet ween Loan Portfolio Composition by Economic Sector and Bank Ow nership Types
# : The nam e of t he cor responding number of econom ic sect or refer s t o t he previous explanat ion (see: foot not e 6) * * : significant at = 5%; * : significant at = 10%
Table 4.4 Relat ionship bet ween Loan Portfolio Composition by Loan Types and Bank Ow nership Types
VA RIABLES
CONCENTRA TION RISK INTRINSIC RISK
EHHI THHI NPL
DEPENDENT V ARIABLES IINC Table 4.5 Relat ionship between Bank Ownership Types and Risk (Concent rat ion and Int rinsic)
* * : significant at = 5%; * : significant at = 10%
Table4.6 Relationship betw een Bank Ow nership Types, Risks and Return
* * : significant at = 5%
EHHI and THHI concentration risk and intrinsic risk. The coefficients are significant at =5%. It means that banks with higher economic sector and loan type concentration risks experience lower in-trinsic risk as measured by NPLs. This findings is consistent with the findings of Tabak et al. (2011) but contradicts with the ideas of Diamond (1984). As already pointed out by Rossi et al. (2009), fo-cusing on certain market segment (a more concen-trated loan portfolios) may reduce default/ intrin-sic risk due to a higher monitoring efficiency and
risk on loan portfolio returns. Based on the table, bank ownership types and size significantly affect loan portfolio returns, as measured by net inter-est income. The negative coefficients of the bank ownership dummy regressors show that domes-tic- and foreign-owned banks have smaller returns compared to government-owned banks. This find-ing contradicts Iannotta et al. (2007) and other lit-erature that find that government-owned banks under-perform compared to other bank ow ner-ship types (LaPorta (2002), Barth et al. (2004), Mian (2003), Beck et al. (2004), Sapienza (2004), Berger et al. (2005a), Dinc (2005), Micco and Panizza (2006), and Taboada (2011). However, it should be noted that previous research use bank returns instead of loan portfolio returns. The finding differences may emanate from the fact that this research focus on loan portfolios, which may not be comparative to total returns.
5. CONCLUSION
Previous research indicates that bank own-ership type is one of the bank loan portfolio de-terminants, since different bank ownership types may focus on different customer types (market segments) according to their characteristics (De-Haas et al., 2010). However,literature dealing with the relatio nship betw een bank o w nership types,loan portfolio composition, risk and return for Asian countries, such as Indonesia is scarce. This paper attempts to examine the loan portfolio composition of Indonesian banks in the post crisis period and to determine whether bank ownership plays a role in the composition and performance of the portfolios.
The findings support the hypotheses that different bank ownership types differ with regard to loan portfolio composition, risk and return. The loan portfolios of government-ow ned banks are more concentrated on sectors not directly related to economic development, such as consumption,
whereas domestic-and foreign-owned banks have more diversified loan portfolios. Domestic-owned banks are mostly involved in lending to enterprises in the trade, hotels and restaurantssectors whilst foreign-owned banks are the major player in lend-ing to the business services and several other sec-tors such as manufacturing
Differences in the loan portfolio composi-tion and concentracomposi-tion risk of government-,do-mestic-and foreign-owned banks result in differ-ent loan portfolio returns. Governmdiffer-ent-ow ned banks show the highest loan portfolio return com-pared to the other bank ownership types. Focus-ing on segments with low intrinsic risk provides government-ow ned banks with a better return. The findings support the corporate finance theory according towhich banks should implement focus strategies to reduce agency problems and exploit their management expertise in certain sectors. The findings do not support the traditional banking and portfolio theory according tow hich banks should diversify their loan portfolio to reduce risk (Hayden et al., 2006).
indi-Author (Year) Diversification Benefits Diversification Costs
Hayden et al. (2006) Reduce risks of bank failure
Reduce cost to achieve credibility
in bank role as screeners or monitors of borrowers
Agency Problems
Inefficient allocation of resources
Loss in bank value
Rossi et al. (2009) Reduce the cost of financial
intermediation
Increase the incentive to monitor
Increased systematic risk
Berger et al.(2010) Reduce chance of financial
distress
Provide cheaper way to achieve
credibility of banks as monitors of borrowers
Leverage of managerial skills
and abilities across products and geographic regions
Gain economies of scope and
economies of scale
Provide financial supermarket
ability in terms of multiple products
Dilution of management comparative
advantage
Inducing competition
Increased agency costs
Elsas et al. (2010) Economies of scope
Improved resource allocation
Lower tax burden due to higher
financial leverage
Ability to use firm-specific
resources to extend competitive advantage from various markets
Agency problems
Inefficient internal resource allocation
Informational asymmetries between
head office and divisional managers
Increased incentive for rent-seeking
behaviour by managers
Tabak et al. (2011) Reduce bank probability of
default
Reduce financial intermediation
costs
Reduce vulnerability to
economic downturns
Increased competition
Unable to reap benefits from business
expertise in specific sector
vidual clients and industries may increase moni-toring cost and reduce cost efficiency (Rossi et al., 2009), and therefore counteract diversification. The findings imply the need to implement measures to enhance required financial intermediation in
sectors of the economy where inadequacies exist or w here specific grow th is requiredFuture re-search may focus on the relationship between bank ownership types and capital allocation to large and small-medium scale enterprises (SMEs).
A
tt
a
c
h
m
e
n
t
2
C
h
a
ra
c
te
ri
st
ic
s
o
f
B
a
n
k
O
w
n
e
rs
h
ip
T
y
p
e
:
A
C
o
m
p
a
ri
so
No Variable Definition M easurement Remarks
1 a. Bank ownership
Types:
Government Banks (GB)
Banks with government total ownership exceed 20% of total bank shares, as measured directly
=
= 1
GBi= the government’s
share in bank i
Sji=share of bank iowned
by government i=commercial banks in Indonesia
j=bank’s shareholders
b. Bank ownership
Types:
Domestic Banks (DB)
Banks with private-domestic total ownership exceed 20% of total bank shares, as measured directly
=
= 1
DBi= the
private-domestic’s share in bank i
Sji=share of bank iowned
by private-domestic i=commercial banks in Indonesia
j=bank’s shareholders
c. Bank ownership
Types:
Foreign Banks (FB)
Banks with foreign total ownership exceed 20% of total bank shares, as measured directly
=
= 1
FBi= the foreign’s share in
bank i
Sji=share of bank iowned
by foreigners
i=commercial banks in Indonesia
j=bank’s shareholders
2 Concentration Risk
(CONRISK)
The risk arising from an uneven distribution of counterparties in credit or any other business relationships or from a
concentration in business sectors or geographical regions which is capable of generating losses large enough to jeopardise an
institution’s solvency(Deutsche Bundesbank, 2006)
=
2
= 1
HHI= Hirschman Herfindahl Index
Q= ∑10
= 1
= the percentage of credit to each sector
= 10 for E-HHI and 3 for THHI
3 Intrinsic Risk
(ITRISK)
A different risk inherent to each industry, region or product of a bank(Cronje, 2013)
(Substandard+Doub tful+Loss)/ Total Loans
4 Return (RETR) The net income obtained from
bank’s loan portfolio
Net Interest Income/ Total Loans
5 Size (SIZE) The total assets of each individual
bank
Loan Portfolio Composition
To determine whether loan portfolio composition vary significantly across different bank ownership types, the following regression model is used:
………..(1)
= loan portfolio allocation on specific sector for the ith bank
= vector of ownership types variables;
= size of bank i, as control variables;
= regression coefficients; and
= the disturbance term. Loan Portfolio Risks
To determine whether loan portfolio concentration risk vary significantly across different bank ownership structures, the following regression model is used:
………(2)
= loan portfolio concentration risks for the ith bank
= vector of ownership types variables
= size of bank i, as control variables;
= regression coefficients; and
= the disturbance term.
In order to find the relationship between concentration risk and intrinsic risk, this research runs regression of concentration risk (both based on economic sector and loan types) to intrinsic risk for all banks by using the following equation:
= ………..(3)
Where:
= Intrinsic Risk of bank iat year t
= size of bank i, as control variables
= Regression Coefficients = Disturbance Term Loan Portfolio Return
To determine whether loan portfolio return vary significantly across different bank ownership types, the following regression model is used:
………(4)
= loan portfolio return for the ith bank
= vector of ownership structure variables
= Intrinsic Risk of bank iat year t
= loan portfolio concentration risks for the ith bank
= size of bank i, as control variables;
, = regression coefficients; and
= the disturbance term.
Variables Tolerance VIF
OWN_DUMMY1 .420 2.381
OWN_DUMMY2 .535 1.868
ITRISK .910 1.098
CONRISK (EHHI) .617 1.621
CONRISK (THHI) .279 3.590
SIZE .723 1.383
Attachments 5: Results of Assumpt ions Testing for M ultiple Regressions for Equation4
REFERENCES
ACHARYA, V. V., HASAN, I. & SAUNDERS, A. 2002. Should Banks be Diversified? Evidence From In-dividual Bank Loan Portfolios. Bank for Interna-tional Settlements
ALIJOYO, A., BOUMA, E., SUTAWINANGUN, T. M. N. & KUSADRIANTO, M. D. 2004. Corporate nance in Indonesia. Forum for Corporate Gover-nance Indonesia.
ALLEN, F. & CARLETTI, E. (eds.) 2008. The Roles of Banks in Financial Systems.
BANDYOPADHYAY, A. 2010. Understanding the Ef-fect of Concentration Risk in the Banks’ Credit Portfolio: Indian Cases. Munich Personal RePEc Archive.
BATUNANGGAR, S. 2002. Indonesia’s Banking Crisis Resolution: Lessons and The Way Forward. Bank of England.
BECK, T., DEMIRGUC-KUNT, A. & MARTINEZ-PERIA, M. S. 2011. Bank Financing for SMEs: Evidence Across Countries and Bank Ownership Types. Journal of Financial Services, 39, 35-54.
BERGER, A. N. & BLACK, L. K. 2011. Bank Size, Lending Technologies, and Small Business Finance. Jour-nal of Banking and Finance, 35, 724-735.
BERGER, A. N., CLARKE, G. R. G., CULL, R., KLAPPER, L. & UDELL, G. F. 2005a. Corporate Governance and Bank Performance: A Joint Analysis of the Static, Selection, and Dynamic Effects of Domes-tic, Foreign and State Ownership. World Bank Policy Research Paper, 3632.
BERGER, A. N., HASAN, I. & ZHOU, M. 2010. The Ef-fects of Focus versus Diversification on Bank Per-formance: Evidence from Chinese Banks. Journal of Banking & Finance, 34, 1417-1435.
BERGER, A. N., MILLER, N. H., PETERSEN, M. A. & RAJAN, R. G. S., JEREMY C. 2005b. Does Function follow organizational form? Evidence from the lending practices of large and small banks. Journal of Financial Economics, 76, 237-269.
BONIN, J. P., HASAN, I. & WACHTEL, P. 2005. Bank Performance, Efficiency and Ownership in Tran-sition Countries. Journal of Banking and Finance, 29,
31-53.
CRONJE, T. 2013. Bank Lending. Australia: McGraw Hill.
DE-HAAS, R., FERREIRA, D. & TACI, A. 2010. What Determines the Composition of Bank’s Loan Port-folios? Evidence From Transition Countries. Jour-nal of Banking and Finance.
DEGRYSE, H., HA VRYLCHYK, O., JURZ YK, E. & KOZAK, S. 2012. Foreign Bank Entry, Credit Allo-cation and Lending Rates in Emerging Markets: Empirical Evidence from Poland. Journal of Bank-ing and Finance, 36, 2949-2959.
DELL’ ARICCIA, G. & MARQUEZ, R. 2004. Information and Bank Credit Allocation. Journal of Financial Economics, 72, 185-214.
DELL’ARICCIA, G. & MARQUEZ, R. 2004. Information and bank credit allocation. Journal of Financial Eco-nomics, 72, 185-214.
DETRAGIACHE, E., TRESSEL, T. & GOOPTA, P. 2008. Foreign Bank in Poor Countries: Theory and Evi-dence. The Journal of Finance, LXIII, 2123-2160.
DEUTSCHE BUNDESBANK 2006. Concentration risk in Credit Portfolios. DEUTSCHE BUNDESBANK.
DIAMOND, D. W. 1984. Financial Intermediation and Delegated Monitoring. Review of Economic Studies, 51, 393-414.
DIETSCH, M. & PETEY, J. 2009. Sector concentration risk in SME credit portfolios:A multifactor approach. France: Université de Strasbourg
DINC, I. S. 2005. Politicians and Banks: Political Influ-ences on Government-Owned Banks in Emerging Markets. Journal of Financial Economics, 77, 453-479.
DÜLLMANN, K. & MASSCHELEIN, N. 2006. Sector con-centration in loan portfolios and economic capital
Deutsche Bundesbank.
GIANNETTI, M. & ONGENA, S. 2005. Financial Integra-tion and Entrepreneurial Activity: Evidence From Foreign Bank Entry in Emerging Markets. ECB Working Paper Series.
GOELTOM, M. S. 2005. Indonesia’s Banking Industry: Progress to Date. Country Paper for BIS Deputy Gov-ernor Meeting. Bank for International Settlement.
Risk Management in Indonesian Banking: A Malmquist Approach. Applied Financial Econom-ics, 21, 847-861.
HAMMES, W. & SHAPIRO, M. 2001. The Implications of the New Capital Adequacy Rules for Portfolio Management of Credit Assets. Journal of Banking and Finance, 25, 97-114.
HARADA, K. & ITO, T. 2006. Rebuilding the Indonesian Banking Sector- Economic Analysis of Bank Con-solidation and Efficiency. JBICI Review, 12, 32-59.
HAW, I. M., H, S. S. M., H, B. & W, D. 2010. Concentrated Control, Institutions, and Banking Sector: An In-ternational Study. 34.
HAYDEN, E., PORATH, D. & VON WESTERNHAGEN, N. 2006. Does Diversification Improve the Perfor-mance of German Banks? Evidence From Indi-v idual Bank Lo an Po rtfo lio s. Deustche Bundesbank
IANNOTTA, G., NOCERA, G. & SIRONI, A. 2007. Own-ership Structure, Risk and Performance in the Eu-ropean Banking Industry. Journal of Banking & Fi-nance, 31, 2127-2149.
KAMEYAMA, T., SETIADHI, V. D., ALIJOYO, A. & BOUMA, E. 2005. Corporate Governance of Banks in Indonesia. PT UFJ Institution Indonesia
Forum Corporate Governance Indonesia.
KAMP, A., PFINGSTEN, A. & PORATH, D. 2005. Do banks diversify loan portfolios? A tentative an-swer based on individual bank loan portfolios. Deutsche Bundesbank.
LA-PORTA, R., LOPEZ-DE-SILANES, F. & SHLEIFER, A. 2002. Government Ownership of Banks. Jour-nal of Finance, LVII, 265-301.
LAEVEN, L. & LEVINE, R. 2007. Is There a Diversifica-tion Discount in Financial Conglomerates? Jour-nal of Financial Economics, 331-367.
LAEVEN, L. & LEVINE, R. 2009. Bank Governance, Regu-lation and Risk Taking. Journal of Financial Eco-nomics, 259-275.
MAGALHAES, R., URTIAGA, M. G. & TRIBO, J. A. 2010. Banks’ Ownership Structure, Risk and Perfor-mance.
MARKOWITZ, H. 1952. Portfolio Selection. The Journal of Finance 7, 77-91.
MIAN, A. 2003. Foreign, Private Domestic, and Govern-ment Banks: New Evidence from Emerging Mar-kets.
MIAN, A. 2006. Distance Constraints: The Limits of For-eign Lending in Poor Economies. The Journal of Finance, LXI, 1465-1505.
MICCO, A. & PANIZZA, U. 2006. Bank Ownership and Lending Behavior. Economics Letters.
MICCO, A., PANIZZA, U. & Y, M. 2007. Bank Owner-ship and Performance: Does Politics Matter? Jour-nal of Banking and Finance, 219-241.
MONTGOMERY, H. 2003. The Role of Foreign Banking in Post Crisis Asia: The Importance of Method of Entry. ADB Institute Research Paper.
PANGESTU, M. 2003. The Indonesian Bank Crisis and Restructuring: Lessons and Implications for other Developing Countries. G-24 Discussion Paper Se-ries. New York and Geneva: United Nations
PATRICK, H. 2001. Corporate Governance and The In-donesian Financial System: A Comparative Per-spective.
ROSSI, S. P. S., SCHWAIGER, M. S. & WINKLER, G. 2009. How Loan Portfolio Diversification Affects Risk, Efficiency and Capitalization: A Managerial Be-havior Model for Austrian Banks. Journal of Bank-ing and Finance, 33, 2218-2226.
SAPIENZA, P. 2004. The Effects of Government Owner-ship on Bank Lending. Journal of Financial Econom-ics, 357-384.
SATHYE, M., BARTLE, J., VINCENT, M. & BOFFEY, R. 2003. Credit Analysis and Lending Management. Australia: John Wiley & Sons
STEIN, J. 2002. Information Production and Capital Al-location: Decentralized versus Hierarchical Firms. Journal of Finance, LVII.
TABACHNICK, B. G. & FIDELL, L. S. 2007. Using Multi-variate Statistics. Fifth Edition ed. United States of America: Pearson Education Inc.
Bra-zilian Banks’ Return and Risk. Journal of Banking and Finance, 35, 3065-3076.
TABOADA, A. G. 2011. The Impact of Changes in Bank Ownership Structure on The Allocation of Capi-tal: International Evidence. Journal of Banking and Finance, 35, 2528-2543.
TANDELILIN, E., KAARO, H. & MAHADWARTHA, P. A. 2007. Corporate Governance, Risk Management, and Bank Performance: Does Type of Ownership Matter?. EADN W orking Paper. East Asia Develop-ment Network.
UNITE, A. A. & SULLIVAN, M. J. 2003. The Effect of For-eign Entry and Ownership Structure on the Phil-ippine Domestic Banking Market. Journal of Bank-ing and Finance, 27, 2323-2345.