The Behavior of Indonesian Stock Market:
Structural Breaks and Nonlinearity
Rahmat Heru Setianto
Department of Management Faculty of Economics and Business, Universitas Airlangga, Indonesia
Turkhan Ali Abdul Manap
Department of Economics, Kulliyyah of Economics and Management Sciences, International Islamic University, Malaysia
Gadjah Mada International Journal of Business
Vol. 13, No. 3 (September - December 2011): 209 - 226
Abstract: This study empirically examines the behaviour of Indonesian stock market under the efficient market hypothesis framework by emphasizing on the random walk behaviour and nonlinearity over the period of April 1983 - December 2010. In the first step, the standard linear unit root test, namely the augmented Dickey-Fuller (ADF) test, Phillip-Perron (PP) test and Kwiatkowski-Philllips-Schmidt-Shin (KPSS) test identify the random walk behaviour in the indices. In order to take account the possible breaks in the index series Zivot and Adrews (1992) one break and Lumsdaine and Papell (1997) two breaks unit root test are employed to observe whether the presence of breaks in the data series will prevent the stocks from randomly pricing or vice versa. In the third step, we employ Harvey et al. (2008) test to examine the presence of nonlinear behaviour in Indonesian stock indices. The evidence of nonlin-ear behaviour in the indices, motivate us to use nonlinnonlin-ear unit root test procedure recently developed by Kapetanios et al. (2003) and Kruse (2010). In general, the results from standard linear unit root test, Zivot and Adrews (ZA) test and Lumsdaine and Papell (LP) test provide evidence that Jakarta Composite Index characterized by a unit root. In addition, structural breaks identified by ZA and LP test are corre-sponded to the events of financial market liberalization and financial crisis. The nonlinear unit root test procedure fail to rejects the null hypothesis of unit root for all indices, suggesting that Jakarta Composite Index characterized by random walk process supporting the theory of efficient market hypothesis.
prosedur tes nonlinear unit root yang dikembangkan oleh Kapetanios et al. (2003) dan Kruse (2010). Secara umum, hasil dari uji unit root yang standar dan linier, Zivot dan Adrews (ZA) dan Lumsdaine dan Papell (LP) menunjukkan bahwa IHSG memiliki perilaku pergerakan harga yang acak. Selain itu, adanya patahan struktural diidentifikasi oleh uji ZA dan LP yang berhubungan dengan peristiwa liberalisasi pasar keuangan dan krisis keuangan. Prosedur uji unit root nonlinier gagal untuk menolak nul hipotesis unit root untuk semua indeks, menunjukkan bahwa IHSG ditandai oleh proses random walk mendukung teori hipotesis pasar efisien.
Keywords: linearity and non-linearity; smooth transition autoregressive (STAR) models; stock
Introduction
Financial markets such as bond and stock markets plays important role in promot-ing economic efficiency and economic growth by channeling funds from people who do not have a productive use to those who need funds for productive investment. Equally important is the information efficiency of the financial market. Market efficiency is essen-tial because it helps to explain why asset prices change in financial markets and how these changes take place. More precisely, ef-ficient market implies that 1) one investment is as good as any other because the securi-ties’ prices are correct; 2) a security’s price reflects all available information about the intrinsic value of the security; 3) security prices can be used by managers of both fi-nancial and nonfifi-nancial firms to assess their cost of capital (cost of financing their invest-ments) accurately and hence that security prices can be used to help them make the correct decisions about whether a specific investment is worth making or not (Mishkin 2004). Thus market efficiency is indisputably desirable for market development and eco-nomic growth as a whole.
In an efficient market, changes of stock prices are influenced by different types of information. Fama (1970) distinguishes three versions of market efficiency depending on the underlying information set that is avail-able to market participants: weak form, semi-strong form and semi-strong form. Markets are said to be weak form efficient if the current stock prices fully reflect information contained in the past realizations of the price. In an effi-cient market, stock prices only response un-predictable news, news are random, thus stock price changes should be also unpredict-able and random and one cannot earn abnor-mal returns on the basis of historical
infor-mation on prices and trading volumes. Stock prices are characterized by a unit root if stock prices follow a random walk. Thus, testing for a unit root in stock prices is one way to validate the weak form efficiency hypothesis. Over the years, there has been a large body of empirical research concerning the validity of the efficient market hypothesis with respect to stock markets in both devel-oped and developing countries. Empirical research on testing the random walk hypoth-esis has produced mixed results. For instance, Fama and French (1988), Lo and MacKinlay (1988); Poterba and Summers (1988); Urrutia (1995); Grieb and Reyes (1999); Chaudhuri and Wu (2003); Shively (2003); Narayan (2008) have found that stock indexes are not characterized by a unit root. In contrast, oth-ers studies have found stock prices are char-acterized by a unit root process. For instance, Hubber (1997); Lee (1992); Ozdemir (2008); Narayan (2005); Narayan and Smyth (2005); Qiant et al. (2008).
pre-dictability or rejection of the random walk hypothesis in stock returns [e.g., (Huang 1995); (Poshakwale 1996); (Mobarek and Keasey 2002); (Khaled and Islam 2005)].
Considering the theoretical and practi-cal significance, the testable implications and conflicting empirical evidence of the random walk hypothesis motivates us to have a fresh look at this issue of weak-form efficiency in the context of an emerging market, namely Indonesian stock market. This study is po-tentially interesting case study for a develop-ing capital market, which shares most of the characteristics of a typical emerging market. Secondly, the liberation of financial market and advance on technology, these markets become more integrated with global equity markets, which attracting more international investors in the hope to benefit from higher abnormal returns and portfolio diversifica-tion, where market efficiency has important implications for those investors. Thirdly, the majority of previous studies apply the tradi-tional unit root test in testing the null hypoth-esis of a unit root in stock prices. It is well known that the tradition test may bias in not rejecting the null hypothesis in the presence of structure breaks (Perron 1989). Chauduri and Wu (2003), Narayan and Smyth, (2004), Narayan (2005), Lean and Smyth (2007), Narayan (2008); Lee et al. (2010) investigate the stationarity properties using the new unit test with structure breaks for other markets. Furthermore, economic theory suggests that the behavior of stock prices may exhibit nonlinear pattern in the series due to trans-action costs and market frictions, heteroge-neity of agent’s investment objectives, and
diversity in agent beliefs (Hasavov 2009).1
Therefore the reliability of the finding from existing studies assuming linearity in the time series is questionable. To this end, some re-searcher then adopt to Narayan (2005); Munir and Mansur (2009) investigate the random walk hypothesis in the stock market by adopt-ing nonlinear threshold autoregressive (TAR) model of Caner and Hansen (2001). Further-more, Hasanove and Omay (2007) and Hasanov (2009) are among the studies that examine the random walk hypothesis by adopting nonlinear unit root test procedure proposed by Kapetanios et al. (2003).
As far as Indonesian stock is concerned, limited empirical studies are available yet the results are mixed. While Huang (1995), Huang and Yang (1995), Groenwold and Ariff (1998) Karemera et al. (1999) find the Indonesian stock weak-form efficient, Magnusson and Higgs (2005), Fuss (2005), Kim and Shamsuddin (2006), Hoque et al. (2006) and Zulfadin (2008) find that the market is weak-form inefficiency. Given Indonesian has gone through financial liberation, and financial cri-sis that may cause structural breaks. Previ-ous studies did not take structure breaks into consideration. Furthermore, previous studies are based on the assumption of linear data generating process. Therefore the reliability of the finding from existing studies is ques-tionable.
Thus, this paper attempts to overcome the above mentioned problems and contrib-utes to the existing literature on the Indone-sian stock market efficiency by taking both structural breaks and the nonlinearity into consideration. More specifically, this paper contributes to exiting literature on random walk hypothesis for Indonesian stock market
1 See, Brock and Lebaron (1996), Brock and Hommes (1998), Peters (1994), Guillaume et al. (1995), Dumas
in four novel ways. Firstly, in addition to the conventional unit root test, the Zivot and Andrew (1992) one break and the Lumsdaine and Papell (1997) two-break unit root tests
are used. Secondly, we employ the powerful
lin-earity test proposed by Harvey et al. (2008) which is applicable when the order of inte-gration of the time series under investigation is uncertain. It reveals that the Indonesian Stock index is nonlinear process in which al-low us to question the validity of linear unit
root test. Thirdly, we use nonlinear STAR unit
root test developed by Kapetanios et al. (2003) and Kruse (2010) which allows for testing unit root behavior in a more general nonlinear framework where the transition between regimes occurs in a smooth manner,
rather than instantaneously. Finally, we also
estimate the speed of transition parameter. The estimated ESTAR model indicates that the Indonesian stock market is not mean re-version process.
The rest of the study is organized as follows: Section two briefly describe about the methodology employed in the study. Data on which analysis is based is then presented in Section 3. Section 4 in turns discusses the empirical results and some implications of the study. Finally, Section 5 concludes the study.
Methodology
Unit Root Test With One
Structural Break
According to Perron (1989), if struc-tural break exist, the power to reject a unit root decreases when the stationary alterna-tive is true and the structural break is ignored.
Therefore, Perron (1989) then developed three alternative models, which accommo-date a break in the trend function, namely: a) The crash model, which allows for a one time structural break in the intercept of the trend function; b) The changing growth model, which allows for a structural break in the slope; c) The crash-cum-growth model, which allows for a structural break in the intercept and slope.
However, Zivot and Andrews (1992) have argued that selecting the break point a priori based on ex post examination or knowl-edge of the data, as developed by Perron (1989) could lead to an over rejection of the unit root hypothesis. Hence, to avoid spuri-ous results the break date is also treated as being endogenous. To this end, Zivot and Andrews (1992) developed two versions of the sequential trend break model to investi-gate the unit root hypothesis, as follows: Model A:
Model C:
The null hypothesis for model 1 and 2
is that = 0, which implies there is a unit
root in Yt, against the alternative hypothesis
< 0, which implies that Yt is breakpoint
stationary. Where DUt is an indicator dummy
variable for a mean shifting occurring at time TB, while DT is the corresponding trend shift variable, where:
Yt=0 +Yt-1 +t +DUt +
j=1kdjYt-j +t...(1)Yt=0 +Yt-1 +t +DUt +DTt +
and
Furthermore, to implement the sequen-tial trend break model, some region must be chosen such that the end points of the sample are not included. This is because in the pre-sence of the end points the asymptotic dis-tribution of the statistics diverges to infinity. Zivot and Andrews (1992) suggest the trim-ming region be specified as (0.15T, 0.85T), which is followed here. Thus, the break points are selected by choosing the value of TB for which the ADF t-statistic is maximized.
Unit Root Test
with Two Structural Breaks
A possible problem with the Zivot and Andrews (1992) test is the loss of power if there are two structural breaks in the series. In response to this condition, Lumsdaine and Papell (1997) proposed the extension of Zivot and Andrews (1992) model A and C to allow for two structural breaks. Lumsdaine and Papell (1997) then call these models AA and CC respectively. Model AA allows for two breaks in the intercept of the trend and model CC allows for two breaks in the inter-cept and slope of the trend. Model AA can be represented as follows:
Model CC takes the following form:
The null and alternative hypotheses are
the same as in the one break case. DU1t and
DU2t are indicator dummy variables for a
mean shift occurring at TB1 and TB2
respec-tively, where TB2 > TB1 + 2 and DT1t and
DT22 are the corresponding trend shift
vari-ables:
and
The same trimming region is used as in the case of model A and C. The critical values are calculated using the same methodology as in the case of model A and C.
Nonlinear Unit Root Test of
Kapetanios et al. (2003)
Consider a univariate smooth transition autoregressive (STAR) model of order one:
where yt is a mean zero stochastic process and eti.i.d. (0, 2), and and are unknown parameters. The transition function is as-sumed to be of the exponential form:
F(;yt-d)= 1 - exp(-y2
t-d)...(6)
Where it is assumed that and d 1is
the delay parameter. The exponential func-tion is bounded between zero and one, i.e.
F:R[0,1]has the properties F(0)= 0;
limxF(x)= 1and is symmetrically U-shaped
around zero. The parameter is slope
coeffi-cient and determines the speed of transac-tion between to regimes that correspond to extreme values of the transition function. Substituting (6) into (5) one obtains the fol-lowing exponential STAR (ESTAR) model:
yt= yt-1 +yt-1 [1-exp(-y2
property that it allows modeling different dynamics of series depending on the size of the deviations from the fundamental equilib-rium (Teräsvirta 1994; Michael et al. 1997).
The theory suggests that arbitrageurs shall not engage in reversion strategies if de-viations from the equilibrium are small in size (arbitrage is not profitable). If the deviations from equilibrium are large enough, however, arbitrageurs shall engage in profitable rever-sion trading strategies, and thus bring the prices to their equilibrium levels. In the con-text of ESTAR model, this would imply that
while is possible, one must have < 0
and for the process to be globally
stationary. Under these conditions, the pro-cess might display unit root for small values of y2
t-d, but for larger values of, it has stable
dynamics, and as a result, is geometrically ergodic. Furthermore, the speed of mean re-version increases with the size of deviation from the fundamental equilibrium.
Following the practice in the literature (Balke and Fomby 1997 in the context of TAR models and Michael et al 1997 in the context of ESTAR models), Kapetanios et al. (2003) further impose, implying that fol-lows a unit root in the middle regime. The reason is that, in some economic contexts it is reasonable to assume that the variable dis-plays a mean reverting behavior towards an attractor when it is sufficiently far away from it, but a random walk representation in the neighborhood of the attractor. In this case, the ESTAR model can be written as:
yt= yt-1 [1-exp(-y2
t-d)]+t ...(9)
The global stationarity of the process can be established by testing the null hypoth-esis H0 : = 0 against the alternative H0 : >
1. However, testing the null hypothesis
di-rectly is not feasible since the parameter is not identified under the null. To overcome this problem, Kapetanios et al. (2003) fol-low suggestion of Luukkonen et al. (1988) to replace the transition function by its
ap-propriate Taylor approximation to derive a t
-type test statistic. Replacing the transition function with its first order Taylor approxi-mation yields the following auxiliary regres-sion:
where et comprises original shocks t as well
as the error term resulting from Taylor
ap-yt= y3
proximation. The test statistic for = 0
against < 0 is obtained as follows:
where,
= the OLS estimate, and
s.e.()= the standard error of .
The asymptotic distribution of this test tNL is
non-standard and KSS (2003) derive it and provide asymptotic critical values.
To accommodate stochastic processes with nonzero means and/or linear determin-istic trends, the following modifications are needed. In the case where the data has
non-zero mean, i.e., xt = + yt, one must replace
the raw data with de-meaned data yt =xt - x
where x is the sample mean. In the case where
the data has a nonzero mean and a nonzero
linear trend, i.e., xt = + t + yt, one must
instead use the de-meaned and de-trended
data yt = xtt where and are
ordi-nary least square (OLS) estimators of and
. If errors in (10) are serially correlated, one may augment (9) and (10) into following:
In practice, the number of
augmenta-tions p and the delay parameter d must be
selected prior to the test. Kapetanios et al. (2003) propose that standard model selection criteria or significance testing procedure be used for selecting the number of
augmenta-tions p. They also suggest that the delay
pa-rameter d be chosen to maximize goodness
of fit over d - {1,2,...dmax}. However, in
prac-tice, d is set to be one, see for example, Kapetanios et al. (2003) and Daiki (2005, 2006).
However, Kapetanios et al. (2003) test
assumes that the location parameter c in the
smooth transition function is equal to zero. According to Kruse (2010) when relaxing this assumption, we are faced with a nonstand-ard testing problem. Since standnonstand-ard inference
c techniques are not appropriate in this
situa-tion, Kruse (2010) then proposed new ap-proach to allow for a non-zero location pa-rameter c in the exponential transition func-tion. Following Kapetanios et al. (2003), Kruse (2010) applies a first order Taylor
ap-proximation to G[yt;,c=(1-exp{-(yt-1 - c]2})
test, hence we proceed with:
Dyt = b1y3
t-1 + b2y2t-1 + ut ...(15)
where 1= and 2= 2c. Kruse (2010)
interested in the pair of hypotheses given by
H0: = 0 against H1: > 0. In the regression
(15), this pair of hypothesis is equivalent to
H0: 1 = 1 = 0 against H1: 1 < 0, 2 0.
Note that the two-sidedness of 2 under H1
stems from the fact that c is allowed to take real values. This testing problem is nonstand-ard in the sense that one parameter is one
sided under H1 while the other is two-sided.
0, the one-sidedness under H1is achieved by the multiplied indicator function.
Data Description
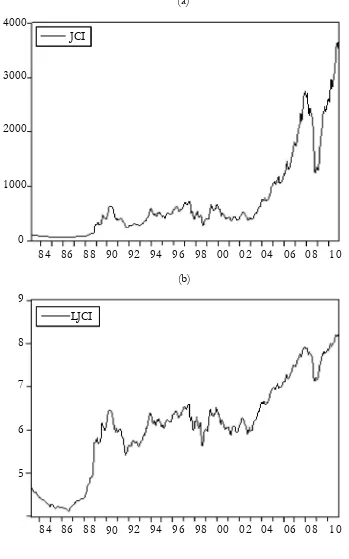
This study employs monthly Jakarta Composite index (JCI) over the period April 1983 to December 2010. The index is taken from Bloomberg database through a subscrip-tion by the Kulliyyah of Economics and Management Sciences, International Islamic University Malaysia. Specifically we retrieve the closing prices of the last trading days of all months and transformed into natural loga-rithm.
Empirical Results and
Discussion
Standard Linear Unit Root Test
Results
As preliminary step, the traditional unit root test such as ADF (Dickey and Fuller 1981), Phillip Perron and Kwiatkowski et al. (KPSS 1992) tests are employed, (see Table 1) indicates that the traditional unit-root tests provide no evidence of trend stationary, fail-ing to reject the unit-root null at conventional significance levels. However, we find evi-dence that this variable is stationary when expressed in the first difference. Accordingly, JCI series seem to be integrated of order 1, or I (1). Hence, we can conclude that Jakarta Composite Index series behave according to random stochastic process.
able test. In a nutshell, the one-sided param-eter is orthogonalized with respect to the two sided one. The modified Wald test builds upon
the one-sided parameter (1) and the
trans-formed two-sided parameter, say , that are
stochastically independent by definition. Let the parameter vector of the
regres-sion model (15) be = [12]’. Following the
notation of Abadir and Distaso (2007), the null hypothesis of a unit root is written as:
The alternative hypothesis of a globally stationary ESTAR model is given by:
H1 : h1 ()<0 or h2 ()
which includes the subset hypothesis
H1:h dard Wald test statistic based on the Hessian matrix. Hence, now we have the new test sta-tistic for the unit root hypothesis against glo-bally stationary ESTAR. A simpler and more intuitive way to formulate the statistic is:
The two summands appearing in the test
statistic can be interpreted as follows: the
first term is a squared t-statistic for the
hy-pothesis 1 - 1v21/v11with being
or-thogonal to 1. Additionally, the second term
is a squared t-statistic for the hypothesis 1=
1
Figure 1. Plot of Monthly Closing Price of the Jakarta Composite Index and Its
Transformation (April 1983-December 2010)
84 86 88 90 92 94 96 98 00 02 04 06 08 10 0
1000 2000 3000 4000
JCI
(a)
LJCI
(b)
86 88 90 92 94 96 98 00 02 04 06 08 10 4
5 6 7 8 9
Zivot and Andrews (1992) One
Structural Break Test
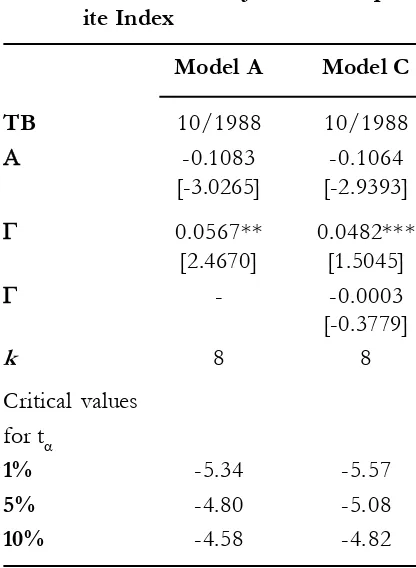
Table 2 reports the Zivot and Andrews (ZA) test results for Jakarta Composite In-dex. Table 2 clearly reveals that the null of unit root hypothesis still cannot be rejected for series of Jakarta Composite Index even after the structural breaks is allowed. It can be identified from the estimated test
statis-tics of (-3.0265) which is greater than ZA
critical value for all significance level. While for model C also indicating the same results,
where the test statistics of coefficient
(-2.9393) is greater than ZA critical value, fail to reject null hypothesis of non-stationary.
Furthermore, from the estimated
coef-ficient of inmodel A the break in the
inter-cept is found to be statistically significant at the 5 percent level (based on critical value from the standard normal distribution). While for model C it is found that estimated
coeffi-cient of is statistically significant at 10
per-cent level, implying the Jakarta Composite Index series exist at least one structural break in the intercept. The break date provided by model A and C is during October 1988. Pe-riod of 1987-1988 is corresponds to the is-suance of PAKDES (December Package) 87 to give ways for companies to go public and foreign investors to invest their money in In-donesia. Furthermore, in December 1988, the government issued PAKDES 88 to
encour-Table 1. Linear Unit Root Test on Jakarta Composite Index
Series ADF PP KPSS
No Trend Trend No Trend Trend No Trend Trend
lnJCI -0.3485 -2.1430 -0.2529 -2.0568 1.7791* 0.1744**
lnJCI -14.8831* -14.8809* -14.8975* -14.8809* 0.0929 0.0687
Note: *, and ** denote significance at 1% and 5% level respectively
Table 2. Unit Root Test with One
Struc-tural Break on Jakarta Compos-ite Index
Notes: The optimum lag length k is selected according to Schwarz Information Criteria (SIC). Model A refers to structural break in the intercept only
Yt= k + Yt-1 +t+DUt +
=1djYt-1 +t, and model C refers to structural breaks both in the intercept and slope of the trend function Yt=k+Yt-1 +t +DTt
+DU2t +DT2t+DT2t
1djYt-j +t. Number in parentheses are t -sta-tistics. *,** and *** denote significance at 1 per-cent, 5 percent and 10percent level respectively.
k
j
age companies go public and some other regu-lations that brought positive impacts on the capital market growth.
Lumsdaine and Papell (1997) Two
Structural Breaks Test
We now consider the case in which the series assumed to contain two structural breaks, with the break point determined en-dogenously. We estimate model AA and CC
and compute the t-statistic for testing the
level of significant for each parameter. Table
3 presents the test results, with t-ratios
ex-hibited in parentheses. Several observations can be drawn from Table 3.
Model AA in the Table 3 provides strong evidence that by allowing for two structural breaks it is still not possible to re-ject the unit root null hypothesis, indicated from the statistical value of the estimated
coefficient (-4.0574) which is greater than
LP critical value at all significant level. While, the results obtained from model CC indicate that Jakarta Composite Index is characterized by unit root process, it can be seen from the
statistical value of (-5.1812) which is
greater than critical value of LP test for all significant level. These results support the ex-istence of random walk process in the Jakarta Composite Index.
In addition, according to model AA the
estimated coefficient of and are
statisti-cally significant at 1 percent level (based on critical value from the standard normal dis-tribution), implying that in the stock price series there exist at least two structural breaks in trend. While according to model CC, we found that first break in the slope is statisti-cally significant at 1 percent, this results
in-dicated from the statistical value of
(4.9237). For the second break, we have nificant break in the slope at 5 percent
sig-nificant level and break in the intercept at 1 percent level of significant, as indicated from
the statistical value of (2.5550) for break
in the slope and statistical value (4.6856)
for break in the intercept.
Table 3. Unit Root Test with Two
Struc-tural Break on Jakarta Compos-ite Index
Critical values for t
1% -6.94 -7.34
5% -6.24 -6.82
10% -5.96 -6.49
Notes: The optimum lag length k is selected according to Schwarz Information Criteria (SIC). Model A refers to structural break in the intercept only Yt= k + Y
t-1 +t+DUt +DUt +
=1djYt-1 +tandmodel CC refers to structural breaks both in the inter-cept and slope of the trend function Yt=k+Yt-1
+t +DUt +DTt +DU2t +DT2t
1djYt-j +t. Number in parentheses are t-statistics. *,** and *** denote significance at 1 percent, 5 percent and 10 percent level respectively.
k j
Furthermore, the statistically significant structural break in the model AA is happened during October 1988 and August 2004, while for model CC is happened during August 1988 and January 2000. As discussed in the Zivot and Andrews (1992) model, the first struc-tural break for model AA and CC for JCI se-ries is October 1988 and August 1988, cor-responds to some important policies made by Indonesian stock market authorities. PAKTO (October Package) 88 designed for the bank-ing sector, but havbank-ing an impact on the de-velopment of capital markets. PAKTO 88 contains provisions on 3 L (Legal, Lending, Limit), and the imposition of tax on deposit interest. The imposition of this tax had a positive impact on the development of capi-tal markets. Because with the release of this policy means the government gives equal treatment between the banking sector and capital market sectors. Followed by the issu-ance of PAKDES 88, this package basically gives further impetus to the capital market by opening opportunities for the private sec-tor to hold the stock. Prior to these two poli-cies, on June 1988 Indonesia Pararel Bourse started to operate and managed by the secu-rities and money trading organization, it con-sisted of brokers and dealers. Because these three policies Indonesian stock market be-came active capital markets for the period 1988 to the present. On the other hands, during October 1987 stock market around the world crashed, shedding a huge value in a very short time. Major indexes of market valua-tion in the United States dropped 30 percent
or more. This was the greatest loss Wall Street
had ever suffered on a single day.2
The second break for model CC is Janu-ary 2000, where during 2000 Indonesian stock market experienced a negative trend, due to the political and economic instability after general election on the late of 1999. The negative trend was ended after 2003-2004 period as indicated from the second break of model AA which is happened on August 2004. As we can see from the plot graph in the Appendix, starting from this period Jakarta composite index went up continued until the end of 2007 where the global finan-cial crisis started to attack Indonesian capi-tal market.
Linearity Test
Before we perform the nonlinear unit test, we investigate whether we can reject the linear autoregressive model in favor of non-linear model. The existing tests of the null of linearity against a nonlinearity alternative in the literature such proposed by Luukkonen et al. (1998), Granger and Teräsvirta (1993) and Teräsvirta (1994), however, rely on an assumption of I(0) behavior in the underly-ing series. In this study, we employ linearity test newly developed by Harvey et al. (2008).
This test, the W test, does not require an a
priori assumption as to the order of integra-tion of the process. Using this test, we
ob-tain W0.7.24 which is significant at the 5
percent level suggesting that the linearity is rejected.
Nonlinear unit root test of
Kapetanios et al. (2003)
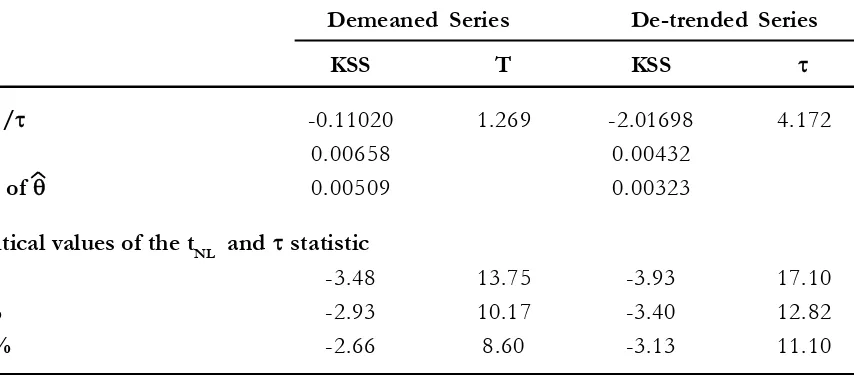
Having established the evidence of nonlinearity based on the Harvey et al. (2008) test, we use the test of Kapetanios et al. (2003) as well as Kruse (2010) where the null of a linear unit root process is tested against the alternative of a globally stationary non-linear ESTAR model. The estimated results of nonlinear unit root test base on equation (13) and (18) for Jakarta Composite Index are presented in Table 4. Table 4 reveals, the null hypothesis of unit root could not be rejected for both demeaned and de-trended series,
in-dicated from the value of tNL which is greater
than tNL critical value for all significance level.
In line with the results form KSS test, the Kruse (2010) test also cannot reject the null
hypothesis of unit root giving the value of
test which is less than their critical value. In addition, the estimates of transition
param-eters for both series are also insignificant,
indicating that no mean reversion for the se-ries under consideration. This is an expected
result since under the null hypothesis that =
0, the series follow a unit root.
Conclusions
This study investigates the behavior of Indonesian stock market using various sta-tistical tools. The results from the conven-tional unit root test with and without struc-tural breaks indicate that the stock market is characterized by a unit root process. Further nonlinear test revealed that the Indonesian stock market prices follow nonlinear dynamic process. An application of the recent nonlin-ear unit test of KSS (2003) and Kruse (2010) both indicate that Indonesian stock market prices are consistently characterized by ran-dom walk behavior in line with the efficient market hypothesis. Furthermore, we also find that Indonesian stock market exhibit signifi-cant structural breaks.
Our finding has important implications to both academician and investment practi-tioners. Given the evidence that Indonesian
Table 4. Nonlinear Unit Root Test on Jakarta Composite Index
Demeaned Series De-trended Series
KSS T KSS
tNL / -0.11020 1.269 -2.01698 4.172
0.00658 0.00432
SE of 0.00509 0.00323
Critical values of the tNL and statistic
1% -3.48 13.75 -3.93 17.10
5% -2.93 10.17 -3.40 12.82
10% -2.66 8.60 -3.13 11.10
stock market are characterized by nonlinear dynamic process and experienced significant structural breaks, any results from previous or future without taking structure breaks or nonlinearity may lead to an inappropriate
conclusions. For investors, our findings indi-cates that both foreign and domestic inves-tors could, when making their investment decisions, consider an asset price to reflect its true fundamental value at all times.
References
Abadir, K. M., and W. Distaso. 2007. Testing joint hypotheses when one of the alternatives is one-sided.
Journal of Economic 140: 695–718.
Abrosimova, N., G. Dissanaike, and D. Linowski. 2005. Testing the weak-form efficiency of the Russian Stock Market. Social Science Research Network (SSRN) Working Paper. http://papers.ssrn.com/ sol3/ papers.cfm?abstract_id=302287.
Balke, N. S., and T. B. Fomby. 1997. Threshold Cointegration. International Economic Review 38 (3): 627-45. Brock, W. A., and B. D. LeBaron. 1996. A dynamic structural model for stock return volatility and trading
volume. The Review of Economics and Statistics 78 (1) (February): 94-110. MIT Press.
Brock, W. A., and C. H. Hommes. 1998. Heterogeneous beliefs and routes to chaos in a simple asset pricing model. Journal of Economic Dynamics and Control 22: 1235–74.
Caner, M., and B. E. Hansen. 2001. Threshold Auto regression with a Unit Root. Econometrica, Econometric Society 69 (6) (November): 1555-1596.
Chaudhuri, K., and Y. Wu. 2003. Random walk versus breaking trend in stock prices: evidence from emerging markets. Journal of Banking and Finance 27: 575–92.
Daiki, M. 2005. The term structure of interest rates with nonlinear adjustment: Evidence from a unit root test in the nonlinear STAR framework. Economicsbulletin 5: 1-7.
Daiki, M. 2006. Non-linear adjustment in the term structure of interest rates: a cointegration analysis in the non-linear STAR framework. Applied FinancialEconomics 11: 1301-1307.
Dickey, D., and W. Fuller. 1979. Distribution of the estimators for autoregressive time series with a unit root. Journal of the American Statistical Association 74: 427–431.
Dumas, B. 1992. Dynamic equilibrium and the real exchange rate in a spatially separated world. Review of Financial Studies 5: 153–180.
Fama, E. F. 1970. Efficient capital markets: a review of theory and empirical work. Journal of Finance 25: 383–417.
Fama, E. F. 1995. Random walks in stock market prices. Finance Analyste Journal 21: 55-59. http:// www.jstor.org/stable/4469865.
Fama, E. F., and K. R. French. 1988. Permanent and temporary components of stock prices. Journal of PoliticalEconomy 96 (2) (April): 246-273.
Grieb, T. A., and M. G. Reyes. 1999. Random walk tests for Latin American equity indexes and individual firms. Journal of Financial Research 22: 371–83.
Groenewold, N., and M. Ariff. 1998. The Effects of de-regulation on share market efficiency in the Asia Pacific. International Economic Journal 12 (4): 23-47.
Harvey, D. I., S. J. Leybourne, and B. Xiao. 2008. A powerful test for linearity when the order of integra-tion is unknown. Studies in Nonlinear Dynamics and Econometrics 12 (2).
Hasanov, M. 2009. Is South Korea’s Stock Market efficient? Evidence from a nonlinear unit root test.
Applied Economics Letters 16: 163-167.
Hasanov, M., and T. Omay. 2007. Are the Transition Stock Markets Efficient? Evidence from Non-Linear Unit Root Tests. Central Bank Review. Central Bank of the Republic of Turkey.
Hong, H., and J. C. Stein. 1999. A unified theory of under reaction, momentum trading, and overreaction in asset markets. Journal of Finance 54: 2143–84.
Hoque, H. A. A. B., J. H. Kim, and C. S. Pyun. 2006. A Comparison of variance ratio tets of random walk: A case of Asian emerging markets. International Review of Economics and Finance.
Huang, B-N. 1995. Do Asian stock market prices follow random walks? Evidence from the variance ratio test. Applied Financial Economics 5: 251-6.
Huang, B. N., and C. W. Yang. 1995. The Fractal Structure in Multinational Stock Returns. Applied Economics Letters 2: 67-71.
Huber, P. 1997. Stock market returns in thin markets: evidence from the Vienna stock Exchange. Applied Financial Economics 7: 493-498.
Islam, A., and M. Khaled. 2005. Tests of weak-form efficiency of the Dhaka Stock Exchange. Journal of Business Finance and Accounting 32: 1613-1624.
Kapetanios, G., Y. Shin, and A. Snell. 2003. Testing for a unit root in the nonlinear STAR framework.
Journal of Econometrics 112: 359–79.
Karamera, D., K. Ojah, and J. A. Cole. 1999. Random walks and market efficiency tests: Evidence from emerging equity market. Review of Quantitative Finance and Accounting 13: 171-188.
Kim, J. H., and A. Shamsuddin. 2007. Are Asian Stock Markets efficient? Evidence from new multiple variance ratio tests. Journal of Empirical Finance 15: 518 – 532.
Kruse, R., 2010. A new unit root test against ESTAR based on a class of modified statistics. Statistical Papers. DOI: 10.1007/s00362-009-0204-1.
Kwiatkowski, D., P.C.B. Phillips, P. Schmidt, and Y. Shin. 1992. Testing the null hypothesis of stationarity against the alternative of a unit root: How sure are we that economic time series have a unit root?
Journal of Econometrics 54: 159 -178.
Lean, H. H., and R. Smyth. 2007. Do Asian Stock Markets follow a random walk? Evidence from LM unit root tests with one and two structural breaks. Review of Pacific Basin Financial Markets and Policies
10: 15-31.
Lee, C. C., J. D Lee, and C. C. Lee. 2010. Stock prices and the efficient market hypothesis: Evidence from a panel stationary test with structural breaks. Japan and the World Economy 22 (1) (January): 49-58. Lee, U. 1992. Do stock prices follow random walk? Some international evidence. International Review of
Lo, A. W., and A. C. MacKinlay. 1988. Stock market prices do not follow random walks: Evidence from a simple specification test. The Review of Financial Studies 1 (1): 41-66.
Luukkonen, R., P. Saikkonen, and T. Terasvirta. 1988. Testing linearity against smooth transition autoregressive models. Biometrika 75: 491–9.
Lumsdaine, R., and D. Papell. 1997. Multiple trend breaks and the unit-root hypothesis. Review of Economics and Statistics 79: 212–218.
MacKinnon, J. 1991. Critical values for cointegration tests. In: Engle R,Granger C. (eds) Long-Run Economic Relationships: Readings in Cointegration. Oxford University Press, Oxford: 267–276.
Michael, P., R. A. Nobay, and D. A. Peel. 1997. Transaction costs and nonlinear adjustment in real ex-change rates: an empirical investigation. Journal of Political Economy 105: 862–79.
Mishkin, F. S. 2004. The Economics of Money, Banking, and Financial Market (7th ed.). USA: The
Addison-Wesley series in economics.
Mobarek, A., and K. Keasey. 2002. Weak-form market efficiency of and emerging market: Evidence from Dhaka Stock Market of Bangladesh. E-document. Retrieved October 26, from: http:// www.bath.ac.uk/centers/ CDS/Enbs-papers/Mobarek_new.htm.
Moustafa, M. A. 2004. Testing the weak-form efûciency of the United Arab Emirates Stock Market.
International Journal of Business 9 (3).
Munir, Q., and K. Mansur. 2009. Is Malaysian Stock Market efficient? Evidence from threshold unit root tests. Economics Bulletin 29 (2): 1359-1370.
Narayan, P. K. 2005. Are the Australian and New Zealand stock prices nonlinear with a unit root? Applied Economics 37: 2161-2166.
Narayan, P. K. 2008. Do shocks to G7 stock prices have a permanent effect? Evidence from panel unit root tests with structural change. Mathematics and Computers in Simulation 77: 369-373.
Narayan, P. K., and R. Smyth. 2004. Is South Korea’s stock market efficient? Applied Economics Letters 11: 707-710.
Narayan, P. K., and R. Smyth. 2005. Exchange rates and stock prices in South Asia: Evidence from Granger causality tests. ICFAI Journal of Applied Finance 11: 31-37.
Nelmida., N., M. Annuar, and T. Hassan. 2009. The impact of new information regime on the Jakarta Stock Exchange. International Research Journal of Finance and Economics (3). ISSN 1450-2887.
Ojah, K., and D. Karemera. 1999. Random walk and market efficiency tests of Latin American emerging equity markets: A revisit. The Financial Review (34) (2): 57-72.
Ozdemir, Z. A. 2008. Efficient market hypothesis: evidence from a small open-economy. Applied Econom-ics 40: 633–641.
Perron, P. 1989. The great crash, the oil price shock and the unit root hypothesis. Econometrica 57: 1361– 401.
Peters, E. E. 1994. Fractal Market Analysis: Applying Chaos Theory to Investment and Economics. John Wiley and Sons.
Phillips, P. C.B., and P. Perron. 1988. Testing for a unit root in time series regression. Biometrika 75: 335-346.
Poterba, J. M., and L. H. Summers. 1988. Mean reversion in stock prices: Evidence and implications.
Journal of Financial Economics 22 (1): 27-59.
Qian, X. Y., F. T. Song, and W. X. Zhou. 2008. Nonlinear behaviour of the Chinese SSEC index with a unit root: Evidence from threshold unit root tests. Physica A (387): 503-510.
Shively, P. A. 2003. The nonlinear dynamics of stock prices. The Quarterly Review of Economics and Finance 43: 505–517.
Shleifer, A. 2000. Inefficient Markets. An Introduction to Behavioural Finance, Clarendon Lectures in Economics. Oxford: Oxford University Press.
TerSasvirta, T. 1994. Specifcation, estimation and evaluation of smooth transition autoregressive models.
Journal of the American Statistical Association 89: 208–218.
Urrutia, J. L. 1995. Test of random walk and market efficiency for Latin American emerging equity markets. Journal of Financial Research 18: 299-309.
Zivot, E., and D.W. K. Andrews. 1992. Further evidence on the great crash, the oil-price shock and the unit root hypothesis. Journal of Business and Economic Statistics 10: 251-70.