MONITORING URBAN LAND COVER/LAND USE CHANGE IN ALGIERS CITY USING
LANDSAT IMAGES (1987-2016)
Brahim Bouchachi, Yanfei Zhong∗
State Key Laboratory for Information Engineering in Surveying, Mapping and Remote Sensing, Wuhan University, Wuhan 430079, China
*Corresponding author, e-mail: [email protected]
Commission IV, WG IV/3 ICSDM 2017
KEYWORDS: Landsat Time Series, Monitoring, Urbanization, Support Vector Machine, Land Cover Change, Remote Sensing.
ABSTRACT:
Monitoring the Urban Land Cover / Land Use change detection is important as one of the main driving forces of environmental change because Urbanization is the biggest changes in form of Land, resulting in a decrease in cultivated areas. Using remote sensing ability to solve land resources problems. The purpose of this research is to map the urban areas at different times to monitor and predict possible urban changes, were studied the annual growth urban land during the last 29 years in Algiers City. Improving the productiveness of long-term training in land mapping, were have developed an approach by the following steps: 1) pre-processing for improvement of
image characteristics; 2)extract training sample candidates based on the developed methods; and 3) Derive maps and analyzed of
Algiers City on an annual basis from 1987 to 2016 using a Supervised Classifier Support Vector Machine (SVMs). Our result shows that the strategy of urban land followed in the region of Algiers City, developed areas mostly were extended to East, West, and South of Central Regions. The urban growth rate is linked with National Office of Statistics data. Future studies are required to understand the impact of urban rapid lands on social, economy and environmental sustainability, it will also close the gap in data of urbanism available, especially on the lack of reliable data, environmental and urban planning for each municipality in Algiers, develop experimental models to predict future land changes with statistically significant confidence.
∗
1. INTRODUCTION
Urban change, in particular, is an important issue of Urban development and the environment (Roberts et al., 2016). The main purpose of this research is to follow the land cover land use LC/LU especially the Urban Land and its influence of decreasing the agriculture. In this perspective, the mapping of the region not only provides the value of scientific research information pertaining to a group but also provides general information about government planners and decision-makers (Triantakonstantis et al., 2015), particularly in Urban Land. Using the satellites TM/ETM+/OLI images dated for 1987-2016 years respectively. Covers most Urban Land with many spectral bands that can be used to determine the soil-related debilitating areas in urban (Bauer et al., 2004). This approach is based on the study of the urban tissue that develops faster with an annual growth rate, which oversees the evaluation of urban change detectors in each municipality and control the speed of expansion. The rapid increase in urbanization in Algiers. And the changes in agricultural caused by the extreme use of urban expansion (Siciliano., 2012), mainly due to population growth between 1987 to 2016. As urbanization progresses rapidly, it is attractive more important to know its spatial and temporal dynamics for urban environment improvement (Shahtahmassebi et al., 2014).
The massive expansion of the population (Campante et al., 2012) which must meet in the past through a variety of facilities that do not have sufficient time to meet quality standards and consistency and sustainability, which was on the roads of unfinished buildings that lead to nowhere. A relatively short period of time, urbanization has emerged as a major environmental problem facing many parts of the land (Montgomery., 2008). Algiers needs to be updated, which was developed from the same independence, the launch of the Strategic Plan and the protection of the environment (Hadjri et al., 2004).
In order to define urban dynamics, various methods have been developed, including pixel-based classification (Wang et al., 2004), subpixel classification (Mitraka et al., 2015) Oriented approach (Hussain et al., 2013). And mechanical learning algorithms (Chrysoulakis et al., 2015). Urban expansion is one of the typical models of land use and land cover (LULC) change, which was very important for city planning, environmental management, land integration (Yin et al., 2011).
Predictive modeling of Land-use change can be used as an unambiguous to achieve the path that a particular region can take in the light of factors (Wu et al., 2006), it is also a tool for managing the organization and space in order to maintain an often unstable balance, which in the end may lead, if not saved, to disrupt regional dynamics. Modern technology innovations have resulted in remote sensing and geographic information systems and space modelling for a wide range of tools to be used in research to develop reliable maps of land use and Monitor changes over time (Yang et al., 2002), taking into account the temporal dimension and finally predict future analysis (Aussenac., 2000). All of these techniques and using them collectively enable us to provide concrete and measurable responses to land-use changes and determine participation in these process factors.
The analysis of cartography and land-use projections in 2020 confirms (Tewolde., 2011) the extension of the process in fact and is particularly aggravated by the creation of new Urban Centers for a coherent development policy for the city, which can reduce the effects of this phenomenon in the medium and
long term, which depends on the current dynamic assessment and forecasting future development (Marbà et al., 1996) in the region of Algiers . Two objectives are covered by this research 1) to assess the degree of change in land use based on the comparative analysis of the different satellite images available. We also identify the external factors that favor these spatial changes; 2) Evaluate the trajectory of the Algiers statistical offices in terms of land use for 29 years, which could show a further increase in the spread of urban sprawl to the detriment of agriculture. Entry into an unprecedented land crisis.
2. STUDY AREA AND DATA PREPROCESSING
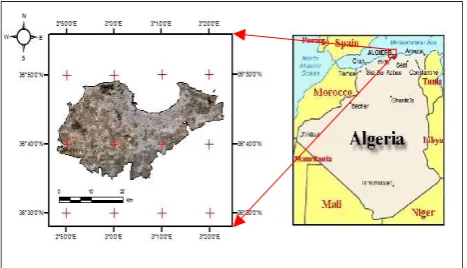
Algiers, the Capital of the Algeria, situated at Mediterranean Seaside in the north of Africa, with geographic coordinates of 36°42’N and 3°09’E as shown in Fig. 1, The winters are mild and wet while the summers are hot and dry. The average annual temperature is 21◦C.The rainfall is erratic from one year to another, with sometimes pronounced droughts. populated at
three million inhabitants and occupied 1190 km2 of the surface
(Bouhennache et al., 2014). In the last decade, the urban spaces have rapidly been growing especially of east, west, and south of Algiers City decreasing the cultivated spaces and Bare Field land. This increase indicates that urban areas are on the base of Algiers Municipality, which is rapidly expanding in a certain City. The state of the commune is ideal for urban areas with the rapid development of the study.
Figure 1. The Study Area of Algiers City in Northern Algeria.
Figure 2. The Temporal Distribution of the used Landsat TM /
Table 1. Spectral band specifications for Landsat sensors TM / ETM+ and OLI.
3. MATERIAL AND METHODS
The following multi-temporal remote sensing imageries and software had been used to extract Urban Land areas of Algiers. All Landsat images were:
Landsat Thematic Mapper (TM);
Landsat Enhanced Thematic Mapper Plus (ETM+);
Landsat 8 Operational Land Imager (OLI) and Thermal
Infrared Sensor (TIRS);
Shapefile download from (http://www.diva-gis.org/gdata);
ENVI 5.1 and ArcGIS10.4.1 (ESRI).
3.1. Methods
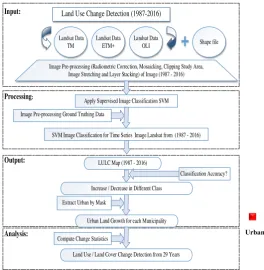
Figure 3 illustrates the framework of our study, we developed an approach through the following steps: 1) Image
pre-processing of the extraction of important properties. 2) extract
training sample candidates based on the developed methods; and 3) Derive maps and analyzed of Algiers City on an annual basis from 1987 to 2016 using a Supervised Classifier Support Vector Machine (SVMs) (Lin et al., 2011).
For the reason that our principal interests are to map an urban land trajectory, we identified four types of land covers, including Urban Land, Vegetation, Bare field, and Waterbody. the class of Urban land is defined as built environment with impervious surfaces (Li et al., 2015) dominated by man-made structures such as buildings and transportation/Communication/Utilities, Industrial, Commercial, Institutional, Mixed uses; The class of vegetation mainly includes areas that are covered with trees, forest plantation, grass, farmland, and orchard; the class of Bare Field includes exposed soil surfaces with little vegetation covers, such as deforested lands, abandoned farmlands, quarries, and naturally
unvegetated areas; and the class of water body includes areas of open water such as rivers and ponds (Allen et al., 2015). Post-classification comparison methods compare land-use classifications produced independently on different dates.
Land Use Change Detection (1987-2016)
Image Pre-processing (Radiometric Correction, Mosaicking, Clipping Study Area, Image Stretching and Layer Stacking) of Image (1987 - 2016) Landsat Data
SVM Image Classification for Time Series Image Landsat from (1987 - 2016)
LULC Map (1987 - 2016)
Increase / Decrease in Different Class
Extract Urban by Mask
Urban Land Growth for each Municipality
Input:
Processing:
Output:
Compute Change Statistics
Land Use / Land Cover Change Detection from 29 Years
Analysis:
Classification Accuracy?
Figure 3. The Overall Framework of the Study Processing and Analysis.
3.2. Classification
Support Vector Machine (SVM) classifier is a non-parametric supervised classification derived from statistical learning theory. SVM was developed in the late 1970s, but its popularity in Remote Sensing only began to increase about a decade ago (Zheng et al., 2015) Previous studies showed that SVM has the ability to generalize to unseen data with a small training dataset (Zheng et al., 2015) compared SVM to two other non-parametric
classifiers. SVM has been familiar as an effective classifier in
land-cover mapping (Clinton et al., 2015) We used the ENVI (the environment for visualizing images software), SVM classifier in this study and the parameter settings were as follows: the radial basis function was used as the kernel type, the gamma in the kernel function was set as 0.143, and the penalty parameter was set as 100.
4. EXPERIMENTAL RESULTS AND ANALYSIS
4.1. Land Cover / Land Use Classification Result
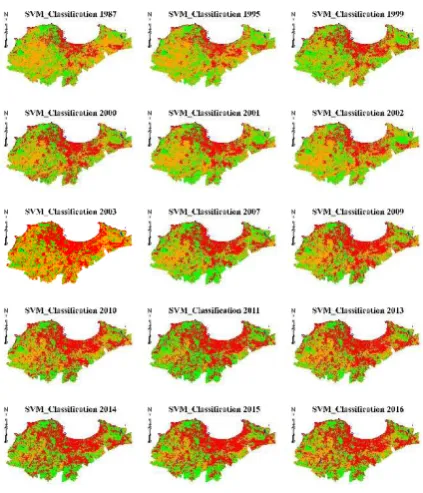
On the basis of a time series of the Landsat images, LULCs of the study region was classified into four categories such as Urban land, Vegetation Bare field, Water bodies, the supervised classification method (SVMs) provides excellent results in all Landsat images as shown in Figure 4:
Figure 4. Land Cover Maps of Algiers from 1987 to 2016 Derived from Landsat Time Series Images.
Figure 5. Assessment of Land Cover Accuracy the SVM Classification.
Two indices were used to evaluate the performance of the classifications: The Overall Accuracy (OA) and the Kappa index (K), the evaluation results demonstrated that the SVM algorithm with an overall accuracy and a kappa coefficient test was performed to measure the extent of classification accuracy as it not only accounts for diagonal elements but for all the elements in the confusion matrix has a higher accuracy in land use mapping (Srivastava et al., 2012).
On average, the overall accuracy is approximately 96.02% and a kappa coefficient 93.66%, demonstrating that the land-cover classification results provide a solid basis for quantifying urbanization activities in the fast-developing urban areas.
4.2. Classification and evaluation
The Classification of different class types with learning samples extracted using SVM (Fig 4). Based on an optical control, the results of the classification, and the reason for the spatial division of ground cover per year.
And it has increased in recent years of the study period of the project, and the urbanization of Algiers City clear that urban extension has increased substantially continuously from year to year, and urban areas throughout the area in 2015 was the almost year after the year 1987.
We tested the ability of Support Vector Machines (SVMs) to discriminate classes using a limited number of training samples and it was applied to time-series (Zheng et al., 2015).
5. RESULTS AND DISCUSSION
Figure 6. The Maps of Urban from 1987 to 2016 as Derived from the Landsat Data.
In this study, Remote Sensing techniques have been used for data analysis for 29 years, and the grading method supervises the Support Vectors Machine (SVMs) and changes detection. 1) Assessment of urban land changes and population growth; 2) to measure the hectares and percentages of Urban growth; and 3) temporary analysis of urban Land. This study could highlight Land-Use change for all Urban Areas of Algiers. He stressed the necessary statistics to quantify this phenomenon. The discovery of change was a critical contribution to the study. Medium-resolution images, such as Landsat, have enabled the extraction of urban areas, compared with the National Office of Statistics data.
Figure 7. The relationship between Urban Land and Bare Field for Different Years.
For this purpose, since 1987 to 2016, spatial images Landsat Satellites were used to evaluate and modify urbanization and transgressions during this period. The results showed that urban density was concentrated along a high length of Algiers and the City Centre. However, the density of vast urban areas beyond the border along the coast and southeast of the city, it shows us the city of Algiers had a growth rate. These expansions are largely related to new properties and these trends help us to better understand the patterns and processes of urbanization and suggest some problems with urbanization so far. For example, this increase in urbanization in areas negatively affects the ecosystems and services we provide, the urbanization of these agricultural lands and natural habitats in urban areas, thereby reducing the cultural identities of cities. Urban studies in the future should consider both generalities and characteristics and be directly related to urban sustainability measures.
5.1. Urban Sprawl on Provincial Level
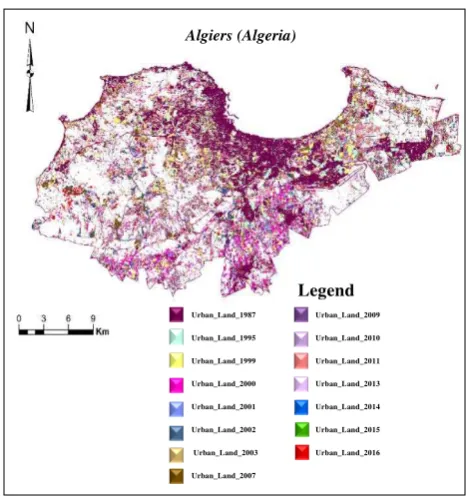
Figure 8. The map of urban expansion in Algiers City from 1987 to 2016 as derived from the Landsat data. The main change in land cover in urban areas is due to other types of land cover in land constructed as a result of construction and repairs, but other changes, including increasing public green space and Roads, are also very common. Remote sensing is arguably the most effective tool for monitoring land cover and Landsat TM / ETM + and OLI data are the most popular data sources on the urban scale.
In order to analyze changes in urban coverage over the past 29 years, post-classification comparisons and statistics are used. Based on the land cover properties in Algiers, we used the following four land cover types: Urban Land, Vegetation and Bare Field, Water bodies.
5.2. Urban Sprawl on Municipal Level
Figure 9. Urban Sprawl at the Municipal Level in three Phases.
This section distribution with covering Urban Expansion in the study area over 29 years from 1987 and 2016: Spatial coverage from1987 and 2010 it is clearly shown in Fig. 9.
Calculating the Urban Land of Algiers City, we applied the Supervised Classification of land cover in the Landsat Images containing the Cities in the sample typically extended beyond the set of districts containing these Cities. To calculate the Urban Land for every district in this set, the urban grid for every City in the sample needed to be clipped using the City districts Shapefile. Clipping the urban grid was done by using the Arc Map’s Raster Calculator with the municipalities Shapefile set as an Analysis Mask.
Figure 10. Urban Sprawl at the Municipal Level
0% 10% 20% 30% 40% 50% 60% 70% 80% 90% 100%
U
rb
a
n
A
rea
(
%
)
Municipalities
Urban_Land 1987 Urban_Land period (1987-2000)
Urban_Land period (2000-2009) Urban_Land period (2009-2016)
Legend Algiers (Algeria)
Legend
Urban_Land_1987 Urban_Land_2009
Urban_Land_1995 Urban_Land_2010
Urban_Land_1999 Urban_Land_2011
Urban_Land_2000 Urban_Land_2013
Urban_Land_2001 Urban_Land_2014
Urban_Land_2002 Urban_Land_2015
Urban_Land_2003 Urban_Land_2016
Figure 11. Urban Sprawl at the Municipal Level.
The Zonal Statistics tool was used to count the number of Urban Land pixels in each Municipality and organize the results into below a table. The results confirm the importance of precision assessment in the field to identify problems on a land use map and to improve the area estimates for each municipality.
Consideration into account the period from 1987, 2000, 2009 and 2016 in three phases, Table 2 shows the relationship between the Supervised Classification and the National Statistics Office. They found that the result obtained in the Urbanization arrangement at the expense of land cover in Municipalities on a percentage level. According to the results obtained, the study indicates that Urban Areas derived from Landsat Images are consistent with those obtained from survey data in general. The analysis derived from Landsat for Urban Areas is close to official reports because the effects of the Landsat pixel combination can lead to biased estimates of Urban Areas.
Figure 12. Population for each Municipality.
The total area for each Urban Land Cover / Land Use category in the study area were calculated separately from the images classified between (1987 - 2016). This is shown in Table 2.
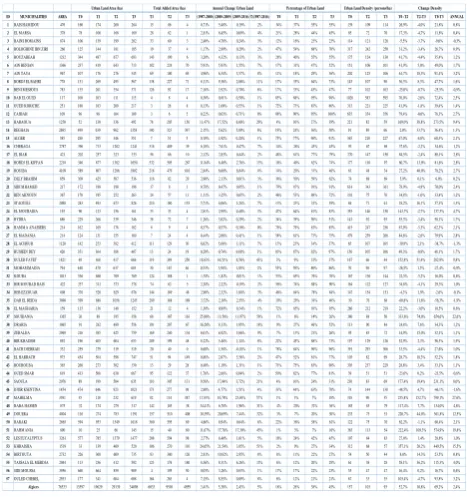
Table 2. Annual Change Urban Land with Population Density.
Our results show that dramatic urbanization has occurred in the region of the Algiers city, where Urban Land areas have mostly expanded to East, West, and South of the Central Regions. The average growth rate of urban areas in Algiers from 1987 to 2016 was at 707 Hectare per year, which was generally consistent with the National Office of Statistics data.
Figure 13. Urban Land Density (persons/ha).
6. CONCLUSION
Our method of Time Series for Landsat Images and Classification maps created for Algiers in an annual basis from 1987 to 2016. Land Cover Classification maps were estimated against in random sample points. We found that the overall change is consistently high from year to year, with an average of 150% for all study years in urban land area as derived from Landsat images comparison with the results shows that before we completed the extension area during the two periods, the first between 1987 to 2000 and the second until 2014 derived from the Office National of Statistics in 1987, 2000 and 2014 the urban areas of Algiers increased from about 13,597 hectares in 1987 to over 19,629 hectares in 2000 and more than 33,400 hectares in 2014, indicating that urban land is in increasing speed. Most of the change in land Use is the conversion of agricultural land to Urban Areas. Using time series of satellite images, it is possible to calculate the degree of change between
0%
Urban_Land period (2000-2009) Urban_Land period (2009-2016)
0
ID MUNICIPALITIES AREA T0 T1 T2 T3 T1 T2 T3(1987-2000) (2000-2009) (2009-2016) T(1987-2016) T0 T1 T2 T3 T0 T2 T3 T0 -T2 T2-T3 T0-T3ANNUAL
1RAIS HAMIDOU 476 160 174 260 264 15 86 4 0,71% 5,48% 0,19% 2% 34% 37% 55% 55% 139 109 114 26,9% -4,0% 21,8% 0,8% 18BORDJ EL KIFFAN 2218 346 877 1382 1650 532 505 267 11,84% 6,40% 2,76% 13% 16% 40% 62% 74% 177 110 97 60,7% 13,0% 81,6% 2,8% 19ROUIBA 4109 589 807 1286 1902 218 479 616 2,84% 6,60% 6,84% 8% 14% 20% 31% 46% 61 48 34 27,2% 40,0% 78,2% 2,7% 53KHRAISSIA 1519 33 139 409 520 106 270 110 24,65%21,54% 3,85% 51% 2% 9% 27% 34% 312 68 57 357,1% 20,2% 449,5% 15,5% 54BIRTOUTA 2732 226 308 609 735 83 300 126 2,81% 10,82% 2,95% 8% 8% 11% 22% 27% 54 50 44 8,0% 14,3% 23,5% 0,8% 55TASSALA EL MERDJA 2044 113 236 412 592 123 176 180 8,36% 8,31% 6,26% 15% 6% 12% 20% 29% 61 38 28 58,1% 36,2% 115,3% 4,0% 56SIDI MOUSSA 3956 660 664 859 909 4 195 50 0,05% 3,26% 0,83% 1% 17% 17% 22% 23% 55 47 47 16,4% 0,2% 16,7% 0,6% 57OULED CHEBEL 2933 177 341 604 608 164 263 4 7,15% 8,55% 0,09% 8% 6% 12% 21% 21% 67 33 35 103,4% -4,7% 93,8% 3,2%
Algiers 76533 13597 19629 29139 34098 6033 9510 4959 3,41% 5,38% 2,43% 5% 18% 26% 38% 45% 157 103 93 52,7% 10,8% 69,2% 2,4%
predefined land cover classes. In this way, changes in the areas extent can be calculated over time.
finally, series of acquired images with spatial and temporal resolution are available. these series make it possible to develop a monitoring of a great diversity of spatiotemporal structures and are particularly interesting for urban applications.
ACKNOWLEDGMENT
This work was partly supported National Natural Science Foundation of China under Grant Nos. 41622107 and 41371344, and Natural Science Foundation of Hubei Province under Grant No. 2016CFA029.
REFERENCES
Allen, B., Maréchal, A., Nanni, S., Pražan, J., Baldock, D., Hart, K., 2015. Data sources to support land suitability assessments for bioenergy feedstocks in the EU–A review. Institute for European Environmental Policy (IEEP), London.
Aussenac, G., 2000. Interactions between forest stands and microclimate: ecophysiological aspects and consequences for
silviculture. Annals of Forest Science, 57(3), pp. 287-301.
Bauer, M. E., Heinert, N. J., Doyle, J. K., Yuan, F., 2004. Impervious surface mapping and change monitoring using
Landsat remote sensing. ASPRS annual conference proceedings,
Denver, Colorado.
Bouhennache, R., Bouden, T., Taleb, A. A., 2014. Change detection in urban land cover using Landsat images satellites, a
case study in Algiers town. the Signal-Image Technology and
Internet-Based Systems (SITIS), 2014 Tenth International Conference on.
Campante, F. R., Chor, D., 2012. Why was the Arab world poised for revolution? Schooling, economic opportunities, and
the Arab Spring. The Journal of Economic Perspectives, 26(2),
pp. 167-187.
Chrysoulakis, N., Heldens, W., Gastellu-Etchegorry, J.-P., Grimmond, S., Feigenwinter, C., Lindberg, F., . . . Esch, T., 2015. Urban Energy Budget Estimation from Sentinels: The URBANFLUXES Project. Mapping Urban Areas from Space.
Clinton, N., Yu, L., and Gong, P., 2015. Geographic stacking: Decision fusion to increase global land cover map accuracy.
ISPRS Journal of Photogrammetry and Remote Sensing, pp. 103, 57-65.
Hadjri, K., Osmani, M., 2004. The spatial development and urban transformation of colonial and postcolonial Algiers. Planning Middle Eastern Cities, pp. 29-58.
Henits, L., Mucsi, L., Liska, C. M., 2017. Monitoring the changes in impervious surface ratio and urban heat island intensity between 1987 and 2011 in Szeged, Hungary. Environ Monit Assess, 189(2), pp. 86.
Hussain, M., Chen, D., Cheng, A., Wei, H., Stanley, D.,2013. Change detection from remotely sensed images: From
pixel-based to object-pixel-based approaches. ISPRS Journal of
Photogrammetry and Remote Sensing, 80, pp. 91-106.
Li, X., Gong, P., Liang, L., 2015. A 30-year (1984–2013) record of annual urban dynamics of Beijing City derived from Landsat data. Remote Sens Environ, 166, pp. 78-90.
Lin, Y., Lv, F., Zhu, S., Yang, M., Cour, T., Yu, K., . . . Huang, T., 2011. Large-scale image classification: fast feature extraction and SVM training. Paper presented at the Computer Vision and Pattern Recognition (CVPR), 2011 IEEE Conference on.
Marbà, N., Duarte, C. M., Cebrián, J., Gallegos, M. E., Olesen, B., Sand-Jensen, K., 1996. Growth and population dynamics of Posidonia Oceanica on the Spanish Mediterranean coast: elucidating seagrass decline. Marine Ecology Progress Series, 137, pp. 203-213.
Mitraka, Z., Chrysoulakis, N., Doxani, G., Del Frate, F., and Berger, M., 2015. Urban surface temperature time series estimation at the local scale by spatial-spectral unmixing of
satellite observations. Remote Sensing, 7(4), pp. 4139-4156.
Montgomery, M. R., 2008. The urban transformation of the developing world. science, 319(5864), pp. 761-764.
Rawat, J., Biswas, V., and Kumar, M., 2013. Changes in land use/cover using geospatial techniques: A case study of Ramnagar town area, District Nainital, Uttarakhand, India. The
Egyptian Journal of Remote Sensing and Space Science, 16(1),
pp. 111-117.
Roberts, P., Sykes, H., Granger, R., 2016. Urban regeneration: Sage.
Shahtahmassebi, A., Pan, Y., Lin, L., Shortridge, A., Wang, K., Wu, J. X., . . . Zhang, J., 2014. Implications of land use policy on the impervious surface cover change in Cixi County, Zhejiang Province, China. Cities, 39, pp. 21-36.
Siciliano, G. (2012). Urbanization strategies, rural development, and land use changes in China: A multiple-level integrated assessment. Land use policy, 29(1), pp. 165-178.
Srivastava, P. K., Han, D., Rico-Ramirez, M. A., Bray, M., and Islam, T. (2012). Selection of classification techniques for land use/land cover change investigation. Advances in Space Research, 50(9), pp. 1250-1265.
Tewolde, M. G., 2011. Urban sprawl analysis and modeling in Asmara, Eritreia: Application of Geospatial Tools.
Triantakonstantis, D., Chrysoulakis, N., Sazonova, A., Esch, T., Feigenwinter, C., Düzgün, S., . . . Tal, A., 2015. On-line evaluation of earth observation derived indicators for urban
planning and management. Urban Plan. Des. Res, 3, pp. 17-33.
Wang, L., Sousa, W., and Gong, P., 2004. Integration of object-based and pixel-object-based classification for mapping mangroves
with IKONOS imagery. International Journal of Remote
Sensing, 25(24), pp. 5655-5668.
Wu, Q., Li, H.-q., Wang, R.-s., Paulussen, J., He, Y., Wang, M., . . . Wang, Z., 2006. Monitoring and predicting land use change
in Beijing using remote sensing and GIS. Landscape and urban
planning, 78(4), pp. 322-333.
enabled the science and monitoring promise of Landsat. Remote Sens Environ, 122, pp. 2-10.
Yang, X., and Lo, C., 2002. Using a time series of satellite imagery to detect land use and land cover changes in the
Atlanta, Georgia metropolitan area. International Journal of
Remote Sensing, 23(9), pp. 1775-1798.
Yin, J., Yin, Z., Zhong, H., Xu, S., Hu, X., Wang, J., and Wu, J., 2011. Monitoring urban expansion and land use/land cover changes of Shanghai metropolitan area during the transitional economy (1979–2009) in China. Environ Monit Assess, 177(1), pp. 609-621.
Zheng, B., Myint, S. W., Thenkabail, P. S., and Aggarwal, R. M., 2015. A support vector machine to identify irrigated crop
types using time-series Landsat NDVI data. International