Volume 27, Number 2, 2012, 143 – 158
PSYCHOLOGICAL BIASES IN INVESTMENT DECISIONS:
AN EXPERIMENTAL STUDY OF MYOPIC BEHAVIOR IN
DEVELOPING CAPITAL MARKETS
Wendy
Faculty of Economics, Tanjungpura University, Pontianak ([email protected])
Marwan Asri
Faculty of Economics and Business, Gadjah Mada University ([email protected])
ABSTRACT
This paper attempts to analyze the psychological biases that affect investors in making risky investment decisions based on the theory of Myopic Loss Aversion (MLA). The data were obtained from two sources (students and stock investors) which in turn were manipu-lated by two types of treatment (frequent and infrequent), using a mixed design of between-within subjects with a 2 x 2 factorial. The experimental result showed the consistency of the two groups of participants to the theory of the MLA. Analysis of the gender showed that the boldness levels of the male participants and female participants in the group of investors were the same, while in the student group, gender showed a significant influence. Other findings included a "shock-effect" experienced by the participants during the experi-ment.
Keywords: behavioral finance, myopic loss aversion, frequent-infrequent, gender, and shock-effect
INTRODUCTION
Standard financial theories generally as-sume that investors behave rationally. They are deemed able to maximally utilize and process any available information, but the psy-chological factors tend to be ignored. This fact triggers to the development of the behavioral finance theory which tries to analyze the psy-chological biases, which receive ‘less atten-tion’ in the standard financial theories. The topic raised in this article also leads to the be-havioral finance theory. The analysis is fo-cused on the investors’ behavior in the process of making decisions for risky investment based on the theory of myopic loss aversion (MLA) presented by Benartzi & Thaler (1995).
Experimental research to examine Benartzi & Thaler’s MLA theory (1995) is still RARE. Gneezy & Potters (1997) and Haigh & List (2005) used two types of treat-ment in their experitreat-ments, frequent (F) and
infrequent (I) treatment to examine the MLA theory. Treatment F allowed participants to conduct evaluation on their trading results periodically (in a relatively short-term period), while treatment I allowed the participants to evaluate their trading results in a relatively longer period.
theory. In addition, their consistency level was higher than that among students. Indirectly, their findings supported Gneezy & Potters’ study (1997).
Based on the previous empirical, it is as-sumed that in emerging markets the behavior of the experienced group and that of the inexperienced in making investment decision are also consistent with the MLA theory. The experienced group’s consistency is assumed to be higher that of the inexperienced. Gender-wise, the two groups of participants are pre-dicted to show different behavior (in terms of their boldness level) when making decision on risky investment. These assumptions have provided strong motivation for the present researchers to conduct this study.
This study reexamines Benartzi & Thaler’s MLA theory (1995) by adopting Treatments I and F and to check the possible difference of behavior (in terms of their bold-ness level) between the experienced group (the professionals) and the inexperienced one (the non-professionals) in the process of making investment decisions in developing emerging market. To observe the phenomena, two groups of participants (the experienced and the inexperienced) were involved in this study.
This paper is organized into five parts. The first starts with the background and the purpose of this study, which are followed by a review of literature and hypotheses develop-ment. The research method follows and the discussion of the results is next. The last part presents several conclusions, the research limitations, and the suggestions for future research.
REVIEW OF LITERATURE AND HYPTHESIS DEVELOPMENT Myopic Loss Aversion (MLA)
The choice to invest in more secure assets by ignoring a higher return rate is a capital market phenomenon which is difficult to be explained with an economic model and has
been puzzling researchers up to the present. Therefore, in financial theories, the equity risk premium is also often called the equity pre-mium puzzle (Siegel & Thaler, 1997). Mehra & Prescott (1985) analyzed the phenomenon of the equity premium puzzle with stock and bond returns. Their empirical finding only showed that the level of high-risk aversion could be used to explain why most investors prefer to invest in bonds. Later, Benartzi & Thaler (1995) combined two behavior con-cepts, namely loss aversion (Kahneman & Tversky, 1979) and mental accounting (Thaler, 1985) into what is later called myopic loss aversion (MLA) to develop a theoretical foundation in observing the equity premium puzzle.
The different levels of risk aversion among individuals are a behavioral factor that presented by Kahneman & Tversky (1979) in sion is equivalent to the utility function,where one is more concerned with loss than gain. Thaler (1999) explains that in general indi-viduals’ feeling of pain when losing 100 dollars is stronger than their feeling of joy
when acquiring 100 dollars.
The more often an account is evaluated, the more careful an individual is in making next decisions. The high frequency of evalua-tion on the investment in risky assets will in-crease investors’ dissatisfaction to their invest-ment returns (Haigh & List, 2005). This is because the riskier assets might have less opti-mal performance in a short-term period. Therefore, a lower evaluation frequency has the potentials to drive investors to allocate bigger investment in riskier assets than in less risky assets. Investors will experience myopic loss aversion if they evaluate their investment returns in terms of gain and loss separately upon receiving certain information (Haigh & List, 2005).
Gneezy & Potters’s study (1997) has re-vealed the behavioral difference between stu-dents who frequently receive feedback and those who receive feedback infrequently in making investment decisions. Their experi-ment showed the students’ consistency with the MLA theory. Haighand List’s research (2005) also revealed the consistence of CBOT professionals and future traders to the MLA theory. The review of literature and the previ-ous researchers’ empirical research support the following first two hypotheses formulated to test the MLA theory.
H1: The inexperienced participants are bolder in making decisions for risky investment when receiving the infrequent treatment than when receiving the frequent treat-ment.
H2: The experienced participants are bolder in making decisions for risky investment when receiving the infrequent treatment than when receiving the frequent treat-ment.
This study also tries to reveal the possible behavioral difference between the two groups of participants in the process of making deci-sions for risky investments. List’s study (2002, 2003, and 2004) showed that there was a de-crease in the market anomaly in the aspect of
investment decision-making particularly among market-experienced economic agents. The finding supported the opinion that there was a possible behavioral difference between professionals and non-professionals in making decisions for risky investment (Haigh & List, 2005).
Further, Haigh & List (2005) stated that there was a possible significant behavioral difference between an experiment whose sub-jects were professionals and an experiment whose subjects were students (as found in Gneezy & Potters’s research, 1997). These studies indicate that the inclusion of an inexperienced group (such as students) as participants to represent an experienced group (such as stock investors) in an experiment might lead to a less optimal result because of the possible biases (Szalanski & Beach, 1984; Bonner & Pennington, 1991; Frederick & Libby, 1986 in Haigh & List, 2005).
The description above shows that the behavior of economic agents with sound mar-ket experience will be different from that of those without sound market experience. The difference is predicted to be reflected in their decision making for risky investment. The empirical argumentation above supports the following two hypotheses:
H3a: In the process of making decisions of
risky investment, when given the fre-quent treatment, the experienced group’s behavior is different from that of the inexperienced.
H3b:In the process of making decisions of
risky investment, when given the infre-quent treatment, the experienced group’s behavior is different from that of the inexperienced.
presented by Cohn et al. (1975) and Watson & McNaughton (2007). Their empirical findings show that in general female investors have a higher level of risk aversion than male investors. Meanwhile, Save-Soderbergh (2003), as reported in Watson & McNaughton (2007) stated that the proportion of women choosing to invest in the risky superannuation-fund (a kind of pension superannuation-fund) is lower that of McNaughton (2007) state that women produce more monoamine-oxidase enzyme than men. This enzyme reduces the level of sensation search and at the same time limit their freedom when making risky decisions.
The second reason is the socio-cultural as-pect, which makes men bold in making risky decisions. Byrnes (1998) states that during their childhood girls tend to be more closely monitored by parents than boys so that in their adulthood they are less bold in making risky decisions. Based on the empirical findings above, it is assumed that gender influences individuals in making risky investment deci-sions. This argumentation supports the deve-lopment of the last two hypotheses, which are as follows:
H4a: Among the experienced group, male
investors have a lower level of risk-aver-sion than female investors.
H4b: Among the inexperienced group, male
investors have a lower level of risk aver-sion than female investors.
RESEARCH METHOD
This research manipulated four experi-ment conditions with a 2x2 within-between (with two groups of participants: the experi-enced and the inexperiexperi-enced, and two types of
treatment: frequent and infrequent). The popu-lation of this experiment was all undergraduate students of Management Department of a university in Pontianak who had passed the Financial Management course and all stock investors in security firms in West Kaliman-tan.
The selection of the experiment subjects was based on certain criteria and then they were randomized. For the inexperienced group, the criteria were: (1) being an active student of the regular class of a management department with a passing grade for the Finan-cial Management course, and (3) having never taken a simulation or having no experience in trading stocks, options, indexes, and other derivatives in any securities firm, and having never joined any investor club. For the experi-enced group, the criteria were: (1) being a registered stock investor of a security firm in West Kalimantan, and (2) having experience of at least one year in stock trading.
The sample of each participant groups consisted of 40 subjects: 20 females and 20 males. The number of the experiment subjects was 80 (40 per cell), which is considered ade-quate because according to Myer and Hansen (2001) the number of experiment subjects should be at least 15 to 20 for each treatment group.
The experiment techniques in this research referred to the research conducted by Gneezy & Potters (1997) and Haigh & List (2005) with some modification. The treatment was categorized into two types: Treatment F (with trading result evaluation conducted after each round) and Treatment I (with trading result evaluation conducted after three rounds). The participants were given an initial capital of 100 units at the beginning of every round.
that one hundred rupiahs was worth 1 unit, while for the experienced group the rate is 2 to 1, which means that two hundred thousand rupiahs was worth 1 unit. The difference was to accommodate the returns obtained by inves-tors in the stock market (Haigh & List, 2005). The gain or loss of the participants was determined by the correct choice of the letters to be shown (X, Y, and Z).
A participant was declared to be a winner if the chosen letter (X, Y, or Z) was the same as the one shown to them. Therefore, a partici-pant’s winning probability was a third (or thirty three present), while the losing probabil-ity was two thirds (or 67 percent).When a participant lost, s/he would lose all posses-sions, but when the chosen letter was in line with the shown one, s/he would be a winner and would be entitled to receive 2.5 times the amount s/he bet. At the end of each round, the participants had to calculate and record their trading results in the trading form.
In treatment I, the participants were only able to evaluate their trading results per three rounds (one trading block). The participants were given three trading blocks, each of which consisted of three trading rounds. In the begin-ning of each round, every participant was given an initial capital of 100 units, with different rates for the inexperienced group and the experienced. The main difference in Treat-ment I was that the participants were obliged to offer a bet per three rounds (one trading block) simultaneously.
The evaluation on the participants’ gain or loss was conducted at the end of every trading block. After all participants offered their bets,
at the end of the first block (namely at the end of the third round) there were three letters shown consecutively, the first of which was for the first round, the second for the second round, and the third for the third round. After-wards, the participants calculated the results of their bets in the first block. The same proce-dure took place up to the third block (rounds 7–9). The gain or loss rule applied in Treat-ment I was the same as that for TreatTreat-ment F. The time allocated for Treatment F was ap-proximately 30 minutes, while for Treatment I it was approximately 45 minutes. The time allocated for the experiment was designed to be less than one hour to prevent participants’ boredom. To minimize the participants’ inter-action and learning effects, the experiment was divided into four different sessions
The testing of the MLA theory (using a within-subject design) was conducted with a
paired-samples t-test. Meanwhile, to test the possibility of different behavior (as reflected in the amount of the bet) ―specifically for the between-subject design―an independent-sam-ple t-test was employed. Next, to test the effect of the gender variable on each participant group a non-parametric Mann-Whitney test was conducted. In the data analysis, the SPSS and Eviews software programs were used.
RESULTS AND DISCUSSION
Table 1 presents the result of the normal-ity test on the observation samples used in this research. As seen in the table, in general the normality assumption for the four groups was met in the analyses with different methods (liliefors, shapiro-wilk, and JB-test), with the
Table1. Results of Normality Tests
Participant Group Liliefors Shapiro-Wilk Jarque-Bera
Statistics Sig. Statistics Sig. Statistics Sig.
Inexperienced (Frequent) 0.112 0.200 0.964 0.226 0.229 0.892
Inexperienced (Infrequent) 0.100 0.200 0.954 0.101 2.030 0.362
Experienced (Frequent) 0.120 0.148 0.982 0.754 0.613 0.736
sig. value above 0.05. Therefore, the next analysis to test the MLA theory was legiti-mately conducted, the results of which can be seen in Table 2.
Table 2 shows that the inexperienced group participants averagely bet 55.464 units when receiving Treatment F, while when given Treatment I their boldness increased and their bet average was 64.553 units. The in-crease was also observed among the experi-enced group. When receiving Treatment F, their bet average was 48.125 units, and it drastically increased to 72.956 units when receiving treatment I. From the paired sample t-test, it was shown that the increase was statistically significant at 5% (0.017) for the inexperienced group and 1% (0.000) for the experienced. The statistical analysis results in general support H1 and H2.
The two groups of participants in Table 2 showed consistency with the MLA theory when making decisions on risky investment. This finding also indicates that the
experi-enced group showed a higher level of consis-tency with the MLA theory than the inexperi-enced. This is shown in the lower average of the experienced group, which was only 48.125 units when they received Treatment F.
The different level of significance be-tween the experienced and the inexperienced needs more exploration. For this purpose, a simulation was conducted by dividing the two groups’ experiment results when receiving Treatment F into three trading blocks, which was in line with the model of Treatment I.
After each block was tabulated, a paired-sample t-test was conducted to identify which different behavior had triggered the different levels of significance in the two groups of par-ticipants. The results of the statistical analysis in each trading block are presented in Table 3.
In the above table, it is shown that there was no significant difference between the experienced group and the inexperienced one. Though the absolute trading value average
Table 2. MLA Theory Analysis Results
Group Treatment Mean (Unit) Standard Deviation Sig.
Inexperienced Frequent 55.464 26.140 0.017
Infrequent 64.553
Experienced Frequent 48.125 18.379 0.000
Infrequent 72.956
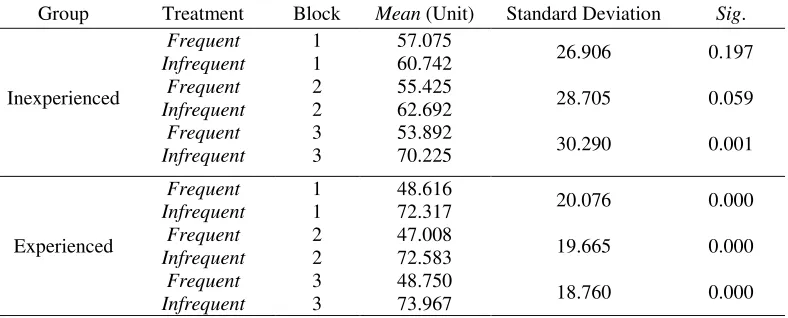
Table 3. Results of Inter Per-Block Trading Treatment Analysis
Group Treatment Block Mean (Unit) Standard Deviation Sig.
Inexperienced
Frequent 1 57.075
26.906 0.197
Infrequent 1 60.742
Frequent 2 55.425
28.705 0.059
Infrequent 2 62.692
Frequent 3 53.892
30.290 0.001
Infrequent 3 70.225
Experienced
Frequent 1 48.616
20.076 0.000
Infrequent 1 72.317
Frequent 2 47.008
19.665 0.000
Infrequent 2 72.583
Frequent 3 48.750
18.760 0.000
when receiving Treatment I was higher than when receiving Treatment F, statistically the participants’ boldness in making decisions for risky investment under the two different treat-ments did not show any significant difference.
In the third trading block, namely the last three rounds before the experiment was com-pleted, the above table shows that there was a change of trading behavior among the inexperienced participants. When receiving Treatment F, the participants showed an increasing degree of aversion, where the trad-ing value average decreased from 57.075 units in the first block to 53.892 units in the third block. Meanwhile, when receiving Treatment I, there was a reversed change of behavior, where the investors’ risk tolerance was in-creasing in the last three rounds. In this third block, the trading value average increased from 60.742 units to 70.225 units. The de-crease of the trading value average under Treatment F and the increase of the trading value average under Treatment I in the third block showed statistically significant
differ-ence at the significance level of 1%.
The behavior change among the inexperi-enced group participants in the third block made the analysis result for H1 significant at the level of 5%. This analysis result showed that the inexperienced participants showed a behavior change in the last three rounds of the experiment, which is consistent with the MLA theory
In the experienced group, the significance level at 1% was observed in all trading blocks and the trading value average did not fluctuate much. In Treatment F, the trading value aver-ages in the first, second, and third blocks were respectively 48.616 units, 47.008 units, and 48.750 units. A similar observation was found when receiving Treatment I, where the trading value averages of the first, second, and third blocks were respectively 72.317 units, 72.583 units, and 73.967 units. Therefore, the consis-tency with the MLA theory was shown since the beginning of the trading at a higher level of significance. This research result supports the experiments conducted by Gneezy &
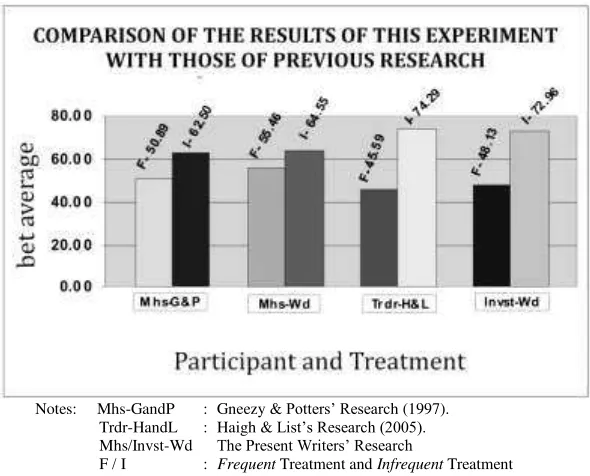
Notes: Mhs-GandP : Gneezy & Potters’ Research (1997). Trdr-HandL : Haigh & List’s Research (2005). Mhs/Invst-Wd The Present Writers’ Research
F / I : Frequent Treatment and Infrequent Treatment
Potters (1997) and Haigh & List (2005). The comparison of the results of this experiment with previous MLA research is presented in the following Figure 1.
To test the possible difference of behavior between the two groups, the trading results of the two groups (under Treatment F and also under Treatment I) were compared, whose results are shown in Table 4.
In the analysis results presented in Table 4, it is shown that when receiving Treatment F the inexperienced group had a trading value average of 55.464 units. Meanwhile, for the experienced Treatment F made them more sensitive to loss, where their trading value average was 48.125 units, lower than that of the inexperienced. Statistically, the difference was close to the significance level of 10%. Under Treatment I, the trading value average of the inexperienced was 64.553 units. For the experienced, their trading value average was
much higher (namely 72.956 units). The sta-tistical test showed that the difference between the averages of the two groups was significant at the level of 5%. In general, the analysis re-sults shown in Table 5 show that the two different groups were significantly different in the process of making decisions for risky in-vestment both under Treatment F and Treat-ment I, which also supports H3a and H3b.
To further explore the results of the analy-ses for the two hypotheanaly-ses, a simulation by dividing the nine trading rounds in Treatment F into three trading blocks in Treatment I was conducted. After the trading value average per block was obtained, an independent sample t-test was performed, whose results can be ob-served in Table 5.
In the analysis, it is shown that under Treatment F for the first and second blocks there was a significant difference of behavior between the two groups of participants at the
Table 4. Analysis of Trading Behavior between the Two Groups of Participants
Treatment Group Mean
(Unit)
Standard Deviation Sig.
Frequent Inexperienced 55.464 16.007 0.054 Experienced 48.125 17.567
Infrequent Inexperienced 64.553 17.305 0.013 Experienced 72.956 11.389
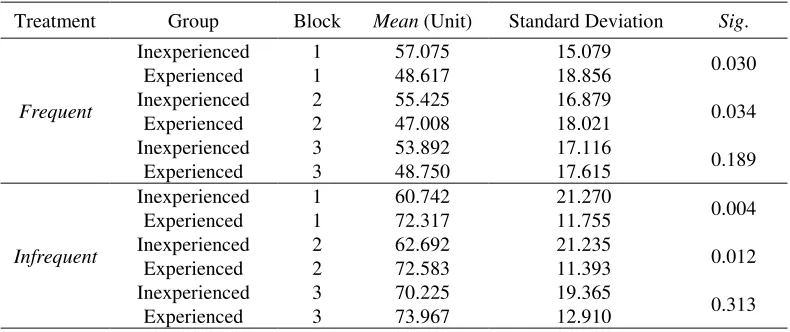
Table 5. Results of Inter-Group Analysis per Trading Block
Treatment Group Block Mean (Unit) Standard Deviation Sig.
Frequent
Inexperienced 1 57.075 15.079
0.030
Experienced 1 48.617 18.856
Inexperienced 2 55.425 16.879
0.034
Experienced 2 47.008 18.021
Inexperienced 3 53.892 17.116
0.189
Experienced 3 48.750 17.615
Infrequent
Inexperienced 1 60.742 21.270
0.004
Experienced 1 72.317 11.755
Inexperienced 2 62.692 21.235
0.012
Experienced 2 72.583 11.393
Inexperienced 3 70.225 19.365
0.313
significance level of 5%. However, in the third trading block, the test did not yield any signifi-cant difference between the two groups be-cause the trading value average of the inex-perienced consistently decreased from 57.075 units and 55.425 units in the first and second blocks to 53.892 units in the third block. Meanwhile, the trading value averages of the inexperienced group were quite stable, with respectively 48.617 units, 47.008 units, and 48.750 units for each trading block.
The statistical insignificance in the third trading block eventually influenced the overall analysis for the trading value averages of all 9 rounds of Treatment F. This made the statisti-cal test results close to the significance level of 10% (see Table 5). The last three rounds made the inexperienced participants more conserva-tive in making trading decisions so that they tended to keep their endowment by reducing their trading values.
In Treatment I, it is shown that the trading value averages of the inexperienced fluctuated much. In the first trading block, their trading value average was 60.742 units, but in the sec-ond and third blocks their trading value aver-trading block, which were respectively 72.317 units, 72.583 units, and 73.967 units.
The behavioral change among the inex-perienced participants in the third block caused the statistical test in the block to be insignificant. The result of this analysis shows that in the third trading block there was no statistically significant difference between the two groups. The increasing averages of the inexperienced group in the third block shows a spontaneous behavioral change, which might have been caused by the worry of the closing of the trading. The inexperienced group demonstrated consistency with the MLA
the-ory in the third trading block since they made more bets than in the preceding two blocks. In other words, there was an increase of the risk tolerance degree among the inexperienced participants in the last trading block.
This analysis also shows that the experi-enced group demonstrated myopic loss aver-sion throughout the experiment, starting from round 1 to round 9. This was shown in the relative stability of their trading value aver-ages from block to block (for both treatments). Meanwhile, the inexperienced group demon-strated a rather different behavior. Their con-sistency with the MLA theory was observed only in the last rounds before the completion of the experiment, as shown in the sharp fluc-tuations of their trading value averages in the third block for the two different treatments. This finding supports the argumentation pre-sented by Haigh & List (2005).
The Gender Factor
Several empirical findings have shown that in general, females have a higher risk aversion than males (Watson & McNaughton, 2007; Feltton et al. 2003; Cohn et al. 1975; Riley & Chow, 1992). Considering this fact, the present researchers are concerned with the gender variable.
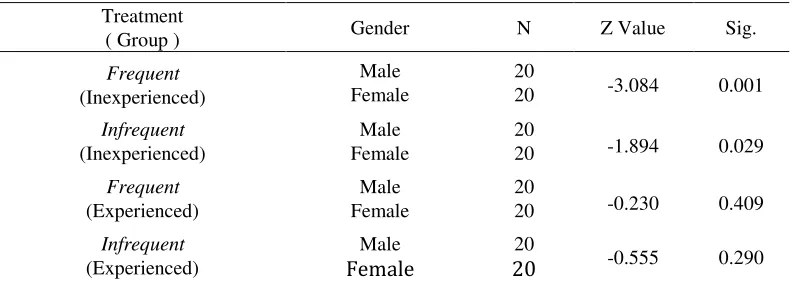
To test whether males are bolder in mak-ing decisions for risky investment than fe-males, a Mann-Whitney statistical test was conducted. The results of this non-parametric test are presented in Table 6.
The above table shows that the statement that males are bolder in taking risk than fe-males was only significant for the inexperi-enced group both for Treatment F and Treat-ment I (and therefore supports H4b). Mean-while, among the experienced participants, males do not show higher risk tolerance than females for both treatments (which means that it does not support H4a).
have been influenced by other non-experimen-tal variables. Benzion and Yagil (2003) found the reversed relationship between the wealth level and the risk aversion level. In their re-search, the richer the subjects were, and the lower their risk aversion was. Other researches also have shown a similar relationship: the lower a person’s income, the higher the aver-sion risk (Bajtelsmit & Vanderhei, 1997; Hinz
et al. 1997 cited in Watson & McNaughton, 2007).
Jaggia and Thosar (2000) states that there is a negative relationship between age and risk-taking boldness. This is supported by Watson & McNaughton (2007), who state that a relatively more mature age makes investors tend to select less risky types of investment and vice versa.
The experiment conducted by Riley & Chow (1992) showed that investors with lower formal education usually select more conser-vative investments though their incomes are comparable to investors with higher formal education. The results of this research are also supported by the research of Dwyer et al.
(2001), which found that the control of inves-tors’ education resulted in increasingly lower influence to the choice of risky investments.
The empirical findings above show that the gender factor is not the only
non-experi-mental variable affecting the process of mak-ing decisions for risky investment. Other non-experimental variables, such as the income level, age, and education level, indirectly in-fluence individuals in making decisions for risky investment. Some of the variables were not controlled in this experiment, which might have made the insignificance of the statistical test results among the experienced partici-pants.
The analysis produced stronger results when applied to the inexperienced participants as shown in the significance level. The inexperienced participants consisted of under-graduate students of the regular class who were relatively of the same age. In addition, they did not big incomes because usually they had no job yet (or only part-time jobs, if any) because they had to take courses both in the morning and in the afternoon (even in the eve-ning for some). They were selected from undergraduate students of the same depart-ment, so they had homogenous formal educa-tion. Therefore, taking students as the samples indirectly controlled several non-experimental variables, such as the income level, age, and formal education level.
Homogeneity is assumed to have been the cause of the significance of the test results among the inexperienced. The finding also Table 6. The Gender in Making Decisions for Risky Investment
Treatment
( Group ) Gender N Z Value Sig.
Frequent
(Inexperienced)
Male 20
-3.084 0.001
Female 20
Infrequent
(Inexperienced)
Male 20
-1.894 0.029
Female 20
Frequent
(Experienced)
Male 20
-0.230 0.409
Female 20
Infrequent
(Experienced)
Male 20
-0.555 0.290
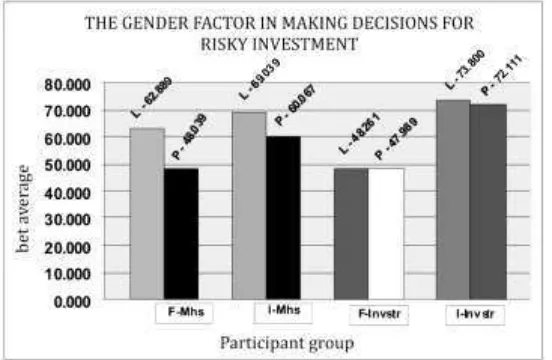
shows that gender is not the only non-experi-mental variable which deserves attention in research related to investors’ risk aversion. The trading value averages of the male and female participants are shown in the following Figure 2.
Shock Effect
Barberis & Huang (2001) state that loss aversion happens when investors are more sensitive to loss than to gain. Their empirical findings show that if investors suffer a loss after making a gain the feeling of ‘pain’ caused by the loss will be less. The pain will be more felt if they suffer from a loss in the first transaction, which makes them sensitive in the next transactions. This shows that psy-chologically they are influenced by the loss caused by their first transaction. This empiri-cal finding supports Thaler and Johnson’s opinion (1990), as stated in Thaler (1999) about his MBA student experiment (see Thaler, 1999).
To relate this present research to Barberis & Huang’s findings (2001), a detailed analysis was conducted on the participants who had losses and gains in the first round. The present researchers separated the (inexperienced and
experienced) participants who had losses from those who had gains in the first round specifi-cally for Treatment F only. This was done because in Treatment I the transaction was conducted per three rounds (one trading block), which made it more likely for the par-ticipants to have gains and also losses in their first trading block.
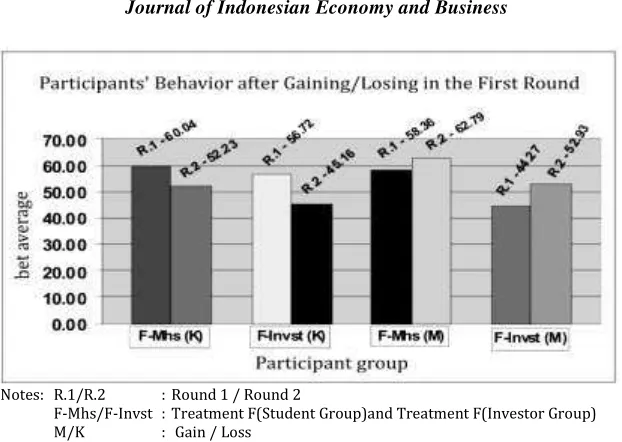
From the observation, it was found that 26 participants of the inexperienced group suf-fered losses in the first round, while the other 14 had gains. Meanwhile, among the experi-enced 25 participants suffered losses and the other 15 had gains in the first round. The trad-ing value averages of the participants with losses and those with gains in Treatment F in the first round are presented in Figure 3.
As shown in the figure, the participants’ behavior was in line with what was revealed by Barberis & Huang (2001). The participants losing in the first round generally reduced their trading value in the second round, while among the participants with gains in the first round tended to increase their trading value in the second round.
The participants in the inexperienced group who suffered a loss in the first round (F-Mhs (K)) generally decreased their trading
value average in the second round. Their trad-ing value average in the first round was 60.04 units, but after losing in the first round, their average decreased to 52.23 units or by 7.81 units. Similarly, this also happened among the experienced participants. Their trading value average in the first round was 56.72 units. But after losing in the first round, it decreased to 45.16 units or by 11.56 units. The decrease was bigger than that among the inexperienced participants (which was 3.75 units lower).
Another phenomenon was observed among the participants winning in the first round. Among the inexperienced, their trading value average was 58.36 units, but after hav-ing a gain in the first round, it increased to 62.79 units or by 4.43 units. Meanwhile, for the experienced participants, their trading value average in their first round was 44.27 units, but it increased to 52.93 units or by 8.66 units after winning in the first round. The in-crease was 4.23 units higher than that among the inexperienced participants.
This happened because psychologically the participants were affected by the loss/gain from the first transaction, which drove them to decrease/decrease their trading value in the
next transaction. The loss and the gain gave the participants a shock effect which psycho-logically influenced them. This finding indi-rectly supports the opinion of Thaler & Johnson (Thaler, 1999).
The results of the analysis are also consis-tent with the loss aversion theory. Their sen-sitivity to loss was higher than that to gain. When they suffered a loss, they tended to make more conservative investment by de-creasing their investment value. (The inexperi-enced participants’ trading value average de-creased by 7.81 units, while for the experi-enced participants the average decreased by 11.57 units). Meanwhile, when winning a gain, the increase of the trading value was not as big as the decrease of their investment value when suffering a loss.
Among the inexperienced participants, their trading value average increased by 4.43 units, while for the experienced it increased by 8.66 units. The results of this analysis also underscore the loss aversion theory on the different weighting for a loss and a gain. The analyses on the next following rounds were not conducted because the game accumulation for several rounds might result in more gains
Notes: R.1/R.2 : Round 1 / Round 2
F-Mhs/F-Invst : Treatment F(Student Group)and Treatment F(Investor Group) M/K : Gain / Loss
and more losses so that participants will no longer experience any ‘shock effect’.
CONCLUSION
The results of this experiment show that the two groups of participants demonstrated consistency with the MLA theory. From the nine trading rounds, the experienced group demonstrated the consistency since the onset of the experiment, whereas the inexperienced group’s consistency was observed only in the last three rounds before the completion of the experiment. This finding shows that the ex-perienced group’s consistency with the MLA theory was higher than the inexperienced group’s.
The next analysis dealt with the possible different behavior of the two different groups of participants in the process of making deci-sions for risky investment. The analysis results show that when receiving Treatment F the two groups behaved differently, which was statisti-cally significant at the level of 10%. Further exploration shows that the significance value which was close to 10% was affected by the inexperienced group’s consistency in the last three rounds before the completion of the ex-periment.
This study also studied the gender factor. The analysis results for the inexperienced group show that males were bolder in making decisions for risky investment than female. Meanwhile, for the experienced group the re-sults show that there was no significant differ-ence between males and females in their bold-ness in making investment decisions. The reviews on the previous research show that decision making for risky investment is also influenced by investors’ education level, trad-ing experience, income level, and age. This experiment also observed the presence of ‘a shock effect’. This effect results from the participants’ evaluation on the first transaction result (gain/loss) conducted under Treatment F by the participants in both the experienced and inexperienced groups.
RESEARCH LIMITATIONS AND FURTHER RESEARCH
This study used virtual endowment so that what is at stake in the trading is not the real cash. This condition might have potentially reduced the participants’ perception of risk so that the use of real capital through a field experiment deserves consideration. In addi-tion, this experiment has not included non-experimental variables, such the participants’ education level, income level, age, and trading experience. Therefore, future research needs to consider those variables.
The discussion in this article is only a small portion of the problems observed in be-havioral finance. Therefore, sound exploration is needed to develop this study discipline with the collaboration between practitioners and academicians by considering the aspect of investment psychology. In that way, it is ex-pected that future financial research will not just answer the question “what” but also the
question “why” so that the research results can
be implemented in the real world.
REFERENCES
Asri, M., 2003. Ketidakrasionalan Investor di
Pasar Modal [Investor’s Irrationality in
Stock Exchange]. Speech at Inauguration of Professor at Faculty of Economics, Universitas Gadjah Mada, December 6th, 2003.
Atkinson, R. L., R. C. Atkinson, E. E. Smith, and D. J. Bem, 2003. Pengantar Psikologi [Introduction to Psychology], 11th ed. Batam: Interaksa.
Bajtelsmit, V. L., and J.L. Vanderhei, 1997. “Risk Aversion and Pension Investment Choices”, inM. S. Gordon, O. S. Mitchell, and M. M. Twinney. Positioning Pensions For The Twenty-First Century.
Barberis, N. and M. Huang, 2001. “Mental Accounting, Loss Aversion, and Individ-ual Stock Returns”. The Journal of Fi-nance, 56 (4), 1247-1292.
Bauman, W. S., 1977. “Scientific Investment Analysis: Science or Fiction?”. Financial Analyst Journal, 23 (1), 93-97.
Benartzi, S., and R. H. Thaler, 1995. “Myopic Loss Aversion and the Equity Premium Puzzle”. Quarterly Journal of Economics,
110, 73–92.
Benzion, U., and J. Yagil, 2003. “Portfolio Composition Choise: A Behavioral Ap-proach”. Journal of Behavioral Finance, 4 (2), 85-95.
Burrel, O. K., 1951. “Possibility of an Experi-mental Approach to Investment Studies”.
Journal of Finance, 6, 211-219.
Byrnes, J.P., 1998. The Natural And Develop-ment of Decision-Making: A Self-Regula-tion Model. Mahwah, NJ: L. Erlbaum Associates.
Cohn, R. A., W. G. Lewellen, R. C. Lease, and G. G. Schlarbaum, 1975. “Individual In-vestor Risk Aversion and Invesment Port-folio Compotition”. Journal of Finance,
30 (2), 605-620.
Cooper, D. R., and P. S. Schindler, 2006. Me-tode Riset Bisnis [Business Research Method], 1st ed. Jakarta: PT Media Global Edukasi.
Dwyer, P.D., J.H. Gilkeson, and J. A. List, 2002. “Gender Differences in Revealed Risk Taking: Evidence From Mutual Fund Investors”. Economics Letters, 76 (2), 151-158.
Elster, J., 1998. “Emotions and Economic Theory”. Journal of Economic Literature, 36(1), 47-74.
Felton, J., B. Gibson, and D. M. Sanbonmatsu, 2003. “Preference For Risk in Investing as a Function of Trait Optimism and Gender”.
Journal of Behavioral Finance, 4(1), 33-40.
Ghozali, I., 2007. Aplikasi Analisis Multivari-ate dengan Program SPSS [Application of Multivariate Analysis with SPSS Pro-gram]. Semarang: Badan Penerbit Univer-sitas Diponegoro.
Gneezy, U., A. Kapteyn, and J. Potters, 2003. “Evaluation Periods and Asset Prices in a Market Experiment”. Journal of Finance,
58, 821–838.
Gneezy, U., and J. Potters, 1997. “An Experi-ment on Risk Taking and Evaluation Periods,” Quarterly Journal of Economics,
112, 631–645.
Haigh, M. S., and J. A. List, 2005. “Do Profes-sional Traders Exhibit Myopic Loss Aver-sion? An Experimental Analysis”. The Journal Of Finance, 60(1), 523-534. Hair, J.F. Jr., W.C. Black, B.J. Babin, and R.E.
Anderson, 2010. Multivariate Data Analy-sis: A Global Perspective, 7th ed. NJ: Pearson Prentice Hall.
Hinz, R.P., D.D. McCarthy, and J.A. Turner. 1997. “Are Women Conservative Inves-tors? Gender Differences in Participant-Directed Pension Investment”, in Posi-tioning for The Twenty- First Century,
Philadelphia, PA: University of Pensylva-nia Press.
Isaac, S. and W. B. Michael, 1990. Handbook in Research and Evaluation, 2nd ed. California: Edith Publishers.
Jaggia, S., and S. Thosar, 2000. “Risk Aver-sion and the Investment Horizon: A New Perspective on the Time Diversification Debate”. Journal of Psychology and Financial Markets, 1 (3-4), 211-215. Kahneman, D., and A. Tversky, 1979.
“Pros-pect Theory: An Analysis of Decision Un-der Risk”. Econometrica, 47, 263–291.
Kahneman, D., J. L. Knetsch, and R. Thaler, 1990. “Experimental Test of the Endow-ment Effect and the Coase Theorem”.
Latipun, 2008. Psikologi Eksperimen [Phsyco-logy of Experiment], 2nd ed. Malang: UMM Press.
List, J. A., 2002. “Preference Reversals Of A Different Kind: the More is Less Phenomenon”. American Economic Re-view, 92, 1636–1643.
List, J. A., 2003. “Does Market Experience Eliminate Market Anomalies?”. Quarterly Journal of Economics, 118, 41–71.
List, J. A., 2004. “Neoclassical Theory Versus Prospect Theory: Evidence from the Mar-ketplace”. Econometrica, 72, 615–625.
Lo, A. W., and D. V. Repin, 2001. “The Psychology of Real Time Financial Risk Processing”. NBER Working Paper, Series no. 8508.
Mehra, R., and E. Prescott, 1985. “The Equity Premium: A Puzzle”. Journal of Monetary Economics, 15, 145–161.
Myers, A., and C.H. Hansen, 2001. Expe-rimental Psychology. USA: Wadsworth Thomson Learning.
Neuman, W. L., 2006. Social Research Meth-ods - Qualitative and Quantitative Ap-proaches, 6th ed. UK: Pearson Education. Novemsky, N., and D. Kahneman, 2005.
“How Do Intentions Affect Loss Aver-sion?”. Journal of Marketing Research, 42, 139-140.
Pompian, M. M., 2006. Behavioral Finance and Wealth Management – How to Build Optimal Portfolios that Account for Inves-tor Biases. USA: John Wiley & Sons, Inc. Premananto, G. C., and B. M. Purwanto, 2007.
Dalam Desain Eksperimental - Aplikasi Dalam Riset Ilmu Ekonomi, Manajemen Dan Akuntansi [In Experimental Design: Application of Economics, Management, and Accounting Research]. Yogyakarta: FORMADEGAMA.
Quattlebaum, O. M., 1988. “Loss Aversion: The Key to Determining Individual Risk”.
Journal of Financial Planning, 66-68.
Riley, W. B., and K. V. Chow, 1992. “Asset Allocation and Individual Risk Aversion”.
Financial Analysts Journal, 48(6), 32-37. Save-Soderbergh, J., 2003. “Essay on Gender
Differences in Economic Decision-Mak-ing”. Dissertation of Doctoral Program. Sweden: Stockholm Universitiy.
Schmidt, U., and H. Zank, 2005. “What is Loss Aversion?”. The Journal of Risk and
Uncertainty”, 30 (2), 157-167.
Siegel, J. J., and R. H. Thaler., 1997. “Anoma-lies the Equity Premium Puzzle,” Journal of Economic Perspectives, 11, 191 -200. Slovic, P., 1969. “Analyzing the Expert Judge:
a Study of a Stockbroker’s Decision Proc-ess”. Journal of Applied Psychology, 54, 4. Slovic, P., 1972. “Psychological Study of
Hu-man Judgment: Implication for Investment Decision Making”. Journal of Finance, 27, 4.
Slovic, P., and W. S. Bauman, 1972. “Analyz-ing the Use of Information in Investment Decision Making: A Methodological Pro-posal”. The Journal of Business, 45 (2), 283-301.
Starmer, C., 2000. “Developments in Non-Expected Utility Theory: The Hunt for A Descriptive Theory of Choice Under Risk”. Journal of Economic Literature, 38, 332–382.
Thaler, R. H., 1985. “Mental Accounting and Consumer Choice”. Marketing Science, 4, 199–214.
Thaler,R. H., A. Tversky, D. Kahneman, and A. Schwartz, 1997. “The Effect of Myopia and Loss Aversion on Risk Taking: An Experimental Test”. Quarterly Journal of Economics, 112, 647–661.
Thaler, R. H., 1999. “Mental Accounting Mat-ters”. Journal of Behavioral Decision Making, 12, 183-206.
Tversky, A., and D. Kahneman, 1992. “Ad-vances in Prospect Theory Cumulative Representation of Uncertainty”. Journal of Risk and Uncertainty, 5, 297-323.
Tversky, A., and D. Kahneman, 1991. “Loss Aversion in Riskless Choice: A Refer-ence-Dependent Model”. The Quarterly Journal of Economics, 1039-1061. Uyanto, S. S., 2006. Pedoman Analisis Data
dengan SPSS [Mannual of Data Analysis using SPSS]. Yogyakarta: Graha Ilmu. Watson, J., and M. McNaughton, 2007.
“Gen-der Differences in Risk Aversion and Ex-pected Retirement Benefits”. Financial Analysts Journal, 63 (4), 52-62.
Zuckerman, M., 1994. Behavioral Expressions and Biosocial Bases of Sensation Seeking.