Influence of gap size and soil properties on microbial biomass in a
subtropical humid forest of north-east India
A. Arunachalam
∗and Kusum Arunachalam
Restoration Ecology Laboratory, North Eastern Regional Institute of Science and Technology, Nirjuli-791109, Arunachal Pradesh, India
Received 10 August 1999. Accepted in revised form 19 April 2000
Key words: microclimate, microbial biomass, soil, subtropical humid forest, treefall gaps, understorey
Abstract
We examined the effects of treefall gap size and soil properties on microbial biomass dynamics in an undisturbed mature-phase humid subtropical broadleaved forest in north-east India. Canopy gaps had low soil moisture and low microbial biomass suggesting that belowground dynamics accompanied changes in light resources after canopy opening. High rainfall in the region causes excessive erosion/leaching of top soil and eventually soil fertility de-clines in treefall gaps compared to understorey. Soil microbial population was less during periods when temperature and moisture conditions are low, while it peaked during rainy season when the litter decomposition rate is at its peak on the forest floor. Greater demand for nutrients by plants during rainy season (the peak vegetative growth period) limited the availability of nutrients to soil microbes and, therefore, low microbial C, N and P. Weak correlations were also obtained for the relationships between microbial C, N and P and soil physico–chemical properties. Gap size did influence the microbial nutrients and their contribution to soil organic carbon, total Kjeldhal nitrogen and available-P. Contribution of microbial C to soil organic carbon, microbial N to total nitrogen were similar in both treefall gaps and understorey plots, while the contribution of microbial P to soil available-P was lower in gap compared to the understorey. These results indicate that any fluctuation in microbial biomass related nutrient cycling processes in conjunction with the associated microclimate variation may affect the pattern of regeneration of tree seedlings in the gaps and hence be related with their size.
Introduction
Natural treefalls are the major small-scale disturb-ances in mature forests in the humid tropical and subtropical regions, and the gaps created in the forest canopy by this event are an important factor in main-taining the high species diversity by increasing envir-onmental heterogeneity and altering abundances and distribution of abiotic and biotic resources (Clark, 1990; Connell, 1978; Denslow, 1987). Most studies of gaps have addressed vegetation dynamics, regener-ation through seedling establishment, effect of micro-climatic variables on the revegetation, etc. and in general have concentrated on aboveground processes (see Meer et al., 1994). Relatively few studies have
∗ FAX No: 360244307. E-mail: [email protected]
addressed belowground effects of canopy gaps such as soil-related aspects and their effects on the reve-getation process after disturbance (Arunachalam et al., 1996).
The mass of litter and fine roots on the forest floor is generally less under canopy gaps than more in closed canopy site (Bariket al., 1992; Ostertag, 1998), while Sanford Jr. (1989) observed no difference in fine root biomass between canopy gap and under-storey. Earlier, we also reported insignificant changes in dry matter, carbon (C) and nitrogen (N) accumula-tion in litter and fine roots and in microbial biomass between natural gaps and understorey plots of a Pinus
kesiya Royle ex. Gordon forest in north-eastern India
adequate attention of foresters and ecologists. Never-theless, there have been a few studies evaluating the dynamics of this important component in varieties of ecosystems exposed to varied disturbances (e.g. Ar-unachalam et al., 1994; Hernot and Robertson, 1994; Maithani et al., 1996). The present study was designed (1) to determine the effects of canopy gaps on micro-bial carbon (C), -nitrogen (N) and -phosphorus (P), and (2) whether or not the consequences of canopy gap formation are dependent on soil properties, and (3) to evaluate the effects of gap size on soil and micro-bial nutrient dynamics in a ‘sacred grove’, the climax vegetation of the humid subtropics of north-east India.
Methods
Study area
The study was conducted in a ‘sacred grove’ (sub-tropical wet hill forest) at Mawphlang (1700 m asl), 30 km south-east of Shillong (25◦ 34′ N, 91◦ 56′ E) in Meghalaya, north-eastern India. The climate of the area is monsoonic with an average annual rainfall of 2500 mm, distributed over five months (May–September) of the year. The periods October–November, December–February and March– April represent autumn, winter and spring seasons, respectively. The mean minimum and maximum air temperatures during the study period were 3◦and 16◦ C. The soils derived from underlying gneisses, schists and granites and is grouped under the latosol (oxisol) type (Pascoe, 1950).
The forest stand covers an area of about 150 ha. It has been left undisturbed due to religious believes of the local people and represents the climax veget-ation of the area. Gap formveget-ation is frequent in this forest mainly by uprooted trees (Rao et al., 1990). The forest canopy is dominated by Quercus
grif-fithii Miquel, Lithocarpus dealbatus (Miquel) Rehder
(=Quercus dealbata), Quercus glauca Thumb. Bl. and Schima khasiana Dyer, while Symplocos
chinen-sis (Lour) Druce and Daphne shillong Banerjee are
the main shrub components. The diameter at breast height (DBH) of the trees in the forest ranged from 10 to 60 cm. In a study, Rao et al. (1990) reported 16 tree species, 16 shrubs and 28 herbaceous species in this forest. The density of tree species was 1050 stems ha−1, while for shrubs it was plants 560 ha−1
and 274 000 plants ha−1for herbs. There is a heavy
growth of large number of species of epiphytic orch-ids, mosses, ferns and lianes in the forest. Further
details may be obtained from Rao et al. (1990, 1997) and Barik et al. (1992).
Gap identification and experimental layout
The gap was considered as an opening in the forest extending down through all foliage levels to an aver-age height of 2 m above the ground (Brokaw, 1982). Barik et al. (1992) reported that the distribution of 20–100 m2gaps were more frequent in this forest. About 58% of the total number of gaps they identified were out of single treefall, 17% out of multiple tree falls, 25% by branch fall. However, on an area basis, multiple treefalls occupied 55% of the total gap area (3040 m2) and it was observed that the mean number of gaps ha−1 was 0.24 and the gap size was 253.5 m2. For this study, all the gaps larger than 20 m2, originating from either single or multiple treefalls or branch falls were identified. The gap sizes were cal-culated following Simpson’s rule as given in Rao et al. (1997): Area = 1/3h [(Yo+Yn)+4(Y1+Y3. . . +Yn-1)+2(Y2+Y4. . .+Yn-2)], where Y is the length of the chord, h is the distance between the chords and n is the number of chords. A chord represents the length between two points lying opposite to each other on the canopy edge in a gap. In the present study, an even number of parallel chords were laid at a prede-termined distance (0.5 m) in each gap and their length was measured to determine the gap area. Six gaps of different sizes identified in the experimental area were selected for the present study and have been numbered in ascending order of their size. Area of each gap was as follows: Gap 1 – 35.3 m2(3–4 years old), Gap 2 – 70.3 m2(4–8 years old), Gap 3 – 144.7 m2(5–10 years old), Gap 4 – 306.9 m2(5–10 years old), Gap 5 – 793.1 m2(>10 years old) and Gap 6 – 981.8 m2(>10 years old). Each gap site was paired with a closed canopy understorey site, located 25–30 m from an edge of the treefall gap.
Measurement of microclimatic variables
and air temperature were measured using a thermo-hygrometer (TFA, Germany). Soil temperature was measured using a soil thermometer (ELITE) and litter thickness using a millimeter scale.
Study of soil characteristics
Five replicated samples of soil were collected from 0 to 10 cm depth in each gap during winter, spring, rainy and autumn seasons in each gap and its ad-jacent understorey using a steel corer (6.5 cm inner diameter). The replicated samples of a given gap and the understorey were mixed separately thoroughly to obtain composite samples for further analysis. The soil samples were sieved through 2 mm mesh screen and divided into two parts, one part was used in field moist condition to determine microbial C, N and P, and soil moisture, pH and available-P and the other part was air-dried for the determination of texture, organic-C (SOC), total Kjeldhal-N (TKN) and total-P. Physico-chemical properties of the soil were determ-ined following standard procedures given in Allen et al. (1974) and Anderson and Ingram (1993). Microbial N and P were estimated by chloroform-fumigation-extraction method (Brookes et al., 1982, 1984), while microbial C by the chloroform-fumigation-incubation method (Jenkinson and Powlson, 1976) with some minor modifications as suggested by Srivastava and Singh (1988). The data presented are the means of three replicate determinations on seasonal basis and the data have been expressed on an oven-dry weight basis.
Soil samples were also collected asceptically in sterilized polythene bags from the top 0 to 10 cm layer in all gaps and understories and were used for the isolation of bacteria and fungi within 24 h. Soil bac-terial population was estimated by Waksman’s (1952) method using the nutrient agar medium at 105 di-lution. Fungal population was estimated by dilution plate technique (Johnson and Curl, 1972) using Martin Rose Bengal agar medium at 103dilution in deionized water. The inoculated Petri-dishes were incubated at 30±1 ◦C for 24 h and at 25±1 ◦C for 5 days for bacteria and fungi, respectively.
Statistical analysis
Tukey’s test was carried out to compare the mean val-ues of physico-chemical properties and microbial C, N and P between gaps and understories. LSD at 0.05 level was worked out to determine the variations in
different parameters studied between gaps and under-storey. Linear regressions were worked out following Zar (1974) to find out the influence of gap size on mi-crobial C, N and P, the relationships between mimi-crobial biomass and soil properties and also among microbial C, N and P.
Results
Light intensity and air temperature were significantly (P<0.05) higher in gaps than in understorey (Table 1). Soil moisture was more or less the same in gaps and understorey. On the other hand, the thickness of litter was significantly (P<0.05) higher in the understorey in comparison to gaps. The light intensity showed a gradual increase with the increasing size of the gap, whereas the thickness of the litter on the soil surface showed a reverse trend (Table 1). Air temperature was similar in all the gap size categories.
Texture of the soil remained sandy loam in both understories and gaps. Bulk density averaged 1.11 g cm3. Soil pH was slightly lower (3%) in the un-derstorey. Water holding capacity (WHC), organic-C (SOC), total Kjeldhal-N (TKN) and available-P ten-ded to decrease with increasing gap size; higher or similar values were generally observed in the under-storey, except for available-P for which the lower values were observed in the understorey plots except Gap 6 (Table 1).
The bacterial population showed a gradual increase with increase in gap size, while no definite trend was observed for fungal population. Both the populations were higher during rainy season when compared to cool and dry winter. However, in the understorey they showed a reverse trend only in case of bacterial popu-lation; it was maximum during dry winter than during wet rainy season (Table 2).
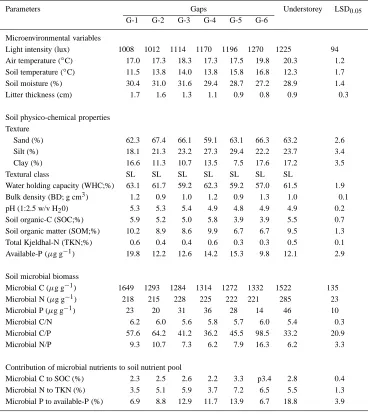
Table 1. Microenvironmental variability, physico-chemical and biological characteristics of soil in gaps and understorey
Parameters Gaps Understorey LSD0.05
G-1 G-2 G-3 G-4 G-5 G-6
Microenvironmental variables
Light intensity (lux) 1008 1012 1114 1170 1196 1270 1225 94 Air temperature (◦C) 17.0 17.3 18.3 17.3 17.5 19.8 20.3 1.2 Soil temperature (◦C) 11.5 13.8 14.0 13.8 15.8 16.8 12.3 1.7 Soil moisture (%) 30.4 31.0 31.6 29.4 28.7 27.2 28.9 1.4
Litter thickness (cm) 1.7 1.6 1.3 1.1 0.9 0.8 0.9 0.3
Soil physico-chemical properties Texture
Sand (%) 62.3 67.4 66.1 59.1 63.1 66.3 63.2 2.6
Silt (%) 18.1 21.3 23.2 27.3 29.4 22.2 23.7 3.4
Clay (%) 16.6 11.3 10.7 13.5 7.5 17.6 17.2 3.5
Textural class SL SL SL SL SL SL SL
Water holding capacity (WHC;%) 63.1 61.7 59.2 62.3 59.2 57.0 61.5 1.9 Bulk density (BD; g cm3) 1.2 0.9 1.0 1.2 0.9 1.3 1.0 0.1
pH (1:2.5 w/v H20) 5.3 5.3 5.4 4.9 4.8 4.9 4.9 0.2
Soil organic-C (SOC;%) 5.9 5.2 5.0 5.8 3.9 3.9 5.5 0.7 Soil organic matter (SOM;%) 10.2 8.9 8.6 9.9 6.7 6.7 9.5 1.3 Total Kjeldhal-N (TKN;%) 0.6 0.4 0.4 0.6 0.3 0.3 0.5 0.1 Available-P (µg g−1) 19.8 12.2 12.6 14.2 15.3 9.8 12.1 2.9
Soil microbial biomass
Microbial C (µg g−1) 1649 1293 1284 1314 1272 1332 1522 135
Microbial N (µg g−1) 218 215 228 225 222 221 285 23
Microbial P (µg g−1) 23 20 31 36 28 14 46 10
Microbial C/N 6.2 6.0 5.6 5.8 5.7 6.0 5.4 0.3
Microbial C/P 57.6 64.2 41.2 36.2 45.5 98.5 33.2 20.9
Microbial N/P 9.3 10.7 7.3 6.2 7.9 16.3 6.2 3.3
Contribution of microbial nutrients to soil nutrient pool
Microbial C to SOC (%) 2.3 2.5 2.6 2.2 3.3 p3.4 2.8 0.4 Microbial N to TKN (%) 3.5 5.1 5.9 3.7 7.2 6.5 5.5 1.3 Microbial P to available-P (%) 6.9 8.8 12.9 11.7 13.9 6.7 18.8 3.9
Note: Values are the means of four seasonal samplings; (n=12).
in gaps 3 and 4, and showed a significant (P<0.05) decline with further increase in gap size (Table 1).
The contribution of microbial C to soil organic-C rainged from 2.15 to 3.41%. The mean contribution was slightly greater in the understorey when com-pared to gaps. The contribution of microbial N to total Kjeldhal-N ranged between 3.46 and 7.15% in gaps and between 4.52 and 6.16% in understorey. The contribution of microbial P to total soil phosphorus in-creased gradually with the increasing size of the gap, and significantly declined in gap 6 (Table 1).
Microbial C, N and P all showed strong positive correlations with the soil moisture, soil temperature, air temperature, thickness of litter layer and light in-tensity in both gaps and understories (Table 4). Soil properties such as clay content, WHC, pH, SOC, TKN and available-P also exerted a greater influence on microbial nutrients.
Table 2. Bacteria and fungal population in the gaps and understorey plots
Parameters/ Gaps Understorey LSD0.05
season G-1 G-2 G-3 G-4 G-5 G-6
Bacteria population (no. of colonies×104per gram dry soil)
Winter 3.1 2.9 3.8 3.4 3.2 7.3 5.9 1.72
Rainy 0.8 1.8 3.1 4.8 5.0 10.9 11.2 4.14
LSD0.05 1.1 0.5 0.3 0.7 0.9 1.7 2.6
Fungal population (no. of colonies×103per gram dry soil)
Winter 2.1 1.8 1.2 1.3 2.8 4.8 5.2 1.71
Rainy 10.1 8.2 16.1 7.1 2.1 6.2 7.5 3.94
LSD0.05 4.0 3.2 7.4 6.0 0.3 0.6 1.1
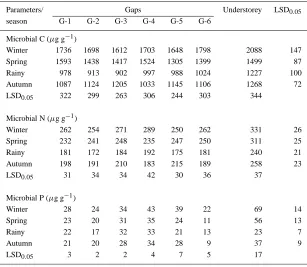
Table 3. Seasonal variation in microbial nutrients (n=3)
Parameters/ Gaps Understorey LSD0.05
season G-1 G-2 G-3 G-4 G-5 G-6
Microbial C (µg g−1)
Winter 1736 1698 1612 1703 1648 1798 2088 147
Spring 1593 1438 1417 1524 1305 1399 1499 87
Rainy 978 913 902 997 988 1024 1227 100
Autumn 1087 1124 1205 1033 1145 1106 1268 72
LSD0.05 322 299 263 306 244 303 344
Microbial N (µg g−1)
Winter 262 254 271 289 250 262 331 26
Spring 232 241 248 235 247 250 311 25
Rainy 181 172 184 192 175 181 240 21
Autumn 198 191 210 183 215 189 258 23
LSD0.05 31 34 34 42 30 36 37
Microbial P (µg g−1)
Winter 28 24 34 43 39 22 69 14
Spring 23 20 31 35 24 11 56 13
Rainy 22 17 32 33 21 13 23 7
Autumn 21 20 28 34 28 9 37 9
LSD0.05 3 2 2 4 7 5 17
(P<0.01) correlated to gap size (Table 5). Although the bacterial population showed positive relationship with gap size, the fungal population showed a insig-nificant negative correlation. Nevertheless, gap area could not show any impact on soil properties for which the relationship proved to be insignificant (Table 5).
Discussion
Table 4. Correlation coefficients (‘r’) for the relationship of microbial biomass with microclimate and soil variables
Parameters Understorey (n=6) Gaps (n=6)
Microbial C Microbial N Microbial P Microbial C Microbial N Microbial P
Light intensity (lux) 0.528∗ 0.585∗ 0.708∗∗∗ 0.528∗ 0.585∗∗ 0.708∗∗ Air temperature (◦C) 0.698∗∗∗ 0.753∗∗∗ 0.657∗∗ 0.368 0.465∗ 0.517∗ Soil temperature (◦C) 0.609∗∗ 0.555∗ 0.580∗ 0.712∗∗∗ 0.756∗∗∗ 0.741∗∗∗ Soil moisture (%) 0.765∗∗∗ 0.748∗∗∗ 0.690∗∗ 0.764∗∗∗ 0.728∗∗∗ 0.666∗∗ Litter thickness (cm) 0.558∗ 0.565∗ 0.448∗ 0.607∗∗ 0.614∗∗ 0.597∗∗ Clay (%) 0.685∗∗ 0.649∗∗ 0.575∗∗ 0.726∗∗ 0.679∗∗ 0.619∗∗
Water holding capacity (%) 0.863∗∗∗ 0.903∗∗∗ 0.862∗∗∗ 0.715∗∗∗ 0.718∗∗ 0.808∗∗∗ pH (1:2.5 w/v H2O) 0.611∗∗ 0.614∗∗ 0.551∗ 0.635∗∗ 0.605∗∗ 0.605∗∗ Soil organic matter (%) 0.724∗∗∗ 0.693∗∗∗ 0.799∗∗∗ 0.569∗ 0.581∗∗ 0.794∗∗∗ Total Kjeldhal-N (%) 0.544∗ 0.478∗ 0.561∗ 0.508∗ 0.487∗ 0.541∗ Available-P (µg g−1) 0.854∗∗∗ 0.872∗∗∗ 0.871∗∗∗ 0.578∗∗ 0.611∗∗ 0.728∗∗∗
∗∗∗P<0.001;∗∗P<0.01;∗P<0.05.
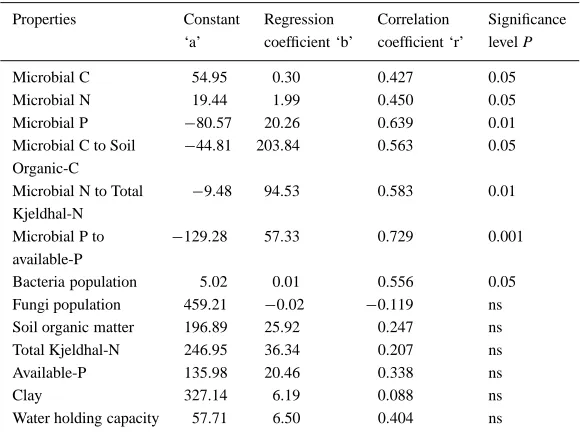
Table 5. Relationship between gap size and microbial and soil properties (n=6) Properties Constant Regression Correlation Significance
‘a’ coefficient ‘b’ coefficient ‘r’ level P
Microbial C 54.95 0.30 0.427 0.05
Microbial N 19.44 1.99 0.450 0.05
Microbial P −80.57 20.26 0.639 0.01
Microbial C to Soil −44.81 203.84 0.563 0.05 Organic-C
Microbial N to Total −9.48 94.53 0.583 0.01 Kjeldhal-N
Microbial P to −129.28 57.33 0.729 0.001 available-P
Bacteria population 5.02 0.01 0.556 0.05 Fungi population 459.21 −0.02 −0.119 ns Soil organic matter 196.89 25.92 0.247 ns
Total Kjeldhal-N 246.95 36.34 0.207 ns
Available-P 135.98 20.46 0.338 ns
Clay 327.14 6.19 0.088 ns
Water holding capacity 57.71 6.50 0.404 ns
ns - not significant.
accompanied changes in light resources after canopy opening and also less evaporation. Evidently, the light intensity was significantly (P<0.05) higher in gaps contributing to high air and soil temperatures in the forest microenvironment. The above microclimatic factors initially, i.e. just after tree/branch fall, must have facilitated the rapid decomposition process on the forest floor (Arunachalam et al., 1996), and thereby the reducing the litter layer, as evidenced by a sig-nificant decline in litter layer thickness in the gaps (Table 1). Seasonal variation in these variables was
also noticed in all gaps, but it was more prominent in the larger gaps.
Chandrasekhara and Ramakrishnan (1994) in a humid tropical forest of Kerala, India. On the contrary, we had earlier reported no significant differences between the gaps (=263 m2) and understorey in a 22-year old
Pinus kesiya forest in a locality that is 30 km away
from the present study site. A close correlation was observed between SOM content and WHC in both gaps and understorey plots. This indicates the sig-nificance of the fall, accumulation and turnover of detrital matter like litter and fine roots on the forest floor in maintaining the soil moisture level. In gaps of smaller size (Gaps 1, 2 and 3), the pH was signific-antly (P<0.05) higher (5.28–5.40) than in the larger gaps (Gap 4, 5 and 6; 4.76–4.95). Low pH in larger gaps might have been the result of potential loss of plant nutrients through leaching and/or greater expos-ure to direct insolation in the larger canopy openings. However, average pH for gaps and understorey plots did not vary significantly (5.09 and 4.94). In south-western Nigeria, the organic matter content in the top soil approached that of the control (mature forest) by the end of the 10th year of secondary succession after disturbance (Aweto, 1981). The case with the gaps are quite different in a sense that even the 10 year old gaps like G-5 and G-6 (6.71%) could not restore its average organic matter level of the understorey plots (9.46%), though every fluctuation in this regard might be the outcome of the interactive influence of the environ-mental heterogeneity and resource quality of litter of different sizes due to canopy openings. In this study, not any significant relationship between gap size and soil physico–chemical properties (r=0.088–0.404) was accomplished. Nevertheless, the decrease in SOC in gaps is due probably to a combination of increased decomposition of SOM because of soil disturbance during tree/branch fall and increased soil temperature with reduced shading, low input of organic material when regrowth was still small and erosion of top soil.
Soil microbial populations varied seasonally in both gaps and understorey. In general, the bacterial and fungal populations were greater in the under-storey, which is attributed to greater soil organic matter (SOM). Low population in the gaps could be due to less litter on the forest floor, high light in-tensity and relatively low SOM. Nevertheless, the low microbial population during winter could be due to prevailing low temperature and greater physiological water stress which affect the microbial growth and its activity. On the other hand, greater population of bac-teria and fungi during rainy season could be due to favourable moisture and temperature conditions
dur-ing these periods when the litter decomposition rate is at is peak (Das et al., 1997). Mean bacterial population was greater in larger gaps, while fungi were greater in smaller gaps. This contrast result envisages that the light and moisture requirements of these two micro-bial groups are slightly different and warrants more detailed study to confirm this observation.
There was distinct seasonal variation in microbial biomass in this study both in gaps and understorey plots with a trough during rainy season and a peak during winter. This observation fully corroborates our earlier reports in a disturbed (selectively felling) ‘Shil-long peak sacred grove’ (1900 m asl), 13 km away from the present study site. However, it is different from those reported in tropical dry deciduous forest, savanna and temperate pastures where peak values for microbial biomass were recorded during early spring or summer (Sarathchandra et al., 1984; Singh et al., 1989). Peak microbial biomass during winter when the air and soil temperatures were low indicated periods of low microbial activity and greater nutrient retention in soil microbial biomass. In contrast, lower values of microbial C, N and P during rainy season when tem-perature and soil moisture conditions were favourable for the microbial activity indicated a period of rapid mineralization in soil (Maithani et al., 1998). Relat-ively greater demand for nutrients by plants during the rainy season when the majority of them are at their peak vegetative growth, further limited the availab-ility of nutrients to soil microbes, thereby reducing their immobilization in microbial biomass (Singh et al., 1991). The microbial C values obtained in the present study was in the higher order of the range (61– 2000 µg g−1) reported by Vance et al. (1987) and
Hernot and Robertson (1994) for various temperate and tropical forest soils and during peak seasons, the biomass C exceeded the range (upto 2205 µg g−1) as observed in the understorey of this mature/climax vegetation of the locality. Relatively dense growth of plants vis-a-vis greater accumulation of litter and fine roots in the understorey plots will have favoured the growth of microbial populations and accumula-tion of C in the microbial biomass. Nevertheless, the mean values recorded in a ground-fire affected mature broadleaved forest (1040–1532µg g−1; Arunachalam et al., 1994) were significantly lower as compared to this study. In a 22-year old Pinus kesiya forest, we had estimated microbial C varying from 56 to 294µg g−1 which are 10–40 times lower than that
species composition and physiographic conditions on microbial nutrient dynamics. However, the confound-ing effect of soil properties could not be excluded. As most of the N exists in organic compounds and heterotrophic microbes which utilize organic-C for en-ergy in soil, the dynamics of N in mineral soil is closely linked to that of C. This is substantiated by similar seasonal trends of microbial C and N. The values obtained for microbial N in the present case were in the higher order of the range reported by Diaz-Ravina et al. (1988) for soils of broadleaved deciduous (132–240 µg g−1) and evergreen (42–242 µg g−1) forests, whereas it exceeded the values reported by Martikainen and Palojarvi (1990) for coniferous forest soils (52–125µg g−1). However, during peak periods, the values exceeded the upper limit of the range for both microbial N and P. The microbial P values re-gistered a maximum value of 74.81µg g−1and a
min-imum of 9.23µg g−1, which also slightly exceeded
the range, 5.3–67.2 µg g−1 reported by Brookes et al. (1984) for arable land, grassland and woodland soils. Significant positive correlation among micro-bial nutrients (micromicro-bial C ×microbial N, r=0.478l; microbial C×microbial P, r=0.495; microbial N × microbial P, r=0.555; df.=35, P<0.001) suggests that the dynamics of these nutrients are closely related to each other. Here again, the interactive influence of soil nutrient status could not be excluded. There were significant positive relationships between clay content, SOM, TKN and available-P, and all three microbial nutrients (Table 4).
Joergensen et al. (1995) reported that above soil pH 5.0, microbial C/N ratio vary within a narrow range. Our study fully corroborates the contention, as the C/N ratios varied between 5.6 and 6.18 in the gaps and between 5.07 and 5.84 in the understorey plots and are well within the optimum range (5–8) sugges-ted by the above authors. Such a low fluctuation in C/N ratio between gaps of different sizes and under-storey plots indicates that the microbial biomass in this forest is dormant (Bremner and Van Kessel, 1992). C/P ratio in microbial biomass ranged 36.2–98.5 in gaps and 30.3–36.7 in the understorey; the values are very high compared with the range (10.6–35.9) repor-ted by Brookes et al. (1984). The significant increase in microbial C/P ratio in the understorey is due to a re-latively sharper increase in microbial C beneath closed canopy. Contrarily, we reported increased C/P ratios in microbial biomass in gaps and tree-cut plots of a Pinus
kesiya forest (Arunachalam et al., 1996).
As a percentage of total SOC, microbial C was very low (Table 1) and well within the range reported by Luizao et al. (1992) in tropical forests (1.5–5.3%), but it was high compared to that of temperate forests (1.8–2.9%; Vance et al., 1987). In acid organic soils, Williams and Sparling (1984) reported that the per-centage contribution of microbial N to TKN in soil varies from 2.8 to 9.8%, and our data is well within this range (3.76–7.15% in gaps; 4.62–6.18 in un-derstorey). The percentage contribution of microbial biomass to SOC and TKN in gaps and understorey were similar, whereas the contribution of microbial P to total soil-P was significantly (P<0.05) greater in the understorey plots (mean=18.76%) as compared with the gaps (mean=10.15%). A slightly higher con-tribution in the understorey shall be attributed to the presence of substantial amount of microbial nutrients, as it could be inferred from significantly greater SOC in these plots. This shows the importance of microbial P for P cycling in the forest soil. Furthermore, the microbial P content was on an average two times lar-ger than the content of NaHCO3-extractable inorganic
phosphate in gaps and four times in the understorey plots. In contradiction to the view that the inorganic-P pool is not determined by the size of the microbial P pool (Brookes et al., 1984), we observed a close cor-relation between microbial P and available-P content in soil.
Conclusions
Acknowledgements
Financial support received from the Indian Council of Forestry Research and Education, Dehua Dun and the Council for Scientific and Industrial Research, New Delhi is thankfully acknowledged. Thanks are due to Professor H.N.Pandey and Professor R.S.Tripathi for their useful comments.
References
Allen S E, Grimshaw H M, Parkinson J A and Quarnby C 1974 Chemical Analysis of Ecological Materials. Blackwell Scientific Publications, Oxford.
Anderson J M and Ingram J S I 1993 Tropical Soil Biology and Fertility-A Handbook of Methods. 2nd edn. CAB International, Wallingford, UK.
Aweto A O 1981 Secondary succession and soil fertility restoration in south-western Nigeria. II. Soil fertility restoration. J. Ecol. 69, 609–614.
Arunachalam A, Boral L and Maithani K 1994 Effects of ground-fire on nutrient contents in soil and litter in a subtropical forest of Meghalaya. J. Hill Res. 7, 13–16.
Arunachalam A, Maithani K, Pandey H N and Tripathi R S 1996 The impact of disturbance on detrital dynamics and soil microbial biomass of a Pinus kesiya forest in north-east India. For. Ecol. Managem. 88, 273–282.
Barik S K, Pandey H N, Tripathi R S and Rao P 1992 Microen-vironmental variability and species diversity in a subtropical broadleaved forest. Vegetatio 103, 31–40.
Bremner E and Van Kessel C 1992 Seasonal and microbial biomass dynamics after addition of lentil and wheat residues. Soil Sci. Soc. Am. J. 56, 1141–1146.
Brokaw N V L 1982 The definition of treefall gap and its effect on measures of forest dynamics. Biotropica 11, 158–160. Brookes P C, Powlson D S and Jenkinson D S 1982 Measurement
of microbial biomass phosphorus in soil. Soil Biol. Biochem. 14, 319–329.
Brookes P C, Powlson D S and Jenkinson D S 1984 Phosphorus in the soil microbial biomass. Soil Biol. Biochem. 16, 169–175. Chandrashekara U M and Ramakrishnan P S 1994 Vegetation and
gap dynamics of a tropical wet evergreen forest in the western ghats of Kerala, India. J. Trop. Ecol. 10, 337–354.
Clark D B 1990 The role of disturbance in the regeneration of neotropical moist forest. In Reproductive Ecology of Tropical Forest Plants. Eds. K S Bawa and M Hadeley. pp 291–315. MAB-UNESCO.
Connell J H 1978 Diversity in tropical rain forest and coral reefs. Science, 199, 1302–1310.
Das A K, Boral L, Tripathi R S and Pandey H N 1997 Nitrogen mineralization and microbial biomass-N in soil of a subtropical forest of Meghalaya, India. Soil Biol. Biochem. 29, 1609–1612. Denslow J S 1987 Tropical rainforest gaps and tree species diversity.
Ann. Rev. Ecol. Syst. 18, 431–451.
Diaz-Ravina M, Carballas T and Acea M J 1988 Microbial biomass and its metabolic activity in four acid soils. Soil Biol. Biochem. 20, 817–823.
Hernot J and Robertson G P 1994 Vegetation removal in two soils of the humid subtropics: Effect on microbial biomass. Soil Biol. Biochem. 26, 111–116.
Jenkinson D S and Powlson D S 1976 The effect of biocidal treat-ments on metabolism in soil – V. A method for measuring soil biomass. Soil Biol. Biochem. 8, 209–213.
Johnson L F and Curl E A 1972 Methods for the Research on Ecology of Soil-Borne Plant Pathogens. Burgess Publishing Co., Minneapolis, Minnesota.
Joergensen R G, Anderson T H and Wolters T 1995 Carbon and nitrogen relationships in the microbial biomass of soils in beech (Fagus sylvatica) forests. Biol. Fert. Soils 19, 141–147. Luizao R C C, Bonde T A and Rosswall T 1992 Seasonal variation
of microbial biomass – the effect of clear felling in a tropical rain forest and establishment of pasture of clearfelling in a tropical rain forest and establishment of pasture in the Central Amazon. Soil Biol. Biochem. 24, 805–813.
Maithani K, Tripathi R S, Arunachalam A and Pandey H N 1996 Seasonal dynamics of microbial C, N and P during regrowth of a disturbed subtropical humid forest in north-east India. Appl. Soil Ecol. 4, 31–37.
Maithani K, Arunachalam A, Tripathi R S and Pandey H N 1998 Influence of leaf litter quality on N mineralization in soils of subtropical humid forest regrowths. Biol. Fert. Soils, 27, 44–50. Martikainen P J and Palojarvi A 1990 Evaluation of the fumigation-extraction method for the determination of microbial C and N in a range of forest soils. Soil Biol. Biochem. 22, 797–802. Meer Van der P J, Bongers F, Chatrou L and Riera B 1994 Defining
canopy gaps in a tropical rain forest: Effects on gap size and turnover time. Acta Oecologica 15, 701–714.
Ostertag R 1998 Belowground effects of canopy gaps in a tropical wet forest. Ecology 79, 1294–1304.
Pascoe E H 1950 A Manual of the Geology of India and Burma, GSI, New Delhi.
Rao P, Barik S K, Pandey H N and Tripathi R S 1990 Community composition and tree population structure in a subtropical broad-leaved forest along a disturbance gradient. Vegetatio 88, 151– 162.
Rao P, Barik S K, Pandey H N and Tripathi R S 1997 Tree seed germination and seedling establishment in treefall gaps and un-derstorey in a subtropical forest of northeast India. Aust. J. Ecol. 22, 136–145.
Sanford Jr. R 1989 Fine root biomass under a tropical forest light gap opening in Costa Rica. J. Trop. Ecol. 5, 251–256.
Sarathchandra S V, Perrott K W and Upsdell M P 1984 Micro-biological and biochemical characteristics of a range of New Zealand soils under established pastures. Soil Biol. Biochem. 16, 177–183.
Srivastava S C and Singh J S 1988 Carbon and phosphorus in the soil biomass of some tropical soils of India. Soil Biol. Biochem. 24, 711–714.
Singh J S, Raghuvanshi A S, Singh R S and Srivastava S C 1989 Mi-crobial biomass acts as a source of plant nutrients in dry tropical forest and savanna. Nature (London) 399, 499–500.
Singh R S, Srivastava S C, Raghuvanshi A S, Singh J S and Singh S P 1991 Microbial C, N and P in dry tropical savanna: Effects of burning and grazing. J. Appl. Ecol. 28: 869–878.
Vance E D, Brookes P C and Jenkinson D S 1987 Microbial bio-mass measurements in forest soils: The use of the chloroform fumigation incubation method for strongly acid soils. Soil Biol. Biochem. 19, 697–702.
Waksman S A 1952 Soil Microbiology. John Wiley & Sons, New York.
Watt A S 1947 Pattern and process in the plant community. J. Ecol. 35, 1–22.
Williams B L and Sparling G P 1984 Extractable N and P in relation to microbial biomass in UK acid organic soils. Plant Soil 76, 139–148.
Zar J H 1974 Biostatistical Analysis. 2nd edn, Prentice-Hall, Engle-wood Cliffs, New Jersey.