Chapter
3
109
Job Satisfaction in Eight African Cities
Mireille Razafi ndrakoto and François Roubaud
Researchers from various disciplines have examined job satisfaction. Psychologists and sociologists have explored the role of job satisfaction in individuals’ mental balance; other researchers have also studied individual well-being taking a broader, multidisciplinary approach. Economists have studied job satisfaction with a view to improving the understanding of the match between the supply and demand of labor.1
Most work has focused on developed countries. Recent interest in this issue in developing countries stems largely from concerns about the quality of work-ing conditions, as seen from discussions at the International Labour Organiza-tion (ILO) and elsewhere on the concept of “decent work.”
Th e analysis in this chapter seeks to improve the understanding of labor market conditions in Sub-Saharan Africa. To the authors’ knowledge, only two studies (Falco, Maloney, and Rijkers 2011; Rakotomanana 2011) examine the broad determinants of job satisfaction in Africa.2
Empirical analyses confi rm the existence of negative links between job sat-isfaction and objective facts such as the decision to quit a job (Freeman 1978; Lévy-Garboua, Montmarquette, and Simonnet 1999; Clark 2001). Studies also show that job satisfaction is correlated with on-the-job behavior, including absenteeism and productivity (Judge and others 2001). Th ese fi ndings challenge the idea that individuals’ assessments of their satisfaction are purely idiosyn-cratic and economically irrelevant (pure “noise”).
Job satisfaction came to the fore with the rise in analyses of subjective well-being, especially research by Easterlin (2001, 2003) and Frey and Stutzer (2002). Th e importance of work in an individual’s life, for both the income it provides and its intrinsic value, makes job satisfaction a key component of well-being. Judge and Watanabe (1993) show that the causal link between job satisfaction and subjective well-being can run in both directions. Most empirical results, however, fi nd that job satisfaction aff ects well-being (Warr 1999).
Interest in job satisfaction is growing in the developed countries, and research on the issue is on the rise in transition economies. Studies on this theme are still
110 URBAN LABOR MARKETS IN SUB-SAHARAN AFRICA
rare, if not nonexistent, in developing countries, however, especially in Africa. Th e lack of research is surprising given that employment is the main source of income in these countries, and working conditions are oft en harsh; work is therefore particularly important in an individual’s life. Understanding how individuals assess their work—their earnings, working conditions, and intrinsic value placed on diff erent types of employment (fulfi llment, social recognition, participation/exclusion, and so forth)—is vital for evaluating labor markets.
Th is chapter is organized as follows. Th e fi rst section reviews the economic lit-erature on this subject. Th e second section presents the data used and describes the approach adopted. Th e third section provides a preliminary descriptive anal-ysis of job satisfaction in the eight African capitals studied.3 Th e fourth section presents and analyzes the results of the econometric estimations. Th e last section summarizes the main fi ndings and proposes avenues for further research.
Review of the Literature
Warr (1999) distinguishes between intrinsic and extrinsic job satisfaction. Intrinsic components include the opportunity to manage and supervise, the degree of autonomy, the use of capacities and skills, the variety of tasks, the absence of physical danger, the clarity of information on the professional envi-ronment, work relations, and social position. Extrinsic components include remuneration, working conditions, and job security.
Sousa-Poza and Sousa-Poza (2000) adopt the classifi cation used by Judge and Watanabe (1993) to compare job satisfaction in some 20 countries. Th ey adopt a bottom-up approach, assuming that various external factors aff ect job satisfaction. Job satisfaction is determined by the balance between work-role inputs (hours worked, eff ort, education) and work-role outputs (remuneration, nonwage benefi ts, status, opportunities for advancement, independence and self-direction, job security, job interest, social recognition, and relations with colleagues). Th is approach explains diff erences across countries in terms of the weight and relative importance of the two types of factors.
D’Addio, Eriksson, and Frijters (2003) look at the many criteria that come into play when assessing the quality of a job. Th ey identify another way of understanding satisfaction by distinguishing between the economic contract (in which the focus is on the relationship between eff ort and reward) and the psychological contract (in which the focus is on working conditions).
Much of the debate in the literature concerns how to interpret several key fi nd-ings. Th e fi rst is the relationship between income level and satisfaction, which is not obvious (Clark and Oswald 1996; Lévy-Garboua and Montmarquette 1984). A second issue is the relationship between objective job characteristics (working hours and work pace, leave, job security, job type) and job satisfaction levels.
JOB SATISFACTION IN EIGHT AFRICAN CITIES 111
Th e literature fi nds a weak correlation between these variables and job satisfac-tion (D’Addio, Eriksson, and Frijters 2003; Llorente and Macías 2005). Some fi ndings are counterintuitive: although women and the least educated generally have poorer-quality jobs, they are more inclined than other workers to report job satisfaction (Clark and Oswald 1996; Clark 1997; D’Addio, Eriksson, and Frijters 2003). Age also plays a role, with job satisfaction declining until about age 40 and then rising (Lévy-Garboua and Montmarquette 1984; Clark, Oswald, and Warr 1996).
Two factors may help explain these results. First, classic economic variables (such as wages and working hours) do not capture job quality. A wide range of other job characteristics, which surveys rarely measure, also aff ect satisfac-tion (see chapters 1, 4, and 5). Second, the level of self-reported satisfacsatisfac-tion depends on the individual’s aspirations, which are determined by various fac-tors, including social background and reference group. Th e closeness of the match between expectations and outcomes plays a decisive role in individual satisfaction levels. Based on an analysis of 19 countries in the Organisation for Economic Co-operation and Development (OECD), Clark (2004) observes that workers report that wages and working time are among the least important characteristics in rankings of what matters in a job. Factors such as promotion opportunities are considered very important. Job type, content, and interest and work relations are also important (Sousa-Poza and Sousa-Poza 2000; D’Addio, Eriksson, and Frijters 2003). Idson (1990) and Garcia-Serrano (2008) stress the importance of the work environment. Th ey fi nd less fl exibility and autonomy in large businesses and posit that this characteristic explains the lower level of satisfaction at large companies.
Th e many factors involved in evaluating job quality are also behind the diff er-ences in satisfaction by socioeconomic group, industrial sector, and institutional sector in some studies (Clark and Oswald 1996; D’Addio, Eriksson, and Frijters 2003; Beuran and Kalugina 2005). Beuran and Kalugina (2005) observe that in the Russian Federation, working in the informal sector increases well-being, despite lower average earnings, poor working conditions, job insecurity, and exclusion from the social security system. Razafi ndrakoto and Roubaud (2006) draw the same conclusion for African countries. In Madagascar, Rakotomanana (2011) shows that, everything else equal, levels of job satisfaction in the infor-mal sector and private forinfor-mal sector are not signifi cantly diff erent; public sec-tor employees are systematically the most satisfi ed. Using Ghanaian panel data, Falco, Maloney, and Rijkers (2011) fi nd that the informal sector and the formal sector (both private and public) provide similar levels of job satisfaction. Raza-fi ndrakoto, Roubaud, and Wachsberger (2012) Raza-fi nd the same result in Vietnam. Own-account workers—who may be more exposed to income instability— are more satisfi ed than wage earners (Blanchfl ower and Oswald 2004). Falco, Maloney, and Rijkers (2011) confi rm this pattern in urban Ghana. Th ese fi ndings
112 URBAN LABOR MARKETS IN SUB-SAHARAN AFRICA
confi rm the importance of factors such as self-direction and independence, fl ex-ibility, employment status, and the quality of work relations.
Some analyses fi nd that union members express less satisfaction than other workers (Freeman 1978; Clark 2004). Th is seemingly paradoxical result may be explained by the fi nding by Bryson, Cappelari, and Lucifora (2005) that people who join unions have the highest expectations of working conditions and are therefore harder to satisfy. Th eir expectations may stem from better knowledge of their rights (labor law) or from higher levels of individual aspirations.
Women, the least educated, and the youngest and oldest workers have lower (or downward revised) aspirations and are therefore more inclined to say they are satisfi ed with their job. Individual, especially psychological, characteristics, also aff ect overall subjective well-being and job satisfaction, with causality run-ning in both directions (Judge and Watanabe 1993; Warr 1999).
Diff erent interpretations have been posited to explain the weak correlation between income and job satisfaction. Cross-sectional analyses of subjective well-being show that once vital needs have been satisfi ed, the link between well-being and income is not strong (Easterlin 2001; Frey and Stutzer 2002). A large number of sociologists and psychologists have also looked at the role of culture, including both collective and individual values regarding work in general and certain types of work (Malka and Chatman 2003; Gelade, Dobson, and Auer 2008).
Various authors emphasize the importance of social interaction eff ects (“social comparison”). Clark and Oswald (1996) show the negative eff ect of the income of the reference group (estimated from the predicted income value based on the characteristics of the job and the individual). Relative income (the subjective perception of one’s income level compared with the income of one’s peers) has a greater eff ect on satisfaction than actual income amount (Clark 2004). Pichler and Wallace (2009) reach the same conclusion in an analysis of 27 European countries. Th ey show that, job and individual characteristics aside, the average level of earnings in a country infl uences the level of satisfaction.
A broader view is that not only the immediate environment but also the past and present context aff ect the formation of individual aspirations. Hamermesh (2001) points to the infl uence of changes in the socioeconomic context. Llorente and Macías (2005) draw on an analysis of some 20 countries to suggest that the fact that aspirations adjust with time and actual conditions indicates the weak correlation between objective variables and the level of satisfaction. Aspirations are revised downward or upward depending on the how the situation in a coun-try develops.
Many analyses study the weight of the past as a determinant of satisfaction (Lévy-Garboua and Montmarquette 1984; Clark and Oswald 1996; Hamermesh 2001). Employment history (mobility and experience) infl uences the formation
JOB SATISFACTION IN EIGHT AFRICAN CITIES 113
of individuals’ aspirations. Longitudinal analyses study the relationship between individuals’ employment trajectories and their level of satisfaction. Lack of sat-isfaction is found to be a good predictor of professional mobility, in particular of quitting or changing jobs (Freeman 1978; Lévy-Garboua, Montmarquette, and Simonnet 1999; Clark 2001; Kristensen and Westergård-Nielsen 2004).
As with the majority of analyses of perceptions (especially subjective well-being), uncertainty remains regarding the direction of causality. It is hard to deal with problems of endogeneity, especially when psychological factors simul-taneously aff ect the variables studied. For instance, optimistic people could feel intrinsically more satisfi ed and earn more because they are more dynamic or better appreciated by their boss or clients. Earning a good salary may be a source of satisfaction, but feeling satisfi ed may be a way to increase one’s wage (through promotions, for example). Th e nature of the data does not allow the causality path to be identifi ed.
Self-selection biases, linked to nonrandom labor market participation or sec-toral allocation, are also at play. Indeed, it could be said that people who work are people who can potentially derive the highest level of satisfaction from their job. Such a bias could prove important in explaining why women report satis-faction more oft en than men. Given these problems, the results in this chapter should be interpreted as statistical correlations, not causal impacts.
Data Used and Approach Taken
Th e DataTh e data for the analysis come from Phase 1 of the Programme d’Appui Régional à la Statistique (PARSTAT) regional program’s1-2-3 surveysof seven West African economic capitals (Abidjan, Bamako, Cotonou, Dakar, Lomé, Niamey, and Ouagadougou) and Antananarivo (Madagascar).4 Th ese surveys were conducted in 2001/02 using exactly the same methodology (Brilleau, Ouedraogo, and Roubaud 2005). Th e data are thus perfectly comparable. (For a description of the 1-2-3 surveys, see box O.1 in the overview.)
Th e surveys, which provide information on both individual characteristics (including trajectory elements) and objective characteristics of the jobs held, provide an extremely rich database for studying job satisfaction. Th e question used to capture satisfaction diff ers from the one usually put to address this sub-ject, which is generally “How satisfi ed are you with your main job?” Th e ques-tion in the 1-2-3 surveys, put to all respondents 15 and older, was “What are your employment plans for the future?” Th e answer categories were as follows: 1. Find a fi rst job, 2. Find a new job in the same fi rm (job promotion), 3. Find a new job in another fi rm, and 4. Keep the job you currently have or continue not to work. Given the diffi culty of ranking the categories using an ordinal scale,
114 URBAN LABOR MARKETS IN SUB-SAHARAN AFRICA
respondents were divided into two groups: people who want to keep their job/ employment status (category 4; that is, people who are presumably satisfi ed) and people who want to change their job (categories 1, 2, and 3; that is, people who are dissatisfi ed).5
Th e drawback to using a diff erent question than usual is that the results are not entirely comparable with the fi ndings presented in the literature. In addition, some workers may declare not wishing to change their position not because they are satisfi ed but because they have revised their aspirations down-ward. Th is criticism is not unique to the question included in this analysis; it applies to all subjective approaches (including the standard job satisfaction question). It should be kept in mind when interpreting the results, however.
Th e approach used here links satisfaction and aspirations. It also allows for the inclusion of job-seekers and inactive (in particular, discouraged) work-ers and hence assessment of the extent to which inactivity is voluntary or involuntary.
Methodological Approach and Model Tested
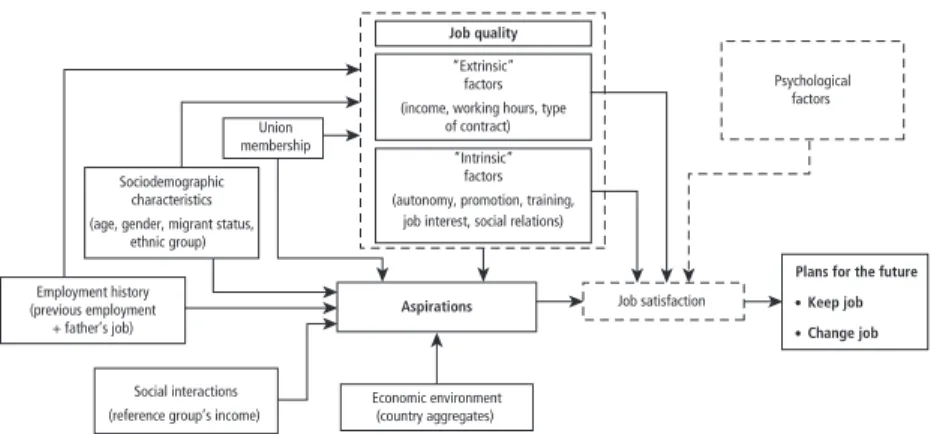
We identify the determinants of job satisfaction by combining the approaches focusing on the importance of aspirations and of (generally unobserved) intrin-sic work value factors (the possibility of promotion, training, autonomy, work relations) on the one hand and the classic objective working conditions vari-ables (remuneration, working hours), which procure extrinsic satisfaction, on the other. We use the classifi cation used by Warr (1999) to capture job quality (fi gure 3.1). Our hypothesis is that satisfaction exists when a job’s characteristics are well matched to the jobholder’s aspirations.
Figure 3.1 Model of Job Satisfaction
Plans for the future Keep job Change job Job satisfaction Aspirations Economic environment (country aggregates) Sociodemographic characteristics (age, gender, migrant status,
ethnic group)
Psychological factors
Social interactions (reference group’s income) Employment history
(previous employment + father’s job)
“Extrinsic” factors (income, working hours, type
of contract) Union
membership
“Intrinsic” factors (autonomy, promotion, training,
job interest, social relations) Job quality
JOB SATISFACTION IN EIGHT AFRICAN CITIES 115
Th e model we test is Sik = f(X1ik,X2ik, Ai),where Sik is the satisfaction of
individual i with job k; X1ik is the job’s extrinsic characteristics vector; X2ikis the job’s intrinsic characteristics vector; and Aiis the individual’s aspirations vector. X1ikcaptures earnings, fringe benefi ts, hours worked, and job security variables such as a written contract, status as a wage-earner, and steady work. Given the absence of accurate information on the majority of the factors relat-ing to the intrinsic value of the job, we use the followrelat-ing proxies for X2ik: variables on socioeconomic group (which typifi es job content); institutional sector (public, formal private, and informal sector); fi rm size; and presence of a union.
Taking the results obtained in the literature as a starting point, we assume that aspirations (Ai) are determined by the individual characteristics of indi-vidual i (gender, age, level of education, marital status, migrant status, and social background, including father’s level of education and employment) as well as by the characteristics of the individual’s reference group (reference group earnings = y*) and the socioeconomic context in the country (coun-try dummy). Aspirations are not perfectly controlled for: if sociodemographic variables do capture some sociological patterns, they are at best rough proxies of individual expectations.
Individual factors also infl uence the quality of the job held. For equal job characteristics, however, the signifi cance of individual factors in determining the level of satisfaction essentially refl ects the eff ect of aspirations. More gener-ally, we relax part of the endogeneity biases by introducing fi xed eff ects (coun-tries and households).
Because income relative to the reference group has a stronger eff ect than absolute income, rather than introduce individuals’ earnings levels, we use a variable that ranks individuals by the income centile to which they belong in their country (y/y* [earnings/average earnings in the country]). Th is option, adopted to overcome the problem of earnings comparability across countries, directly incorporates the comparative income eff ect and therefore one of the channels through which aspirations are determined. Th e two measurements are equivalent for the country models.
Th is approach provides a way to identify the nature and infl uence of the “intrinsic” job value factors, the more classic objective (“extrinsic”) variables, and the factors likely to infl uence aspirations. We do not seek to isolate the eff ect of psychological factors (which aff ect aspirations in particular), about which we have no information. However, if psychological factors are corre-lated with individual sociodemographic variables, they can at least partially be taken into account. At the same time, we can check the extent to which the stylized facts obtained in developed countries apply to the African cities considered here.
116 URBAN LABOR MARKETS IN SUB-SAHARAN AFRICA
Descriptive Findings on Satisfaction Levels
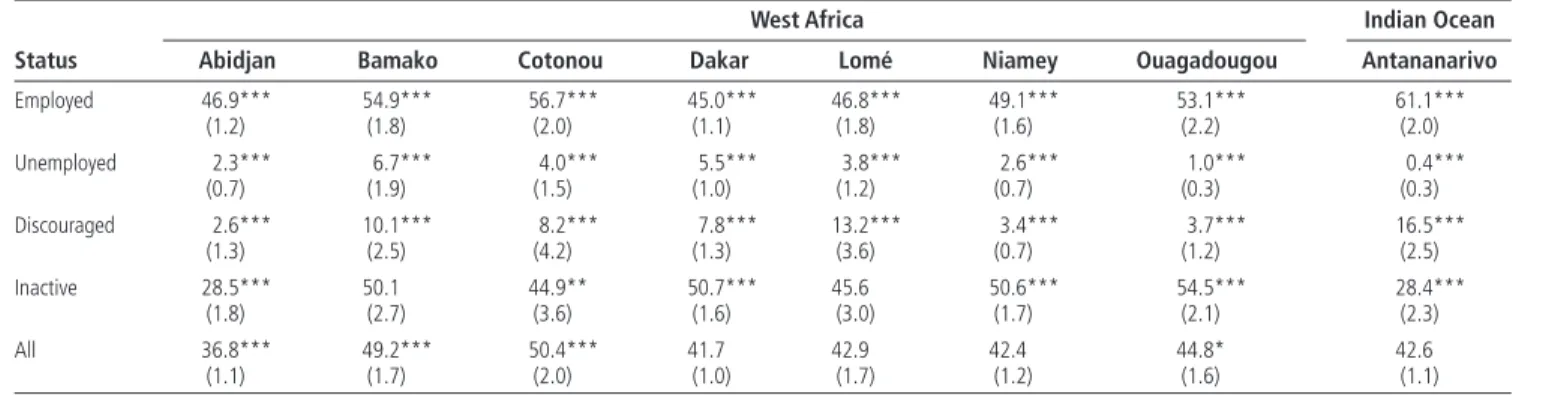
Level of Satisfaction by Labor Force StatusAnalysis of the perceptions of the entire working-age population (15 and older) fi nds relatively similar satisfaction rates across cities (table 3.1). Overall, no more than half of the population report satisfaction with their situation. Abidjan and Antananarivo diff er from the other capitals for the very low per-centage of satisfi ed individuals who are inactive. As labor force participation rates are not particularly low in the two cities (Abidjan has a higher than average rate), this fi nding refl ects labor market entry constraints that conceal the fact that many inactive individuals would actually like to work.
Not surprisingly, job-seekers are the least satisfi ed with their status, with a sat-isfaction rate of close to zero (the diff erence from zero may refl ect measurement errors). Th is fi nding may appear to be a truism, as job-seekers are by defi nition looking for jobs. However, it contradicts the theories about the voluntary nature of unemployment. It bears out the conclusions of recent studies on the mone-tary and social integration defi cit and the psychological costs of unemployment (Frey and Stutzer 2002; Alesina and Glaeser 2004).
More than 90 percent of discouraged workers are also dissatisfi ed. Th is fi nd-ing points to the huge growth that could be expected in labor force participation rates in the event of an economic upturn.
When the analysis is narrowed to employed workers, the inhabitants of Dakar, Lomé, and Abidjan are the most dissatisfi ed (with rates of about 45 percent); a larger number of residents of Antananarivo (61 percent) and Cotonou (57 percent) report being satisfi ed with their work. It is hard to compare these fi gures with fi ndings in other countries, because the question was not put the same way. Nonetheless, satis-faction rates appear to be much lower than in the developed countries and similar to those found in transition economies.6
Level of Satisfaction by Sociodemographic Characteristics
Th e rest of the analysis focuses on the employed working-age population. In keeping with the fi ndings in the literature, women are more oft en satisfi ed with their job than are men (table 3.2). However, additional analysis is required to determine the extent to which this phenomenon persists aft er controlling for other factors and handling any selection bias problems. Household heads and their spouses express job satisfaction much more oft en than other household members. Single people report job satisfaction less oft en than married people. Th is observation is surprising given that single people would seem to face fewer constraints (especially fi nancial constraints) and have greater leeway when looking for a job. Age may partially explain these results, as the job satisfaction rate increases with age. Job satisfaction among young people is very low (less than one-quarter of people under 20 are satisfi ed), mainly because of the entry
117
Table 3.1 Level of Job Satisfaction in Eight Cities in Sub-Saharan Africa, by Labor Force Status, 2001/02
(percent)
Status
West Africa Indian Ocean
Abidjan Bamako Cotonou Dakar Lomé Niamey Ouagadougou Antananarivo
Employed 46.9*** 54.9*** 56.7*** 45.0*** 46.8*** 49.1*** 53.1*** 61.1*** (1.2) (1.8) (2.0) (1.1) (1.8) (1.6) (2.2) (2.0) Unemployed 2.3*** 6.7*** 4.0*** 5.5*** 3.8*** 2.6*** 1.0*** 0.4*** (0.7) (1.9) (1.5) (1.0) (1.2) (0.7) (0.3) (0.3) Discouraged 2.6*** 10.1*** 8.2*** 7.8*** 13.2*** 3.4*** 3.7*** 16.5*** (1.3) (2.5) (4.2) (1.3) (3.6) (0.7) (1.2) (2.5) Inactive 28.5*** 50.1 44.9** 50.7*** 45.6 50.6*** 54.5*** 28.4*** (1.8) (2.7) (3.6) (1.6) (3.0) (1.7) (2.1) (2.3) All 36.8*** 49.2*** 50.4*** 41.7 42.9 42.4 44.8* 42.6 (1.1) (1.7) (2.0) (1.0) (1.7) (1.2) (1.6) (1.1)
Sources: Based on Phase 1 of the following 1-2-3 surveys: West African Economic and Monetary Union (WAEMU) 2001/02 (Observatoire économique et statistique d’Afrique Subsaharienne [AFRISTAT], Développement, Institutions et Mondialisation [DIAL]; and national statistics institutes); Madagascar 2001 (DIAL and Institut National de la Statistique [INSTAT]).
Note: Figures are for individuals 15 and older. The mean was modified to allow for the sampling design; the mean test shows the difference between each category and the rest of the sample. Figures in parentheses are standard errors.
118
Table 3.2 Level of Job Satisfaction in Eight Cities in Sub-Saharan Africa, by Individual Characteristics, 2001/02
(percent)
Characteristic
West Africa Indian Ocean
All
Abidjan Bamako Cotonou Dakar Lomé Niamey Ouagadougou Antananarivo
Gender Male 43.9*** 52.2* 54.5 36.8*** 44.4*** 45.6*** 50.1*** 60.9 47.3*** (1.2) (1.8) (2.0) (1.0) (1.8) (1.6) (2.0) (2.2) (0.7) Female 57.2*** 61.1* 60.1 63.6*** 60.3*** 57.5*** 62.9*** 63.6 60.3*** (2.8) (4.7) (6.6) (5.3) (4.6) (4.0) (2.8) (4.7) (1.7) Position in household Household head 54.1*** 62.4*** 63.0*** 49.2*** 52.8*** 54.1*** 57.8*** 68.9*** 57.4*** (1.6) (2.0) (2.0) (1.6) (1.9) (1.8) (2.7) (2.1) (0.9) Spouse 53.3*** 57.3*** 67.4*** 46.5*** 55.3*** 55.0*** 59.5*** 69.3*** 58.2*** (1.9) (2.7) (2.5) (2.1) (2.5) (2.3) (2.5) (1.7) (0.9) Other 31.2*** 34.8*** 34.5*** 33.1*** 28.0*** 31.9*** 39.5*** 41.3*** 33.5*** (1.5) (2.2) (2.8) (1.1) (1.9) (1.9) (2.7) (3.9) (0.8) Marital status Married 55.2*** 60.7*** 65.1*** 47.6*** 55.1*** 55.2*** 59.4*** 60.6** 57.1*** (1.4) (2.1) (2.0) (1.2) (2.0) (1.8) (2.4) (2.1) (0.7) Single 32.1*** 34.3*** 33.0*** 29.5*** 27.7*** 29.0*** 36.1*** 53.9* 31.9*** (1.6) (2.0) (2.7) (1.3) (1.8) (1.9) (2.8) (3.4) (0.8) Separated, divorced, or widowed 56.5*** 61.1* 64.3** 46.0** 52.4*** 59.6*** 69.6*** 80.5*** 58.6*** (3.3) (5.1) (4.5) (3.1) (3.1) (3.2) (4.3) (2.7) (1.5) Age <20 22.3*** 23.3*** 24.3*** 25.8*** 20.0*** 22.6*** 30.3*** 26.6*** 24.1*** (1.9) (2.3) (3.3) (1.9) (2.1) (2.2) (2.4) (6.6) (1.0) 20–29 37.3*** 45.3*** 44.6*** 32.0*** 39.3*** 37.1*** 41.9*** 43.4*** 38.9*** (1.6) (2.6) (2.6) (1.5) (2.2) (2.3) (3.2) (2.3) (0.8)
119 30–39 47.9** 52.0 59.6*** 37.5 47.1 45.4 52.2 62.7 49.9*** (1.7) (2.5) (2.4) (1.9) (2.3) (1.9) (2.4) (3.0) (0.9) 40–49 61.4*** 67.3*** 68.6*** 48.4*** 59.7*** 60.7*** 63.9*** 73.0*** 62.4*** (2.1) (2.6) (2.8) (1.8) (2.5) (2.3) (2.6) (2.6) (1.1) 50+ 72.2*** 76.4*** 82.1*** 60.4*** 73.0*** 69.3*** 81.9*** 84.9*** 74.4*** (2.2) (2.6) (2.2) (1.9) (2.7) (2.2) (3.1) (2.0) (1.0) Education None 54.0*** 57.3*** 61.2*** 42.6*** 55.3*** 54.8*** 58.0*** 65.2 53.3*** (1.8) (2.2) (3.2) (1.4) (2.3) (1.9) (2.8) (7.5) (0.9) Primary 38.1*** 46.0*** 49.6*** 31.7*** 39.9*** 34.8*** 43.0*** 55.9** 41.9*** (1.5) (2.7) (2.3) (1.5) (2.3) (2.1) (2.2) (3.1) (0.9) Lower-secondary 39.0*** 44.2*** 53.0 38.6 43.1 43.1* 44.5*** 58.4 45.5*** (2.1) (2.7) (2.8) (1.8) (2.1) (2.5) (2.8) (2.7) (1.0) Upper-secondary 49.8* 43.5*** 53.2 37.7 44.2 41.8 52.7 67.5*** 51.5*** (2.8) (3.5) (3.6) (2.4) (2.5) (3.1) (3.8) (2.3) (1.4) Higher 40.7 60.4*** 59.0 48.5*** 45.8 45.3 53.0 71.3*** 51.8** (3.5) (3.2) (3.9) (3.1) (3.3) (3.2) (3.5) (2.2) (1.6) Migrant status Native 39.6*** 46.7*** 50.2*** 37.5** 43.0* 37.5*** 48.1*** 60.3** 46.2*** (1.8) (2.1) (2.3) (1.2) (1.9) (1.7) (2.6) (1.9) (0.9) Migrant 47.6*** 57.5*** 58.6*** 41.4** 46.4* 52.6*** 53.8*** 65.1** 50.1*** (1.3) (2.3) (2.1) (1.5) (2.0) (1.7) (2.4) (2.6) (0.8)
Sources: Based on Phase 1 of the 1-2-3 surveys of selected countries (see table 3.1 for details).
Note: Figures are for all employed workers. The mean was modified to allow for the sampling design; the mean test shows the difference between each category and the rest of the sample. Figures in parentheses are standard errors.
120 URBAN LABOR MARKETS IN SUB-SAHARAN AFRICA
problems they encounter and the fact that labor market conditions oft en fail to satisfy their aspirations.
Th e link between job satisfaction and education reveals a U-shaped curve: people at the two tails of the distribution (the least educated and the most educated) post high rates of satisfaction. Th e fact that people with the least education—and therefore the fewest opportunities to fi nd good jobs—have high job satisfaction probably refl ects the fact that the least educated limit their aspirations. Labor market conditions are more positive for the few graduates there are.
Migrants report satisfaction with their jobs more oft en than nonmigrants. Either a selection eff ect is at work or migrants adapt their aspirations, or they are driven by an integration goal and actually manage to fi nd better jobs than native residents.
Th ese results do not establish direct links between satisfaction and individual characteristics (particularly position in the household and marital status), given the endogeneity issues. Th e variables do refl ect some psychological unobserv-ables that infl uence both satisfaction and employment.
Level of Satisfaction by Job Characteristics
Public sector workers are more likely than workers in other sectors to want to keep their job—an unsurprising result given the better benefi ts these workers enjoy (table 3.3). Workers in the informal private sector are more satisfi ed with their jobs than workers in the formal private sector (except in Antananarivo and Dakar). Additional checks are needed to determine whether this result holds aft er controlling for other variables and aspirations.
Th e results by industry vary a great deal across countries, but they appear to refl ect the ranking of the sectors by their level of development and prosperity. Satisfaction is highest in trade in Cotonou and Lomé (and, to a lesser extent, in Niamey and Dakar). In Abidjan, satisfaction is higher in the primary sector (the country’s most buoyant sector). Wage-earner status does not guarantee greater job satisfaction in the countries studied. Although wage-earners are more satis-fi ed than non-wage-earners in Antananarivo, Dakar, and Bamako, in the other cities, at least as many non-wage-earners as wage earners report being satisfi ed with their job.
Th e level of satisfaction tends to grow as employees climb the socioeco-nomic ladder, with the highest rates found among managers (except in Niamey, where managers have a very low rate of satisfaction). Among non-wage-earners, employers and proprietors are more likely to be satisfi ed than workers who are self-employed. Th e ranking of contributing family workers and apprentices is not clear-cut, but both categories exhibit low levels of satisfaction (about 20 percent on average; Antananarivo is once again an exception, with 44 percent of family work-ers reporting being satisfi ed).
121
(continued next page)
Table 3.3 Level of Job Satisfaction in Eight Cities in Sub-Saharan Africa, by Job Characteristics, 2001/02
Sector
West Africa Indian Ocean
All
Abidjan Bamako Cotonou Dakar Lomé Niamey Ouagadougou Antananarivo
Institutional sector
Public sector 58.3*** 67.4*** 64.4** 58.1*** 61.5*** 48.7 59.7*** 79.5*** 62.9***
(3.6) (3.0) (5.0) (2.7) (3.3) (2.4) (2.9) (2.1) (1.4)
Formal private sector 44.1 48.6 53.0 38.9 37.4*** 42.1* 47.3* 62.9 47.9
(2.3) (2.8) (3.3) (1.9) (2.4) (2.5) (2.6) (2.8) (1.3) Informal sector 44.3 51.1** 53.9 37.1*** 44.5 46.8 50.8 56.7*** 46.6*** (1.3) (2.0) (2.2) (1.1) (1.9) (1.8) (2.5) (2.0) (0.7) Industrial sector Primary 56.6** 55.7 59.3 40.3 46.3 43.4 50.9 64.5 53.5*** (4.8) (5.0) (8.1) (3.6) (4.6) (3.6) (4.1) (5.1) (2.0) Manufacturing 42.5* 47.2*** 46.1*** 33.7*** 42.3* 43.7** 52.4 60.8 45.2*** (2.0) (2.7) (3.0) (1.6) (2.3) (2.2) (2.8) (2.8) (1.1) Trade 51.0*** 54.3* 61.8*** 43.0*** 47.9*** 51.1*** 52.8 62.3 52.3*** (1.5) (2.0) (2.3) (1.5) (2.2) (2.1) (2.6) (1.8) (0.8) Services 41.3*** 53.1 51.8*** 39.9 43.4 45.9 49.3* 60.2 46.3*** (1.5) (2.0) (2.1) (1.3) (2.0) (1.9) (2.3) (2.1) (0.8) Wage-earner status Non-wage-earner 46.7** 51.1** 55.0 37.5** 46.1** 46.3 52.1 59.6** 48.3 (1.4) (2.0) (2.2) (1.1) (1.9) (1.8) (2.3) (1.9) (0.7) Wage-earner 42.9** 56.4** 53.8 41.6** 41.2** 46.6 49.9 62.9** 48.3 (1.6) (2.3) (2.8) (1.5) (2.2) (2.0) (2.5) (2.3) (1.0) Socioeconomic group Wage-earner
Senior manager, engineer, or similar
55.2* 71.3*** 62.8 65.5*** 58.3* 45.3 59.2 81.9*** 61.4***
122
Middle manager, supervisor 53.5** 54.9 59.6 52.9*** 53.6* 50.0 57.8 67.7* 55.6***
(3.3) (3.7) (5.2) (2.9) (5.0) (3.1) (4.2) (3.9) (1.6) Skilled manual/nonmanual 44.2 60.8** 55.5 48.6*** 49.7* 54.7** 58.6** 69.1*** 56.0*** (3.5) (4.1) (3.0) (2.2) (3.0) (3.9) (3.6) (2.2) (1.5) Semi-skilled manual/ nonmanufacturing 44.7 51.1 51.4 35.1 34.2*** 40.4* 51.4 59.1 45.0** (2.5) (4.6) (4.1) (2.9) (3.3) (3.5) (7.1) (4.0) (1.5) Unskilled 32.2*** 47.1 36.2*** 30.3*** 26.6*** 44.0 35.9*** 48.9*** 35.9*** (2.8) (4.6) (5.2) (2.7) (3.5) (3.4) (2.7) (3.7) (1.5) Non-wage-earner Employer 65.3*** 65.8*** 72.5*** 50.0* 55.5*** 69.3*** 66.0*** 84.5*** 66.4*** (2.5) (4.3) (3.9) (6.1) (3.9) (4.5) (4.5) (4.6) (1.6) Self-account worker 52.9*** 54.4** 63.0*** 43.4*** 52.0*** 54.7*** 61.0*** 61.3 54.2*** (1.6) (2.1) (2.2) (1.4) (2.1) (2.0) (3.3) (2.5) (0.8) Apprentice 18.6*** 22.7*** 23.7*** 23.1*** 21.6*** 15.1*** 16.6*** 11.2*** 20.6*** (2.4) (4.2) (3.9) (1.9) (3.5) (2.0) (2.7) (7.9) (1.2)
Contributing family worker 22.1*** 20.1*** 27.1*** 19.5*** 20.9*** 28.2*** 35.3*** 43.8*** 28.4***
(3.1) (3.7) (4.1) (2.6) (3.1) (2.9) (3.7) (4.0) (1.5)
Sources: Based on Phase 1 of the 1-2-3 surveys of selected countries (see table 3.1 for details).
Note: Figures are for all employed workers. The mean was modified to allow for the sampling design; the mean test shows the difference between each category and the rest of the sample. Figures in parentheses are standard errors.
* significant at the 10 percent level, ** significant at the 5 percent level, *** significant at the 1 percent level.
Table 3.3 (continued)
Sector
West Africa Indian Ocean
All
JOB SATISFACTION IN EIGHT AFRICAN CITIES 123
Econometric Analyses
Results at the Aggregate LevelTh e aim of the analysis was to identify the infl uence of three types of factors on job satisfaction:
• Variables aff ecting the formation of aspirations (individual, country, and household characteristics)
• Classic objective job variables that generate “extrinsic” satisfaction (remu-neration, working conditions, and job security)
• Variables that refl ect a job’s intrinsic value (socioeconomic group, institu-tional sector, fi rm size, and existence of a union). Th ese variables capture the opportunity to manage and supervise, work on one’s own initiative, use one’s capacities and skills, perform a variety of tasks, maintain good work relations, hold a suitable social position, and so forth.
Controlling for the eff ect of aspirations clarifi es the nature of the eff ects of various job characteristics on job satisfaction.
Several approaches were considered to at least partially allow for endo-geneity eff ects. First, country dummy variable controls were introduced for the unobserved factors relating to the national context, which infl uence the individuals’ satisfaction levels; access to good-quality jobs (employment con-tract, steady work, wages, and so forth); and even the number of hours worked. Second, given that in the vast majority of households individual data were available on several members, we were able to conduct estimates purged of household fi xed eff ects. Th is approach controls for unobserved factors related to household characteristics (family background, potential common traits), which infl uence the individuals’ type of labor market integration as much as satisfaction does.
Several stylized facts have been observed in developed countries and transi-tion economies. Women; the least educated; people from modest social back-grounds (people whose father had no more than primary education, people who are self-employed in a small family business); and, to a certain extent, the oldest individuals are more inclined than other workers to express job satisfac-tion (table 3.4). Th ese stylized facts can be interpreted as evidence of the down-ward revision of aspirations.
Th e level of education has a convex eff ect on job satisfaction, with the least educated and university graduates more inclined to be satisfi ed with their jobs (the coeffi cient corresponding to the square of the number of years of education is positive). Th e negative correlation with the level of satisfaction for widowed and divorced workers and migrants may refl ect the eff ect of psychological fac-tors on general well-being. Th e fact that the coeffi cients are no longer signifi cant
124 URBAN LABOR MARKETS IN SUB-SAHARAN AFRICA
Table 3.4 Logit Model of Determinants of Job Satisfaction in Eight Cities in Sub-Saharan
Africa, 2001/02 Variable (1) (2) (3) Household fi xed effect (4) (5) (6) Household fi xed effect Sociodemographic characteristics Female 0.366*** 0.365*** 0.495*** 0.291*** 0.406*** Age 0.030** 0.024** 0.036* 0.017* 0.022 Age squared 0.000 0.000* 0.000 0.000*** 0.000 Number of years of education –0.046*** –0.047*** –0.057*** –0.042*** –0.054*** Number of years of education
squared
0.000*** 0.001*** 0.000*** 0.000*** 0.000*** Father self-employed 0.090*** 0.099** 0.098* 0.080** 0.092* Father’s education > primary –0.220*** –0.220*** –0.430*** –0.222*** –0.436*** Migrant –0.121*** –0.101 –0.125*** –0.076 Single –0.131* –0.093 –0.065 –0.017 Widowed or divorced –0.219** –0.003 –0.207** –0.004
Job characteristics
Relative income 0.015*** 0.015*** 0.018*** 0.012*** 0.012*** 0.014*** Number of hours worked 0.004*** 0.004*** 0.005*** Wage-earner 0.146 –0.241*** –0.097 Written contract 0.153*** 0.125*** 0.022 Steady work 0.401*** 0.316*** 0.292***
Wages and benefits (reference = not fixed, no benefits)
Fixed wage 0.245*** 0.213*** 0.235***
Benefi ts 0.222** 0.171* 0.142
Sector (reference = formal private)
Public sector 0.284*** 0.188** 0.326** Informal sector 0.053 0.016 –0.077
Type of worker (reference = unskilled/apprentice)
Senior manager 0.081 0.329** 0.563** Middle manager –0.022 0.140* 0.216 Skilled/semi-skilled 0.161*** 0.230*** 0.203* Proprietor/employer 1.207*** 0.704*** 0.851*** Self-employed 1.085*** 0.481*** 0.595** Family worker 0.480** 0.299* 0.097
Number of workers (reference = >50)
Own account (1) –0.275** –0.236* –0.165
2–5 –0.169** –0.129* –0.037
6–50 –0.164*** –0.099 –0.093
JOB SATISFACTION IN EIGHT AFRICAN CITIES 125
Union
Union in the fi rm –0.016 0,017 –0,038
Union member 0.071 –0,031 –0,053
Country dummy (reference = Togo)
Benin 0.399*** 0.383*** 0.474*** 0.399*** Burkina Faso 0.110*** 0.101*** 0.308*** 0.145*** Côte d’Ivoire –0.029* –0.014 0.129*** 0.036* Madagascar 0.724*** 0.629*** 0.867*** 0.718*** Mali 0.202*** 0.174*** 0.317*** 0.187*** Niger –0.077*** –0.083*** 0.204*** 0.002 Senegal –0.282*** –0.298*** –0.072*** –0.197*** Constant –1.981*** –1.736*** –2.184*** –2.264*** Number of observations 38,532 38,532 17,029 38,270 38,264 16,841 Pseudo R2 0.105 0.106 0.237 0.08 0.117 0.254 Log (pseudo-likelihood) –2,3895.7 –2,3868.9 –4,941.6 –2,4369.2 –2,3409.4 –4,776.1 Sources: Based on Phase 1 of the 1-2-3 surveys of selected countries (see table 3.1 for details).
Note: Relative income refers to the classification of each individual based on income centile. Categories of income centile are calculated for each country: the first centile category includes the 1 percent of the population with the lowest income.
* significant at the 10 percent level,** significant at the 5 percent level,*** significant at the 1 percent level.
Table 3.4 (continued) Variable (1) (2) (3) Household fi xed effect (4) (5) (6) Household fi xed effect
when we consider household fi xed eff ects confi rms that the link between these two variables and job satisfaction is not direct.
Th e classic objective variables used to describe working conditions are all signifi cantly correlated with job satisfaction:
• Th e link with income (relative income here) is signifi cant and has the expected sign. Th e higher the income (compared with standard earnings in the country studied), the greater the tendency to express job satisfaction. Income far from determines the level of satisfaction, however, as the variance explained by the univariate models of earned income only is no greater than a few percentage points (models not reported).
• Steady work, a fi xed wage, and fringe benefi ts have a positive eff ect on satisfaction.
• Th e positive value for the number of hours worked refl ects the specifi c cir-cumstances in the countries studied, where the risk of underemployment is high (and the fear of working too hard limited).
126 URBAN LABOR MARKETS IN SUB-SAHARAN AFRICA
• Being a wage-earner does not appear to signifi cantly infl uence the level of satisfaction, other things equal.7 In countries where wage labor is not the rule, employees probably perceive employer-employee relations as a form of dependence, prompting a feeling of subordination and vulnerability (as the employer can decide to terminate employment at any time).
• Most of the variables used to capture the intrinsic value of the job also infl uence satisfaction in the expected direction, although middle managers express less job satisfaction than would be expected. Th is fi nding could be explained by the ambiguous situation in which middle managers—who have some autonomy but may be burdened by pressure from senior managers— fi nd themselves.
• Th e public sector (administration and public corporations) is the most highly valued: given identical job characteristics, employed workers prefer to work in this sector. Job security elements are not captured by the models; prestige probably plays a decisive role in the preference for public sector employment.
• Th e formal private sector does not appear to be more desirable than the informal sector. Th is fi nding challenges the queuing theory put forward by many economic studies, which see it as a refuge sector.
• People who work in large fi rms (more than 50 people) are more likely to be satisfi ed with their job. Advantages in terms of community and social networks (events, a company canteen, the fi rm’s reputation) may well win out over the benefi ts associated with smaller fi rms (autonomy, fl exibility, more family-type relations). However, as the link between fi rm size and sat-isfaction is no longer signifi cant when household fi xed eff ects are taken into account, it probably refl ects endogeneity.
Th e existence of or membership in a union has no eff ect on satisfaction, pos-sibly because of the weak bargaining power of unions in the countries studied. Analysis of the country dummy variables shows that people in Benin and Madagascar are more inclined to report being satisfi ed with their job; people in Côte d’Ivoire and Senegal tend to be more critical. Th ese fi ndings refl ect diff erences in labor market conditions (not captured by the variables in our models). Th e sociopolitical contexts allow optimistic views in Antananarivo and Cotonou; it is less satisfactory in Dakar and Abidjan.8
Results by Country
Th e signs of the coeffi cients are the same in all capitals for most of the fac-tors that have a signifi cant infl uence on satisfaction, and their magnitudes are extremely similar, suggesting the overall robustness of the approach and the results (table 3.5). However, the correlations are not systematically signifi cant
127
Table 3.5 Logit and Household Fixed-Effect Models of Determinants of Job Satisfaction in Eight Cities in Sub-Saharan Africa, 2001/02
Variable Abidjan Antananarivo Bamako Cotonou Dakar Lomé Niamey Ouagadougou
Sociodemographic characteristics
Female 0.283* 0.649*** 0.517*** 0.693*** 0.041 0.294** 0.496*** 0.780***
Age 0.078** 0.082** 0.041* 0.044 –0.027 0.034 0.012 –0.027
Age squared 0.000 0.000 0.000 0.000 0.001*** 0.000 0.000 0.001**
Number of years of education 0.000 –0.102 –0.120*** –0.001 –0.051* –0.085** –0.090* –0.087**
Number of years of education squared –0.006* 0.000 0.005 –0.002 0.001 0.002 0.003 0.001
Father self-employed 0.046 –0.006 0.061 –0.071 0.225** 0.027 –0.025 0.063
Father’s education > primary –0.605*** –0.123 –0.547*** –0.528*** –0.176* –0.317* –0.868*** –0.678***
Migrant –0.108 –0.049 0.231 –0.288* 0.049 –0.183 –0.095 –0.016
Job characteristics
Relative income 0.021*** 0.021*** 0.008** 0.013*** 0.016*** 0.019*** 0.009** 0.018***
Number of hours worked 0.001 0.010** 0.007* 0.004 0.007*** –0.002 0.002 0.010***
Wage-earner –0.584* –0.371 0.312 0.341 0.050 –0.544 0.150 0.069
Written contract 0.112 –0.001 –0.502* 0.128 0.133 0.099 0.475* –0.185
Steady work 0.345 0.772*** 0.141 0.262 0.337*** 0.076 0.257 0.215
Fixed wage (reference = not fi xed) 0.174 –0.059 0.893** 0.278 0.061 0.098 0.369 0.243
Sector (reference = formal private)
Public 0.598** 0.110 0.428 0.641** 0.672*** 0.770** –0.349 0.227
Informal 0.156 –0.356 –0.302 0.028 0.159 –0.300 0.003 –0.484**
128
Type of worker (reference = middle manager/skilled or semi-skilled)
Senior manager 1.129** 0.486 0.647 –0.165 0.552 –0.382 0.031 0.822** Proprietor/employer 0.766** 1.037** 1.211*** 1.337*** 0.091 0.688** 1.109** 1.146*** Self-employed 0.485* 0.009 0.798*** 1.220*** 0.217 0.731*** 0.616** 0.981*** Union Union in the fi rm –0.200 0.250 –0.183 0.170 –0.423** 0.280 –0.327 0.192 Union member 0.294 –0.362 0.395 –0.015 –0.094 –0.181 –0.023 –0.155 Number of observations 2,035 1,789 1,715 2,086 3,536 1,867 1,639 2,171 Pseudo R2 0.339 0.388 0.264 0.366 0.150 0.289 0.267 0.304 Log (likelihood) –503.2 –401.3 –472.9 –504.7 –1194.8 –486.8 –462.2 –573.3
Sources: Based on Phase 1 of the 1-2-3 surveys of selected countries (see table 3.1 for details).
Note: Relative income refers to the classification of each individual based on income centile. Categories of income centile are calculated for each country: the first centile category includes the 1 percent of the population with the lowest income.
* significant at the 10 percent level, ** significant at the 5 percent level, *** significant at the 1 percent level.
Table 3.5 (continued)
JOB SATISFACTION IN EIGHT AFRICAN CITIES 129
for each country. Th e level of education has no eff ect on aspirations in Anta-nanarivo and Cotonou. Th e infl uence of father’s education is signifi cant in all cities except Antananarivo. In Dakar the relationship between satisfaction and father’s self-employment is stronger than elsewhere.
Some working conditions are associated with the level of satisfaction only in certain cities. For example, the written contract is highly valued only in Niamey. Having a fi xed wage is seen as positive, other things being equal, only in Bamako. Wage labor is perceived negatively in Abidjan (where wage-earning appears to imply adverse working conditions).
Working in the public sector is likely to generate satisfaction in Abidjan, Cotonou, Dakar, and Lomé; it has no signifi cant eff ect on satisfaction in Antananarivo, Bamako, Niamey, or Ouagadougou. Th e correlation between job satisfaction and informal sector employment is positive in Dakar but negative in Ouagadougou. Self-employment is associated with job satisfac-tion except in Antananarivo and Dakar, where the link is not signifi cant. Having a union in the fi rm is not associated with higher job satisfaction; the link is actually negative in Dakar, where workers are more inclined to express dissatisfaction in fi rms with a union. An endogeneity eff ect is probably at work here (the union may have been set up in the fi rm because of poor work-ing conditions).
Conclusion
Analysis of job satisfaction in eight SubSaharan Africa capitals fi nds signifi -cant links between objective job characteristics and the satisfaction individuals express with their jobs. For some job characteristics, these links appear more clearly aft er controlling for individual aspirations. Th e eff ect of aspirations is identifi ed through the infl uence of individual characteristics and the circum-stances in the country.
Th e results validate the idea that job satisfaction is a suitable indicator of job quality, for three reasons. First, satisfaction provides a gauge of the match between jobs and individual aspirations. Given that a mismatch between expec-tations and outcomes could create economic and social tensions, this match needs to be measured. Second, aft er controlling for the eff ect of aspirations, the correlations between satisfaction and objective job characteristics indicate that individuals take these characteristics into consideration in evaluating their working conditions. Th ird, labor market conditions (and the characteristics that capture those conditions) vary across countries. Diff erent values can be placed on a given job or status depending on the circumstances in a country. Th e fi ndings hence refl ect the intrinsic quality of a category of employment in the country studied.
130 URBAN LABOR MARKETS IN SUB-SAHARAN AFRICA
Th e analysis shows that the explanatory power of the factors chosen is lim-ited. Th e controls used for endogeneity and selection biases are imperfect; the use of panel data or attitudinal questions would be a useful avenue for future research that would allow further exploration of causality, by explicitly con-trolling for unobservables and psychological factors that shape behaviors and opinions. Closer attention should also be paid to the factors associated with employment history (to take account of upward and downward trajectories), in particular the characteristics of individuals’ previous job. Analysis of the impact of national socioeconomic circumstances could be honed by introduc-ing macroeconomic variables (growth, stagnation, or crisis spells) or by build-ing indicators to typify individuals’ reference groups and capturbuild-ing comparison peer eff ects.
Notes
1. Economists long overlooked job satisfaction—although pioneering work was done by Hamermesh (1977), Freeman (1978), and, more recently, Clark and Oswald (1996)—out of scepticism about drawing economic conclusions from data on feel-ings and personal perceptions. Th eir interest in job satisfaction increased when the link was identifi ed between job satisfaction and work performance.
2. Th e other studies related to this topic are ad hoc analyses of specifi c professions (nurses, surveyors, and teachers, for example).
3. Th e cities are Abidjan, Côte d’Ivoire; Bamako, Mali; Cotonou, Benin; Dakar, Senegal; Lomé, Togo; Niamey, Niger; and Ouagadougou, Burkina Faso, in West Africa and Antananarivo, in Madagascar. Although Abidjan and Cotonou are not administra-tive capitals, we refer to them as capitals because they are the most important eco-nomic centers in their countries (Cotonou is also the seat of government).
4. Th e 1-2-3 surveys have been conducted since 1996 in Antananarivo, where the methodology was strengthened before the surveys were implemented in West Africa in the framework of the PARSTAT program.
5. For unemployed and inactive individuals in category 1 (fi nd a fi rst job), satisfaction concerns their situation on the labor market (rather than job satisfaction). Th ese categories are not included in the econometric analyses on job satisfaction, which examine only the employed labor force.
6. We refer here in particular to the fi gures provided by Sousa-Poza and Sousa-Poza (2000). Th e satisfaction rate in their study includes everyone who indicated being more or less satisfi ed.
7. Other variables (steady work, full-time work, fi xed wage) take into account some of the advantages of being a wage-earner.
8. In 2002, Madagascar had just emerged from a major political crisis whose posi-tive outcome raised high hopes. Benin is one of the rare African countries to have seen real democratic progress (with changeovers of political power made possible by transparent elections) following a long period of instability and dictatorship until the late 1990s. The hope inspired by the directions these two
JOB SATISFACTION IN EIGHT AFRICAN CITIES 131
countries have taken may have had a psychological effect on job satisfaction. The less stable sociopolitical situation in Côte d’Ivoire and Senegal at the time of the survey probably had a negative impact on individuals’ perceptions of working conditions.
References
Alesina A. and E. Glaeser. 2004. Fighting Poverty in the U.S. and Europe: A World of
Diff erence. New York: Oxford University Press.
Beuran M., and E. Kalugina. 2005. “Subjective Welfare and the Informal Sector: Th e Case of Russia.” Working Paper, Centre d’Economie de la Sorbonne, Université Paris 1, Centre National de la Recherche Scientifi que (CNRS), Paris.
Blanchfl ower, D., and A. Oswald. 2004. “Well-Being over Time in Britain and the USA.”
Journal of Public Economics 88 (7–8): 1359–86.
Brilleau, A., E. Ouedraogo, and F. Roubaud. 2005. “L’enquête 1-2-3 dans les pays de l’UEMOA: la consolidation d’une méthode.” Statéco 99: 15–170.
Bryson, A., L. Cappellari, and C. Lucifora. 2005. “Why So Unhappy? Th e Eff ects of Unionization on Job Satisfaction.” IZA Discussion Paper 1498, Institute for the Study of Labor, Bonn, Germany.
Clark, A. 1997. “Job Satisfaction and Gender: Why Are Women So Happy at Work?”
Labour Economics 4 (4): 341–72.
———. 2001. “What Really Matters in a Job? Hedonic Measurement Using Quit Data.”
Labour Economics 8 (2): 223–42.
Clark, A. 2004. “What Makes a Good Job? Evidence from OECD Countries.” DELTA Working Paper 2004–28, Département et Laboratoire d’Economie Th éorique et Appli-quée, École Normale Supérieure, École des Hautes Études en Sciences Sociales, Paris. Clark, A., and A. J. Oswald. 1996. “Satisfaction and Comparison Income.” Journal of
Public Economics 61: 359–81.
Clark, A., A. J. Oswald, and P. Warr. 1996. “Is Job Satisfaction U-Shaped in Age?” Journal
of Occupational and Organizational Psychology 69 (1): 57–81.
D’Addio, A. C., T. Eriksson, and P. Frijters. 2003. “An Analysis of the Determinants of Job Satisfaction When Individuals’ Baseline Satisfaction Levels May Diff er.” DT 2003-16 CAM, Centre for Applied Microeconometrics, Institute of Economics, University of Copenhagen.
Easterlin, R. A. 2001. “Income and Happiness: Towards a Unifi ed Th eory.” Economic
Journal 111 (2): 465–84.
———. 2003. “Building a Better Th eory of Well-Being.” IZA Discussion Paper 742, Insti-tute for the Study of Labor, Bonn, Germany.
Falco, P., W. F. Maloney, and B. Rijkers. 2011. “Self Employment and Informality in Africa: Panel Evidence from Satisfaction Data.” March, Centre for the Study of African Economies (CSAE), Department of Economics, Oxford University.
Freeman, R. B. 1978. “Job Satisfaction as an Economic Variable.” American Economic
132 URBAN LABOR MARKETS IN SUB-SAHARAN AFRICA
Frey, B., and A. Stutzer. 2002. Happiness and Economics. How the Economy and
Institutions Aff ect Human Well-Being. Princeton, NJ: Princeton University Press.
Garcia-Serrano, C. 2008. “Does Size Matter? Th e Infl uence of Firm Size on Working Conditions and Job Satisfaction.” Working Paper 2008-30, Institute for Social & Economic Research (ISER), Columbia University, New York.
Gelade, G. A., P. Dobson, and K. Auer. 2008. “Individualism, Masculinity, and the Sources of Organizational Commitment.” Journal of Cross-Cultural Psychology
39 (5): 599–617.
Hamermesh, D. 1977. “Economic Aspects of Job Satisfaction.” In Essays in Labor Market
and Population Analysis, ed. O. Ashenfelter and W. Oates, 53–72. New York: Wiley.
Hamermesh, D. 2001. “Th e Changing Distribution of Job Satisfaction.” Journal of Human
Resources 36: 1–30.
Idson, T. L. 1990. “Establishment Size, Job Satisfaction, and the Structure of Work.”
Applied Economics 22: 1007–18.
Judge, T. A., C. J. Th oresen, J. E. Bono, and G. K. Patton. 2001. “Th e Job Satisfaction–Job Performance Relationship: A Qualitative and Quantitative Review.” Psychological
Bul-letin 127 (3): 376–407.
Judge, T.A., and S. Watanabe. 1993. “Another Look at the Job Satisfaction–Life Satisfac-tion RelaSatisfac-tionship.” Journal of Applied Psychology 6: 939–48.
Kristensen, N., and N. Westergård-Nielsen. 2004. “Does Low Job Satisfaction Lead to Job Mobility?” IZA Discussion Paper 1026, Institute for the Study of Labor, Bonn, Germany.
Lévy-Garboua, L. and C. Montmarquette. 1984. “Reported Job Satisfaction: What Does It Mean?” Journal of Socio-Economics 33 (2): 135–51.
Lévy-Garboua, L., C. Montmarquette, and V. Simonnet. 1999. “Job Satisfaction and
Quits: Th eory and Evidence from the German Socio-Economic Panel.” Th éorie et
Applications en Microéconomie et Macroéconomie (TEAM), Centre d’Economie de la Sorbonne, Université Paris 1.
Llorente, R. M., and E. F. Macías. 2005. “Job Satisfaction as an Indicator of the Quality of Work.” Journal of Socio-Economics 34 (5): 656–73.
Malka, A., and J. A. Chatman. 2003. “Work Orientation and the Contingency of Job Sat-isfaction and Subjective Well-Being on Annual Income: A Longitudinal Assessment.”
Personality and Social Psychology Bulletin 29: 737–46.
Pichler, F., and C. Wallace. 2009. “What Are the Reasons for Diff erences in Job Satis-faction across Europe? Individual, Compositional, and Institutional Explanations.”
European Sociological Review 25 (5): 535–49.
Rakotomanana, F. 2011. “Secteur informel urbain, marché du travail et pauvreté: essais d’analyse sur le cas de Madagascar.” PhD diss., École Doctorale Entreprise, Économie, Société, Université Montesquieu, Bordeaux IV.
Razafi ndrakoto, M., and F. Roubaud. 2006. “Les déterminants du bien-être individuel en Afrique francophone: le poids des institutions.” Afrique Contemporaine 220: 191–223.
JOB SATISFACTION IN EIGHT AFRICAN CITIES 133
Razafi ndrakoto, M., F. Roubaud, and J. M. Wachsberger. 2012. “Travailler dans le secteur informel: choix ou contrainte? Une analyse de la satisfaction dans l’emploi au Vietnam.” In L’économie informelle dansles pays en développement, ed. J.-P. Cling, S. Lagrée, M. Razafi ndrakoto, and F. Roubaud, 47–66. Paris: Edition de l’AFD.
Sousa-Poza, A., and A. A. Sousa-Poza. 2000. “Well-Being at Work: A Cross-National Analysis of the Levels and Determinants of Job Satisfaction.” Journal of
Socio-Economics 29 (6): 517–38.
Warr, P. 1999. “Well-Being and the Workplace.” In Well-Being: Th e Foundations of
Hedonic Psychology, ed. D. Kahneman, E. Diener, and N. Schwartz, 392–412. New
© 2013 International Bank for Reconstruction and Development / Th e World Bank 1818 H Street NW, Washington DC 20433
Telephone: 202-473-1000; Internet: www.worldbank.org Some rights reserved
1 2 3 4 16 15 14 13
Th is work is a product of the staff of Th e World Bank with external contributions. Note that Th e World Bank and the Agence Française de Développement do not necessarily own each component of the content
included in the work. Th e World Bank and the Agence Française de Développement therefore do not
warrant that the use of the content contained in the work will not infringe on the rights of third parties. Th e risk of claims resulting from such infringement rests solely with you.
Th e fi ndings, interpretations, and conclusions expressed in this work do not necessarily refl ect the views of Th e World Bank, its Board of Executive Directors, or the governments they represent, or the
Agence Française de Développement. Th e World Bank does not guarantee the accuracy of the data
included in this work. Th e boundaries, colors, denominations, and other information shown on any map in this work do not imply any judgment on the part of Th e World Bank concerning the legal status of any territory or the endorsement or acceptance of such boundaries.
Nothing herein shall constitute or be considered to be a limitation upon or waiver of the privileges and immunities of Th e World Bank, all of which are specifi cally reserved.
Rights and Permissions
Th is work is available under the Creative Commons Attribution 3.0 Unported license (CC BY 3.0) http:// creativecommons.org/licenses/by/3.0. Under the Creative Commons Attribution license, you are free to copy, distribute, transmit, and adapt this work, including for commercial purposes, under the following conditions:
Attribution—Please cite the work as follows: De Vreyer, Philippe, and François Roubaud, Editors. 2013.
Urban Labor Markets in Sub-Saharan Africa. Africa Development Forum series. Washington, DC: World
Bank. doi:10.1596/978-0-8213-9781-7. License: Creative Commons Attribution CC BY 3.0
Translations—If you create a translation of this work, please add the following disclaimer along with the attribution: Th is translation was not created by Th e World Bank and should not be considered an offi cial World Bank translation. Th e World Bank shall not be liable for any content or error in this translation. All queries on rights and licenses should be addressed to the Offi ce of the Publisher, Th e World Bank, 1818 H Street NW, Washington, DC 20433, USA; fax: 202-522-2625; e-mail: [email protected]. ISBN (paper): 978-0-8213-9781-7
ISBN (electronic): 978-0-8213-9782-4 DOI: 10.1596/978-0-8213-9781-7
Cover image: ©Michelle Saint-Léger, IRD, 2013.
Cover design: Debra Naylor, Naylor Design, Inc.
Library of Congress Cataloging-in-Publication Data
Vreyer, Philippe De.
Urban labor markets in sub-Saharan Africa/Philippe De Vreyer and François Roubaud.
p. cm.
Includes bibliographical references and index.
ISBN 978-0-8213-9781-7 — ISBN 978-0-8213-9782-4 (electronic)
1. Labor market—Africa, Sub-Saharan. 2. Africa, Sub-Saharan—Economic conditions. 3. City dwellers—Employment—Africa, Sub-Saharan. I. Roubaud, François. II. World Bank. III. Title.
HD5837.A6V74 2013
331.120967—dc23
2012050217
Th e French translation of this book is copublished by Agence Française de Développement and Institut
de Recherche pour le Développement (IRD). Th e IRD, a French public research institute emphasizing
interdisciplinarity, has focused its research for more than 65 years on the relationship between man and its environment in Africa, Asia, Latin America, the Mediterranean, and the French tropical overseas ter-ritories. Its research, training, and innovation activities are intended to contribute to the social, economic, and cultural development of southern countries. For further information: www.editions.ird.fr.