A. Abdurrochman (1)
, B.Y. Tumbelaka, E. Mumar, S. Chuniroh, A.P. Septia.
Electronics and Biophysical Instrumentation Research Group, Department of Physics, Faculty of Mathematics and Natural Sciences,
Universitas Padjadjaran
Jl. Raya Bandung-Sumedang KM.21, Jatinangor, Sumedang 45363, West Java.
(1)
Abstract:
Human speeches can be recognized from their paralinguistic and linguistic point of view. The development of artificial-intelligence machines required the ability of the system to recognize the emotional of the speakers. The emotional condition of the speakers (sadness, happiness and anger) could be identified from the speeches intonation differences characterized by their different physical parameter such as: pitch, duration, intensity and formants. These physical parameters extracted from recorded human speeches in different emotional condition. In order to analyze their emotional condition from their physical parameters we employed Principal Component Analysis (PCA) to see the distribution of these parameters to indicate different emotional condition. PCA is the statistical method to see data distribution. The results of PCA1 vs. PCA2 distribution indicate unique characteristic emotional components for every emotional condition. Our method successfully differentiates the emotional condition base on human speeches.
Key words: Emotion, Human Speeches, and Principal Component Analysis.
1. Introduction
Voice or speech is the most common media in human’s communication. It delivers
communicator’s information to communicant. There is additional information on
face-to-face communications that communicant can get by seeing the gestures and mimics of the
communicator, i.e. emotions. Maybe, that’s the reason why videophone technology
introduced. If the communicant is a machine, could it get this additional information to?
Some research had been conduct to get emotional information from the gestures and
mimics, but it applied for the certain socio-cultural only. There are differential gestures or
mimics to express same emotions in every socio-cultural.
Linguistic is not the only information can be drawn from speech. There’s also
paralinguistic, which can be acquired by processing man’s speech signal to get its
physical parameters.
2. Emotional Speech
Amran Halim (1984) stated that intonation has the function of:
- Grammatical: it defines the meaning of a sentence.
- Emotional: it indicates or marking the emotion.
In the relation to intonation, Dimitrios Ververidis (2003) stated that intonation is the
element of paralinguistic, which sometimes takes importance rules in communication. It
occurred on the differentiation in emotional signal, i.e. pitch, which indicates the number
of vibrations, quality, duration and rhymes of the voice, that is for coding and decoding
information. Intonation could inform sex, age, physical and emotional condition, i.e. sad,
angry and happy, and personality of the speaker or communicator.
In order to recognize the emotional speech, Moriyama (2002) stated that the process
of human’s emotional speech recognition including the recognition for every emotion, i.e.
sadness, happiness, anger, etc. conducted different extraction and analyzing. To analyze
human’s emotional speech, the understanding of speech characterization called subjective
quality is needed. Subjective quality involving physical parameters, which had
mathematical values and units, will make analyzing process a lot easier.
3. Speech Analysis
The information of a speech can be analyzed in many different ways. The
researcher had classified some approximating level to describe it, i.e.: level of acoustic,
level of phonetic, level of phonology, level of morphology, level of syntactic and level of
semantic (I Made Joni, 2003). In this paper, level of morphology, level of syntactic and
level of semantic are neglected concerning on emotional speech analysis, which related to
physical parameters such as fundamental frequency (F0), phoneme’s duration and
Intonation or prosody as the acoustical aspect of the speech is taking the main role,
using phonemes, on identifying every acoustical segment. Every phoneme produced by
the movement of vocal tract during articulation, which influencing the speeches spectral
of spectrum dynamics (so called Formant). Phoneme can be long or short, hard of soft
and had varies of patterns of pitch. Intonation has domain of interpretation beyond
phonetic. In particular, intonation relates to duration and fundamental frequency (F0) of
the row of speeches. The pronouncing of a word, which may vary in intonation, effects
on its identity.
Emphasizing a phoneme by giving the pressured on it among the others is the main
function of prosody. This pressured phoneme characterized by its longer duration, more
intension and/or had F0 pattern which make it stood out among the other phonemes.
4. Hypothesis
There are three components considered the most important parameters in the
intonation’s sentence. Which are pitch, phoneme’s duration and voice’s intensity.
Pitch defines as the amount of vibration or the wave produces by the source of the
sound. More vibrations mean higher tone. It could reflect the emotional condition such
as, fear, sadness, passions, anger, sincerity, etc. It could emphasize the effects of words
spoken. Some research clarifies that pitch is used to reveal self-identity, emotional
condition and to influence other peoples (Addington, 1968).
Based on that, we presume if there was some unique information so we can
acknowledge the emotional condition of the speaker right away. To establish this
hypothesis we search for physical values or physical parameter in the spoken sentences.
And we design the research flowchart as follows in Picture 1.
5. Sample Accusation
We took speeches sample of Indonesia Language from the dialogues of movies as
acting mode of the speeches and from digitally recorded dialogues of volunteer as natural
and normal mode of the speeches. Acting mode define as the acting emotion of speeches
and natural mode define as the real emotion of speeches which were taken when the
mode define as no-emotional speech. The normal mode of speeches was taking from
rephrasing dialogues of acting and natural mode of speeches taking in soundproof room.
Fitting to categories Sample Accusation
Segmented and categorized
Parameters determining
Parameters examining
Auditory Acceptance
Parameters Analysis
Yes
Yes
No Start
No
End
6. Physical Parameters Analysis Method
The obtaining physical parameters analyzed using PCA method. This method
employed to inquire distribution of speech’s signals and the dominants parameters in
emotional speeches. The PCA method reduces a lot of variables to some variables but
still could inform the whole variables. The processes steps are:
1. Putting data in matrices m x n, whereas n is the columns of parameters and m is
the rows of speeches. There are 8 physical parameters as variables in this
matrices, so we had the matrix B as:
2. Eliminating means of each column by its matrices component. For the average of
3. Obtaining covariant P.
P = C’ * C 6.5.
4. Obtaining Eigen values and vectors of P.
a. Eigen values: P− λI = 0 6.6.
b. Eigen vectors: P− λI x= 0 6.7.
5. Obtaining new variables
PCA = H * L (:,i) 6.8.
For H: standardized matrices
L (:,i): vector of Eigen values for each column.
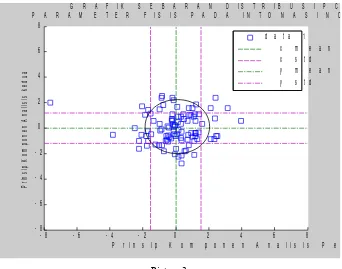
The whole processes obtained physical parameters distribution for each
categorized emotional speech as shown in Picture 2 and Picture 3.
- 6 - 4 - 2 0 2 4 6
- 6 - 4 - 2 0 2 4 6
G R A F I K S E B A R A N D I S T R I B U S I P C
P A R A M E T E R F I S I S S U A R A N A T U R A
P r i n s i p K o m p o n e n A n a l i s i s P e
P
ri
n
s
ip
K
o
m
p
o
n
e
n
A
n
a
lis
is
k
e
d
u
a
d a t a 1 x m e a n x s t d y m e a n y s t d
Picture 2.
- 8 - 6 - 4 - 2 0 2 4 6 8 - 8
- 6 - 4 - 2 0 2 4 6 8
G R A F I K S E B A R A N D I S T R I B U S I P C P A R A M E T E R F I S I S P A D A I N T O N A S I N O
P r i n s i p K o m p o n e n A n a l i s i s P e
P
ri
n
s
ip
K
o
m
p
o
n
e
n
A
n
a
lis
is
k
e
d
u
a
d a t a 1 x m e a n x s t d y m e a n y s t d
Picture 3.
Physical parameters distribution for natural mode of anger of man speeches
From the graphs of PCA2 vs. PCA1 for each categorized emotional speech we could obtain its means and standard deviation as shown in Table 1.
Table 1.
Physical parameters distribution
Categorized Emotion
Woman Man
Mean Standard Deviation Mean Standard Deviation
x ( PCA1) y (PCA2) x ( PCA1) y (PCA2) x ( PCA1) y (PCA2) x ( PCA1) y (PCA2)
Sad
Natural 8.82E-15 1.16E-15 1.640 1.306 -4.48E-15 3.01E-15 1.587 1.255
Acting -1.52E-15 -2.85E-15 1.689 1.185 -3.76E-15 -3.19E-15 1.837 1.237
Normal 1.57E-15 2.25E-14 1.544 1.415 -6.82E-16 6.40E-15 1.757 1.170
Anger
Natural 2.30E-14 -3.37E-15 1.273 1.159 5.79E-15 -5.10E-15 1.385 1.212
Acting 6.07E-15 7.66E-16 1.575 1.302 -1.61E-14 -6.12E-15 1.395 1.266
Normal 5.52E-15 -4.70E-15 1.649 1.197 1.20E-14 -9.77E-15 1.516 1.200
Happy
Natural 1.77E-12 1.62E-14 1.347 1.248 4.92E-13 4.70E-12 1.338 1.222
Acting 7.23E-13 3.05E-14 1.679 1.220 4.05E-13 -2.23E-15 1.715 1.234
Normal -6.07E-15 -3.29E-15 1.527 1.207 2.32E-15 2.30E-15 1.759 1.241
To obtain the dominants parameters, we inverted the whole data that produced
graphs of PCA2 vs. PCA1 which in serial of speeches to serial of parameters. Then, we
had new graph of PCA2 vs. PCA1. One of these graphs is shown in Picture 4. We could
out to all new inverted graphs that these 3 parameters always share the same region. It
indicates that the value of these 3 parameters from the inquired speeches share the same
uniform and unique features. Thus, we concluded these 3 parameters are the dominant
parameters that we did not use 5 others for further analysis.
- 1 0 - 5 0 5 1 0 1 5 2 0
- 0 . 2 - 0 . 1 0 0 . 1 0 . 2 0 . 3 0 . 4 0 . 5
G R A F I K S E B A R A N D I S T R I B U S I P C A 2 T E P A R A M E T E R F I S I S D O M I N A N S U A R A N A T U
P r i n s i p K o m p o n e n A n a l i s i s P e r t a m a
P
ri
n
s
ip
K
o
m
p
o
n
e
n
A
n
a
li
s
is
k
e
d
u
a
D u r a s i P i t c h I n t e n s i t a s F o r m a n 1 F o r m a n 2 F o r m a n 3 F o r m a n 4 F o r m a n 5
Picture 4.
The distribution of dominant physical parameters for natural mode of anger of man speeches
7. Comparison of Physical Parameters Distribution
Since there are 3 dominant physical parameters, the emotional analysis used these
parameters only by comparing the dominant physical parameters of natural mode to
acting mode and normal mode. Picture 5 is shown the comparison of natural mode to
normal mode. We could see the comparing distribution has different distribution pattern.
And it appeared that all natural modes are differed from acting modes or normal modes.
But, sometimes it’s not easy to see these unique distribution patterns. Therefore, we used
back-propagation Artificial Neural Network (ANN) programming from MatLab®’s
toolbox to recognize the dominant physical parameters distribution pattern of natural
- 4 - 3 - 2 - 1 0 1 2 3 4 - 5
- 4 - 3 - 2 - 1 0 1 2 3 4
G r a f i k d i s t r i b u s i P C A 2 t e r h a d a p P C A 1 p a r a m
P r i n s i p K o m p o n e n A n a l i s i s P e r t a m
P
ri
n
s
ip
K
o
m
p
o
n
e
n
A
n
a
li
s
is
k
e
d
u
a
n a t u r a l s e d i h n o r m a l s e d i h x m e a n x s t d y m e a n y s t d
Picture 5.
The comparison of physical parameters distribution of natural mode of sad of woman speeches to its normal mode
The dominant physical parameters dataset for each natural mode are used for
ANN program to recognize the distribution pattern as its related emotion. This task called
learning process of ANN. According to several learning processes, we founded out that
the best learning method was traingda (gradient descent adaptive) since it had the
minimum mean square error (MSE) at 0.04 and number of epoch/iteration at 100 for the
network architecture of [20 10 1]. So, we built the ANN program that had 2 hidden
layers: 20 neurons and 10 neuron each, and 1 neuron at output layer. At output layer, we
define minus 1 (-1) as sad, zero (0) as anger and one (1) as happy. So, if the output has
different value out of –1 to 1, it is not the natural emotion of sad, anger or happy. Thus,
we proceeded to learning process of ANN.
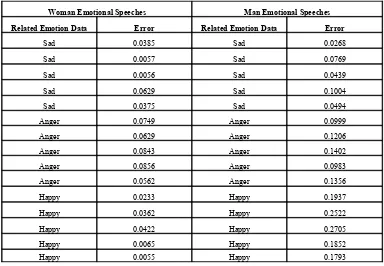
Afterward, we tested it out with the others data to see whether it could recognize
them related to the right emotion. We prepared 15 testing data for each sex category or 10
data for each natural emotion (see Table 2). The testing results, Table 2, show that they
had maximum error of 0.2705 or minimum accuracy of 99.7295% to recognize the
Table 2. ANN’s testing results
Woman Emotional Speeches Man Emotional Speeches
Related Emotion Data Error Related Emotion Data Error
Sad 0.0385 Sad 0.0268
Sad 0.0057 Sad 0.0769
Sad 0.0056 Sad 0.0439
Sad 0.0629 Sad 0.1004
Sad 0.0375 Sad 0.0494
Anger 0.0749 Anger 0.0999
Anger 0.0629 Anger 0.1206
Anger 0.0843 Anger 0.1402
Anger 0.0856 Anger 0.0983
Anger 0.0562 Anger 0.1356
Happy 0.0233 Happy 0.1937
Happy 0.0362 Happy 0.2522
Happy 0.0422 Happy 0.2705
Happy 0.0065 Happy 0.1852
Happy 0.0055 Happy 0.1793
8. Conclusions
1. Emotional condition of a speaker can be identified from his speeches
physical parameters.
2. There are 3 dominant physical parameters of emotional speech, i.e. pitch,
duration and intensity.
3. PCA exhibit the distribution of dominant physical parameters has different
distribution pattern for each emotional condition.
4. Artificial Neural Network programming may be built for emotional
recognition based on speeches (dominant) physical parameters, which is
confirmed the existence of distribution pattern for each emotional condition.
References:
Amran Halim, 1984. Intonasi dalam Hubungannya dengan Sintaksis Bahasa
Dennis Roddy, et all. 1984. Komunikasi Elektronika jilid satu, Lakehead University Thunder Bay, Erlangga, Jakarta.
Dimitrios Ververidis, et all. 2003., Automatic Emotional Speech Classification,
Artificial Intelligence and Information Analysis Laboratory Departement of
Informatics, Aristotle University of Thessaloniki, Greece.{jimver, costas, pitas }
@zeus.csd.auth.gr.
Furui & Sadaoki.1985. Digital Speech Processing, Synthesis, and Recognition, Tokai
University Press, Tokyo..
I Made Joni & Ani Handayani S, 2003. Analisis Besaran Fisis Pada Rekognisi Sinyal
Suara Manusia, Jurusan Fisika FMIPA UNPAD, Bandung.
I Made Joni, dkk,. 1998. Perancangan Sistem Absensis Suara Berbantuan PC,
Penelitian Lomba Karya Ilmiah Inovatif Produktif (LKIP), Seminar di UNDIP, Semarang.
Jhon G.Proakis & Dimitris G.Manolakis. 1997, Pemrosesan Sinyal Digital jilid 1, PT
Prenhallindo, Jakarta.
Moriyama, Tsuyosi, shinji Ozawa. 2002., Evaluation Of The Relation Between
Emosional Concepts and Emotional Parameters in Speech. Departement of information and Computer Science, Keio University, Japan. Moriyama @sak.iis.u-tokyo.ac.jp
Rossing, Thomas D.1990., The Science Of Sound 2nd
edition, Northern Illinois University, Addison-Wesley Publishing Company..
Yasuhisa Niimi et all..2002. Masanori Kasamatu, Takuya Nishimoto, Masahiro Araki,
Synthesis Of Emotional Speech Using Prosodically Balanced VCV Segments,