ROUTE AND TRANSPORTATION COSTS ANALYSIS CONSIDERING THE CITY
LOGISTICS SYSTEM FOR SINGLE DEPOT PROBLEM
(CASE STUDY: JABABEKA INDUSTRIAL AREA COMPANIES)
Yogi Yogaswara*)
Program Studi Teknik Industri Fakultas Teknik – Universitas Pasundan
Abstract: Urban freight transport recently faces many challenging problems, including high levels of traffic congestion, negative environmental impacts,and high energy consumption. Evaluation measures that can be done is by determining the routing and scheduling.PT. TMU was that produces various types of paints which are marketed to companies located in the industrial area of Kabupaten Bekasi and Jakarta. Determination of route by the company on the basis of the views and considerations vehicle payload capacity and usability of the vehicle. This study wasconductedto developthedeterminationthatcan bedone by considering thecarrying capacityand time windows, as well as consideringenvironmental aspects, reducingthe impact ofcongestion, socialaspects, andenergyconsumption. The model usedin the form ofconceptCapacity Vehicle Routing Problem with Time Windows (CVRPTW) approach Savings on application Logware 5.0. This method are used inthe case ofthe VRPby considering thecapacity, andtheminimum cost. The result ofthecalculationaffectssomeaspects include savingsgeneratedmileageof 32.48%,efficiencypayload capacityratio of84.8%,savingtransportation costs27.10, saving tol revenue 54,24%,emission reduction3.85%, and then decrease inthe number ofcitizen complaintsas much as5,22%.
Keywords: CVRPTW, Savings Heuristics Algorhitm, City Logistics, Single Depot
I. INTRODUCTION1
Socio-economically, the city is an environment with economic and the diverse business and is dominated by non-farm business activities include services, trade, transportation and industrial [1]. The rapid development of urban areas in Indonesia could not be separated from the role of logistics. One of the key activities in
1Staf pengajar Prodi Teknik Industri UNPAS
logistics is on transport, in this case is freight transport.
partner company to be sent to the outer islandsof Java are located in parts of Jakarta
The phenomena that occur in the company related to the transport logistics are expenses incurred from transportation activities undertaken by the company deemed high enough so that it takes the reduction of transport costs in order to save costs incurred by the company. In addition, the lack of good planning related to transportation logistics activities is a phenomenonof the next issue, so the determination of route and cost analysis of transportation before the operation deemed necessary by the company so that the company can carry out the necessary assessment of costs intrans port logistics activities to be performed.
So in this case is necessary to make decisions about who canoptimize the mileage or travel costs, travel time, number of operated vehicles and other resources are available by considering environmental aspects, reducing the impact oft raffic congestion, socialaspects, as well as energy consumption required from the movement of freight transport.
Problem determination of routing and scheduling are the operational issues in transportation. Studies conducted in PT. TMU are transport operations in logistics. The Company are marketed to companies located in the industrial
area of Kabupaten Bekasi and an expedition partner company to be sent to the outer islands of Java are located in parts of Jakarta.
The phenomena that occur in the company related to the transport logistics are expenses incurred from transportation activities undertaken by the company deemed high enough so that it takes the reduction of transport costs in order to save costs incurred by the company. In addition, the lack of good planning related to transportation logistics activities is a phenomenon of the nex tissue, so the determination of route and cost analysis of transportation before the operation deemed necessary by the company so that the company can carry out the necessary assessment of costs in transport logistics activities to be performed.
So in this case is necessary to make decisions about who can optimize the mileage or travel costs, travel time, number of operated vehicles and other resources are available by considering environmental aspects, reducing the impact of traffic congestion, social aspects, as well as energy consumption required from the movement of freight transport.
II. METHODOLOGY
of Several Stakeholders” [2], There are five categories stakeholders which are in issue in this study include:
1. Freight carrier with criteria transportation cost.
2. Shippers with criteria transport travel time. 3. Urban expressway operators with criteria
toll revenue.
4. Residents with criteria total NOx emissions in the network. The residents would make a complaint against the administrators whenever the NOx emissions for their zones exceed 50g per 1km.
5. Administrator with criteria total NOx emissions in the network and Total number of complaints from the residents.
Table1 Details of Consumer
No. Company Name Demand (kg)
1 PT. Astra Daihatsu Motor (Engine Plant) 1907,4
2 PT. Akashi Wahana Indonesia 53,66
3 PT. Walsin Lippo Industries 113,42
4 PT. Sanggar Sarana Baja 277,6
5 PT. Fortuna Indah 60
6 CV. Multi Teknik Bekasi 76,93
7 PT. Cameron Services International 51,39
8 CV. Super Perdana (Expedition Partner) 1027,75
9 PT. Sekawan Maju Bersama (Expedition Partner) 261,55
10 PT. Sekawan Kontrindo (Expedition Partner) 841,2
11 PT. Bintang Anugrah Sehati 154,09
12 PT. Manado Teknik Mandiri (Expedition Partner) 268,3
Table 2
Data Fixed and Variabel Cost of Vehicle 1
Brand/Type of Vehicle : Isuzu NHR 55 Year 2006 Pay Load Person (kg) : 120
Pay Load Goods (kg) : 2000
Total Fixed Cost/day Rp. 92.674
Total Variable Cost/km Rp. 260
Table3
Data Fixed and Variabel Cost of Vehicle 2
Brand/Type of Vehicle : Suzuki ST 150 Pickup Year 2013 Pay Load Person (kg) : 120
Pay Load Goods (kg) : 800
Total Fixed Cost/day Rp. 96.372
Total Variable Cost/km Rp. 61
Source: Data ProcessingCompanies
City Logistics measures will significantly affect the energy consumption of freight vehicles by improving and rationalising urban freight transport systems. Yamada (1980) was taken
from Taniguchi et al (2001) developed a model for estimating fuel consumption using on-road test data [3]. Equation 1 is the model equations of the estimated fuel consumption.
fe = 6,372 – 0,716rg – 0,193ts– 1,392ga – 1,412a + 0,138V – 0,001V2 (1)
where:
fe : fuel economy (km/litre)
rg : 1 for gravel road, 0 for asphalt pavement
ts : stopped time (min.)
ga : average gradient (%)
a : 1 when AC is on, 0 when AC is off V : average travel speed (km/jam)
There are numerous undesirable negative effects from urban goods movement that can be present a direct risk to human health.
determining the total NOx emissions of pollutants is to use a reference emission factor of the Indonesian Ministry of Environment drawn from scientific journals Srikandi Novianti dan
Driejana (2009) entitled “The Influence of Factor Emission Characteristics In Transport-Induced Nitrogen Oxides (NOx) Emission Load Estimation” as can beseen in Table 4.
Table 4
Emission Factor Data in Indonesia
Category CO (g/km) HC (g/km) NOx (g/km) PM10 (g/km) CO2 (g/kgBBM) SO2 (g/km)
Motorcycle 14 5,9 0,29 0,24 3180 0,008
Passenger cars
(gasoline) 40 4 2 0,01 3180 0,026
Passenger cars
(diesel fuel) 2,8 0,2 3,5 0,53 3172 0,44
Passenger cars 32,4 3,2 2,3 0,12 3178 0,11
Bus 11 1,3 11,9 1,4 3172 0,93
Truck 8,4 1,8 17,7 1,4 3172 0,82
Public
Transportation 43,1 5,08 2,1 0,006 3180 0,029
Source: [4], [5]
Then for the decision model of stakeholders level satisfaction city logistics system starts from stage calculation Capacity Vehicle Routing Problem With Time Windows (CVRPTW) approach Clarke &Wright Savings Heuristics Algorhitm.
This method is used for the VRP case by considering the capacity, and the minimum cost route followed by obstacles in the distribution
1. Set the distance at the beginning of each route for each node.
2. Calculate each pair using the savings equation (Equation 2).
3. Create a list ranking of each pair are different.
5. Next check back every couple route that have been generated.
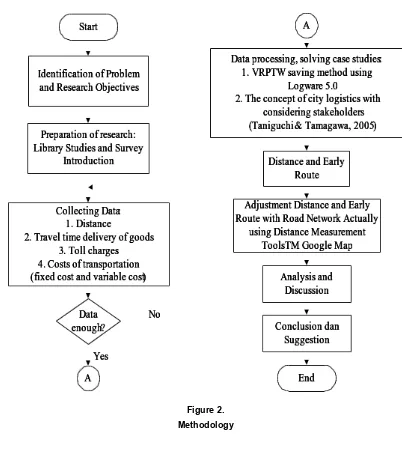
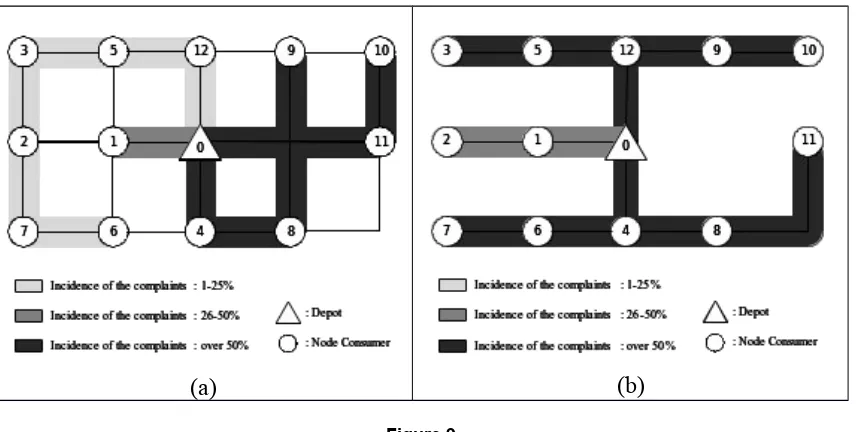
General overview of the steps problem solving methodology can be seen in Figure 2 below in the form of a flowchart.
Figure 2. Methodology
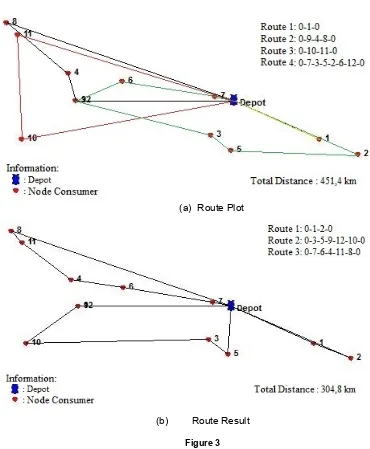
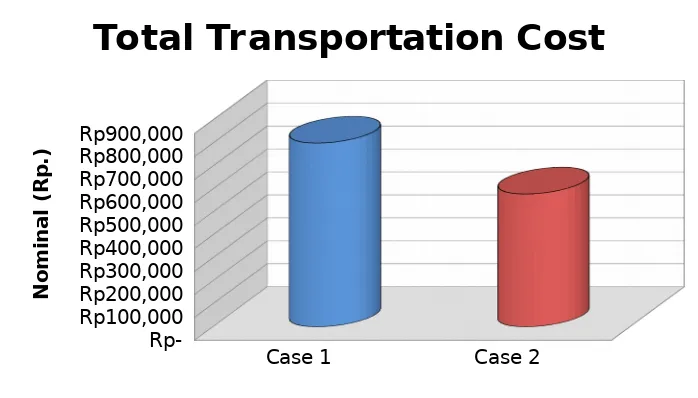
plot. Figure 4 presents the comparison of the transportation cost cases. The total emission of NOx can be seen in the Figure 6.
(a) Route Plot
(b) Route Result
Figure 3
Case 1 Case 2 Rp-
Rp100,000 Rp200,000 Rp300,000 Rp400,000 Rp500,000 Rp600,000 Rp700,000 Rp800,000 Rp900,000
Total Transportation Cost
N
o
m
in
a
l
(R
p
.)
Figure 4
Comparison Chart of Total Transportation Cost
Case 1 Case 2
- 100 200 300 400 500 600 700
Transport Travel Time
M
in
u
te
Figure 5
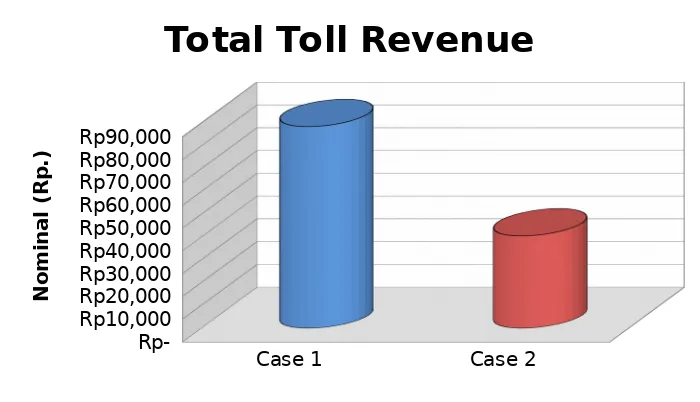
Case 1 Case 2 Rp-
Rp10,000 Rp20,000 Rp30,000 Rp40,000 Rp50,000 Rp60,000 Rp70,000 Rp80,000 Rp90,000
Total Toll Revenue
N
o
m
in
a
l
(R
p
.)
Figure 6
Comparison Chart of Total Toll Revenue
Case 1 Case 2
5,250 5,300 5,350 5,400 5,450 5,500 5,550 5,600 5,650
Total NOx Emissions
G
ra
m
Figure 7
Case 1 Case 2 100
102 104 106 108 110 112 114 116
Number of Residents Complaint
T
im
e
s
Figure 8
Comparison Chart The Number of Residents Complaint
(a)
(b)
Figure 9
Mileage
Occupance Rate
Tr ansportation Cost
Tr ansport Tr avel Time To ll Revenue
Comparison Chart of Performance Level
IV. CONCLUSION
Results calculated by Clarke and Wright Savings Algorithm approach using application Logware 5.0 obtained 3 route of distribution that can be done by the company include:
1. First route with the consumer point 0–1–2 – 0 by distance 66.9km hauling total demand as much as1961.06kg,
2. Second route with the consumer point 0 – 3 – 5 – 9 – 12 – 10 – 0 by distance114km hauling total demand as much as1544,47 kg, and
3. Third route with the consumer point 0 – 7 – 6 – 4 – 11 – 8 – 0 by distance123.9km hauling total demand as much as1587.76 kg.
Where the whole targeted of node consumers using the vehicle in the form of a single ankle truck axis configuration with 1-1 (4 wheel). Furthermore, the data processing is done affects many aspects. These aspects include:
1. Savings generated mileage of 146.6km (32.48%) so that an increase in the level of performance with the actual conditions of 1.48.
2. Efficiency pay load capacity ratio (occupancy rate) of 84.8% where there is a difference in the numbers with the existing conditions in the company amounted to 9.44% so that an increase in performance level of 1.17.
performance level of 1.38 and savings toll revenue Rp. 48,000 (54.24%) with the increase in performance level of 1.84. 4. Transport travel time during 610 minutes
with the decrease in performance level of 0.80, where the difference of time with the actual conditions which produced for 119 minutes. Although there is a resulting decrease in the level of performance, but it does not happen constraints exceeds a residents as much as 6 times (5.22%) with the increase in performance level of 1.06.
V. REFERENCES
[1] Daluarti, M.H.C. 2009. Perencanaan Kota, (Online), (http://file.upi.edu/ Direktori/ FPIPS/ LAINNYA/ MEITRI_HENING/ Bahan_Presentasi/
9%2610_Perencanaan_Kota.pdf, Accessed October, 30th 2014 10:47am WIB)
[2] Taniguchi, E., & Tamagawa, D., 2005. Evaluating City Logitics Measures Considering The Behaviour of Several Stakeholders, Journal of The Eastern Asia
Society for Transportation Studies, Vol. 6, pp. 3062-3076.
[3] Taniguchi, E., Thompson R.G., Yamada, T. & Duin R. V., 2001, City Logistic: Network Modelling and Intelligent Transport Systems, Pergamon, Amsterdam.
[4] Novianti, S. & Driejana. 2009. Pengaruh Karakteristik Faktor Emisi Terhadap Estimasi Beban Emisi Oksida Nitrogen diakses 6 Oktober 2014 pkl. 04:57 WIB)
[5] Hidayatullah, E.R. 2011. Estimasi Beban Emisi Dan Konsentrasi SO2 Dari Sektor Transportasi Dengan Model DFLS Studi Kasus Surabaya Selatan (Jl. Gayungsari Barat), (Online), (http://digilib.its.ac.id/
public/ITS-Undergraduate-17381-3307100041-Paper-pdf.pdf, diakses 6 Oktober 2014 pkl. 10:30 WIB)
![Figure 1Savings Concept Illustration [5]](https://thumb-ap.123doks.com/thumbv2/123dok/1341341.2014689/5.547.58.491.205.358/figure-savings-concept-illustration.webp)