ROUTE AND TRANSPORTATION COSTS ANALYSIS CONSIDERING THE CITY
LOGISTICS SYSTEM FOR SINGLE DEPOT PROBLEM (CASE STUDY:
JABABEKA INDUSTRIAL AREA COMPANIES)
Yogi Yogaswara
Industrial Engineering Dept., Pasundan University, Bandung, Indonesia [email protected]
ABSTRACT
Urban freight transport recently faces many challenging problems, including high levels of traffic congestion, negative environmental impacts,and high energy consumption. Evaluation measures that can be done is by determining the routing and scheduling. PT. TMU was that produces various types of paints which are marketed to companies located in the industrial area of Kabupaten Bekasi and Jakarta. Determination of route by the company on the basis of the views and considerations vehicle payload capacity and usability of the vehicle. This study was conducted to develop the determination that can be done by considering the carrying capacity and time windows, as well as considering environmental aspects, reducing the impact of congestion, social aspects, and energy consumption. The model used in the form of concept Capacity Vehicle Routing Problem with Time Windows (CVRPTW) approach Savings on application Logware 5.0. This method are used in the case of the VRP by considering the capacity, and the minimum cost. The result of the calculation affects some aspects include savings generated mileage of 32.48%, efficiency payload capacity ratio of 84.8%, saving transportation costs 27.10, saving tol revenue 54,24%, emission reduction 3.85%, and then decrease in the number of citizen complaints as much as 5,22%.
Keywords: CVRPTW, Savings Heuristics Algorhitm, City Logistics, Single Depot
1. INTRODUCTION
Socio-economically, the city is an environment with economic and the diverse business and is dominated by non-farm business activities include services, trade, transportation and industrial (Daluarti, 2009). The rapid development of urban areas in Indonesia could not be separated from the role of logistics. One of the key activities in logistics is on transport, in this case is freight transport.
Problem determination of routing and scheduling are the operational issues in transportation. Studies conducted in PT. TMU are transport operations in logistics. The Company are marketed to companies located in the industrial area of Kabupaten Bekasi and an expedition partner company to be sent to the outer islands of Java are located in parts of Jakarta
The phenomena that occur in the company related to the transport logistics are expenses incurred from transportation
deemed high enough so that it takes the reduction of transport costs in order to save costs incurred by the company. In addition, the lack of good planning related to transportation logistics activities is a phenomenon of the next issue, so the determination of route and cost analysis of transportation before the operation deemed necessary by the company so that the company can carry out the necessary assessment of costs in transport logistics activities to be performed.
So in this case is necessary to make decisions about who can optimize the mileage or travel costs, travel time, number of operated vehicles and other resources are available by considering environmental aspects, reducing the impact of traffic congestion, social aspects, as well as energy consumption required from the movement of freight transport.
2. LITERATURE REVIEW
in the definition promulgated by the Council of Logistics Managements (CLM), a professional organization of logistics managers, educators, and practitioners formed in 1962 for the purposes of continuing education and fostering the interchange of ideas. Its definition: “Logistics is that part of the supply chain process that plans, implements, and controls the efficient, effective flow and storage of goods, services, and related information from the point of origin to the point of consumption in order to meet customers requirements.
Transportation is a key decision area within the logistics mix. Except for the cost of purchased goods, transportation absorbs, on the average, a higher percentage will represent one-half to two-third of total
logistics cost (Ballou, 2004). Transportation is essential because no modern firm can operate without providing for the movement of its raw materials or its finished products.
Transportation decisions can involve mode selection, carrier routing, and vehicle scheduling (Ballou, 2004). Furthermore, urban freight transport plays a vital role in the sustainable development of cities (Taniguchi et al. 2001). a new area of transport planning has emerged called City Logistics. According to Taniguchi et al. (2001), City Logistics is the process of totally optimising urban logistics activities by considering the social, environmental, economic, financial and energy impacts of urban freight movement.
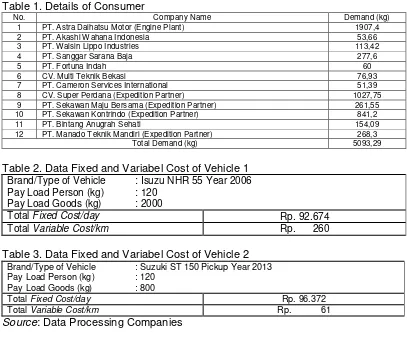
Table 1. Details of Consumer
No. Company Name Demand (kg)
1 PT. Astra Daihatsu Motor (Engine Plant) 1907,4
2 PT. Akashi Wahana Indonesia 53,66
3 PT. Walsin Lippo Industries 113,42
4 PT. Sanggar Sarana Baja 277,6
5 PT. Fortuna Indah 60
6 CV. Multi Teknik Bekasi 76,93
7 PT. Cameron Services International 51,39
8 CV. Super Perdana (Expedition Partner) 1027,75
9 PT. Sekawan Maju Bersama (Expedition Partner) 261,55
10 PT. Sekawan Kontrindo (Expedition Partner) 841,2
11 PT. Bintang Anugrah Sehati 154,09
12 PT. Manado Teknik Mandiri (Expedition Partner) 268,3
Total Demand (kg) 5093,29
Table 2. Data Fixed and Variabel Cost of Vehicle 1
Brand/Type of Vehicle : Isuzu NHR 55 Year 2006 Pay Load Person (kg) : 120
Pay Load Goods (kg) : 2000
Total Fixed Cost/day Rp. 92.674
Total Variable Cost/km Rp. 260
Table 3. Data Fixed and Variabel Cost of Vehicle 2
Brand/Type of Vehicle : Suzuki ST 150 Pickup Year 2013 Pay Load Person (kg) : 120
Pay Load Goods (kg) : 800
Total Fixed Cost/day Rp. 96.372 Total Variable Cost/km Rp. 61
Source: Data Processing Companies
3. METHODOLOGY
Referring to the journal published by Taniguchi and Tamagawa (2005) entitled
“Evaluating City Logistics Measures Considering The Behavior of Several Stakeholders”, There are five categories
stakeholders which is in issue in this study include:
1. Freight carrier with criteria transportation cost.
2. Shippers with criteria transport travel time. 3. Urban expressway operators with criteria
4. Residents with criteria total NOx emissions in the network. The residents would make a complaint againts the administrators whenever the NOx emissions for their zones exceed 50g per 1km.
5. Administrator with criteria total NOx emissions in the network and Total number of compalints from the residents.
City Logistics measures will significantly affect the energy consumption of freight vehicles by improving and rationalising urban freight transport systems. Yamada (1980) was taken from Taniguchi et al (2001) developed a model for estimating fuel consumption using on-road test data. The model equations of the estimated fuel consumption are:
fe = 6,372 – 0,716rg– 0,193ts– 1,392ga– 1,412a + 0,138V– 0,001V2 (1)
where:
fe : fuel economy (km/litre)
rg : 1 for gravel road, 0 for asphalt pavement
ts : stopped time (min.)
ga : average gradient (%)
a : 1 when AC is on, 0 when AC is off
V : average travel speed (km/jam)
There are numerous undesirable negative effects from urban goods movement that can be present a direct risk to human health. Greenhouse gases produced from exhaust gases of trucks are a major concern in many cities. In this case, the emission factors used in determining the total NOx emissions of
pollutants is to use a reference emission factor of the Indonesian Ministry of Environment drawn from scientific journals Srikandi Novianti dan Driejana (2009) entitled “The Influence of Factor Emission Characteristics In Transport-Induced Nitrogen Oxides (NOx) Emission Load Estimation” as can be seen in Table 4:
Table 4. Emission Factor Data in Indonesia
Category CO (g/km) HC (g/km) NOx (g/km) (g/km) PM10 COBBM) 2 (g/kg (g/km) SO2
Motorcycle 14 5,9 0,29 0,24 3180 0,008 Passenger cars
(gasoline) 40 4 2 0,01 3180 0,026 Passenger cars
(diesel fuel) 2,8 0,2 3,5 0,53 3172 0,44 Passenger cars 32,4 3,2 2,3 0,12 3178 0,11
Bus 11 1,3 11,9 1,4 3172 0,93
Truck 8,4 1,8 17,7 1,4 3172 0,82 Public
Transportation 43,1 5,08 2,1 0,006 3180 0,029
Source: Suhadi (2008) in Journal Srikandi Novianti, Driejana (2009) and Eben Ramadyan Hidayatullah (2011)
Then for the decision model of stakeholders level satisfaction city logistics system starts from stage calculation
Capacity Vehicle Routing Problem With Time Windows (CVRPTW) approach Clarke
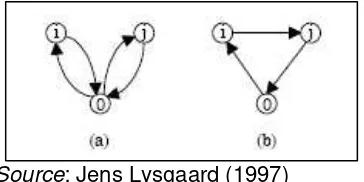
& Wright Savings Heuristics Algorhitm. This method is used for the VRP case by considering the capacity, and the minimum cost route followed by obstacles in the distribution system. In general, the savings equation is:
Source: Jens Lysgaard (1997)
Figure 1. Savings Concept Illustration
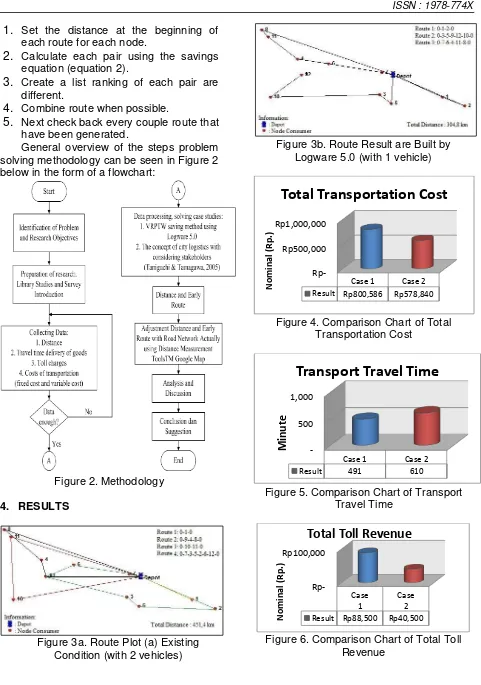
1.
Set the distance at the beginning of each route for each node.2.
Calculate each pair using the savings equation (equation 2).3.
Create a list ranking of each pair are different.4.
Combine route when possible.5.
Next check back every couple route that have been generated.General overview of the steps problem solving methodology can be seen in Figure 2 below in the form of a flowchart:
Figure 2. Methodology
4. RESULTS
Figure 3a. Route Plot (a) Existing Condition (with 2 vehicles)
Figure 3b. Route Result are Built by Logware5.0 (with 1 vehicle)
Figure 4. Comparison Chart of Total Transportation Cost
Figure 5. Comparison Chart of Transport Travel Time
Figure 6. Comparison Chart of Total Toll Revenue
Rp500,000 Rp1,000,000
Case 1 Case 2
Result Rp800,586 Rp578,840
N
o
m
in
a
l (R
p
.)
Total Transportation Cost
500 1,000
Case 1 Case 2
Result 491 610
M
in
u
te
Transport Travel Time
Rp100,000
Case 1
Case 2
Result Rp88,500 Rp40,500
N
o
mi
n
a
l (R
p
.)
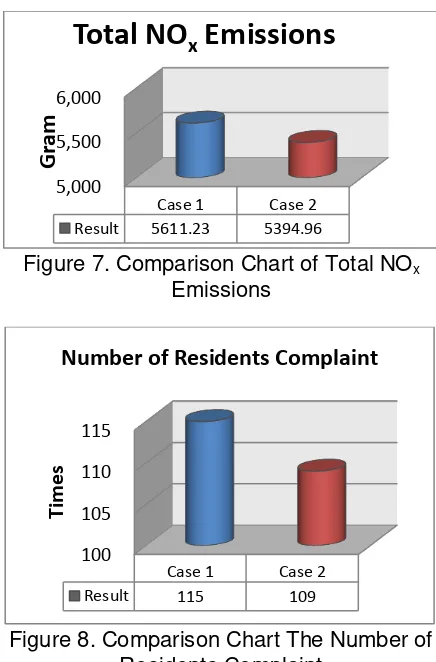
Figure 7. Comparison Chart of Total NOx Emissions
Figure 8. Comparison Chart The Number of Residents Complaint
Figure 9. Illustration of Road Network Number of Complaints Residents (a) Case 1
and (b) Case 2
Figure 10. Comparison Chart of Performance Level
5. CONCLUSION
Results calculated by Clarke and Wright Savings Algorithm approach using application Logware 5.0 obtained 3 route of distribution that can be done by the company include:
1.
First route with the consumer point 0 – 1– 2 – 0 by distance 66.9 km hauling total demand as much as 1961.06 kg,
2.
Second route with the consumer point 0– 3 – 5 – 9 – 12 – 10 – 0 by distance consumers using the vehicle in the form of a single ankle truck axis configuration with 1-1 (4 wheel). Furthermore, the data processing is done affects many aspects. These aspects include:
1.
Savings generated mileage of 146.6 km (32.48%) so that an increase in the level of performance with the actual conditions of 1.48.2.
Efficiency payload capacity ratio (occupance rate) of 84.8% where there is a difference in the numbers with the existing conditions in the company amounted to 9.44% so that an increase in performance level of 1.17.3.
Savings transportation costs Rp. 221.746 (27.10%) so that an increase in performance level of 1.38 and savingsNumber of Residents Complaint
the increase in performance level of performance level of 1.04,
6.
Decrease in the number of complaints residents as much as 6 times (5,22%) with the increase in performance level of 1.06.6. REFERENCES
(a) Ballou, R.H., 2004., Business Logistic/Supply Chain Management, Fifth Edition, Pearson Prentice Hall, USA.
(b) Ballou, R.H., 2004., Logware: Selected Computer Programs for Logistics/Supply Chain Planning Version 5.0, Weatherhead School of Management, Case Western Reserve University, USA.
(c) Bowersox, D.J., 2006., Manajemen Logistik 1 : Integrasi Sistem-sistem Manajemen Distribusi Fisik dan Manajemen Material. Edisi Terjemahan, Bumi Aksara, Jakarta.
(e) Hidayatullah, E.R. 2011. Estimasi Beban Emisi Dan Konsentrasi SO2 Dari Sektor
Transportasi Dengan Model DFLS Studi Kasus Surabaya Selatan (Jl. Gayungsari
Barat), (Online),
(http://digilib.its.ac.id/public/ITS- Undergraduate-17381-3307100041-Paper-pdf.pdf, diakses 6 Oktober 2014 pkl. 10:30 WIB)
(f) Lysgaard, J., 1997. Clarke & Wright’s Savings Algorithm, Department of Management Science and Logistics, The Aarhus School of Business, Denmark. (g) Novianti, S. & Driejana. 2009. Pengaruh
Karakteristik Faktor Emisi Terhadap Estimasi Beban Emisi Oksida Nitrogen
(NOX) Dari Sektor Transportasi (Studi
(h) Salaki, D.T. 2009. Penyelesaian Vehicle Routing Problem Menggunakan Beberapa Metode Heuristik Konstruktif.
Unpublished dissertation. Sekolah Pasca Sarjana IPB, Bogor.
(i) Salipadang, J.C. 2011. Analisis Sistem Pengangkutan Sampah Kota Makassar Dengan Metode Penyelesaian Vehicle Routing Problem (VRP). Unpublished thesis. Program Studi Teknik Indutri Jurusan Mesin Fakultas Teknik Unhas, Makassar.
(j) Taniguchi, E., & Tamagawa, D., 2005. Evaluating City Logitics Measures Considering The Behaviour of Several Stakeholders, Journal of The Eastern Asia Society for Transportation Studies, Vol. 6, pp. 3062-3076.
(k) Taniguchi, E., Thompson R.G., Yamada, T. & Duin R.v., 2001., City Logistic: