C)
Question #4 of 193
Question ID: 413257A) B) C)
Question #5 of 193
Question ID: 413312A) B) C)
Question #6 of 193
Question ID: 413212A) B) C)
0.900.
If the true mean of a population is 16.62, according to the central limit theorem, the mean of the distribution of sample means, for all possible sample sizes n will be:
16.62 / √n.
indeterminate for sample with n < 30. 16.62.
An article in a trade journal suggests that a strategy of buying the seven stocks in the S&P 500 with the highest earnings-to-price ratio at the end of the calendar year and holding them until March 20 of the following year produces significant trading profits. Upon reading further, you discover that the study is based on data from 1993 to 1997, and the earnings-to-price ratio is
calculated using the stock price on December 31 of each year and the annual reported earnings per share for that year. Which of the following biases is least likely to influence the reported results?
Time-period bias. Survivorship bias. Look-ahead bias.
The mean and standard deviation of returns on three portfolios are listed below in percentage terms:
Portfolio X: Mean 5%, standard deviation 3%. Portfolio Y: Mean 14%, standard deviation 20%. Portfolio Z: Mean 19%, standard deviation 28%.
Using Roy's safety first criteria and a threshold of 3%, which of these is the optimal portfolio?
Question #7 of 193
Question ID: 413234A) B) C)
Question #8 of 193
Question ID: 413278A) B) C)
Question #9 of 193
Question ID: 710142A) B) C)
Question #10 of 193
Question ID: 413259A) B) C)
Question #11 of 193
Question ID: 413293Joan Biggs, CFA, acquires a large database of past returns on a variety of assets. Biggs then draws random samples of sets of returns from the database and analyzes the resulting distributions. Biggs is engaging in:
discrete analysis. historical simulation. Monte Carlo simulation.
Which of the following statements about confidence intervals is least accurate? A confidence interval:
expands as the probability that a point estimate falls within the interval decreases. has a significance level that is equal to one minus the degree of confidence. is constructed by adding and subtracting a given amount from a point estimate.
Consider a random variable X that follows a continuous uniform distribution: 7 ≤ X ≤ 20. Which of the following statements is least accurate?
F(10) = 0.23.
F(12 ≤ X ≤ 16) = 0.307. F(21) = 0.00.
Frank Grinder is trying to introduce sampling into the quality control program of an old-line manufacturer. Grinder samples 38 items and finds that the standard deviation in size is 0.019 centimeters. What is the standard error of the sample mean?
A) B) C)
Question #12 of 193
Question ID: 413186A) B) C)
Question #13 of 193
Question ID: 413137A) B) C)
Question #14 of 193
Question ID: 413158A) B) C)
Question #15 of 193
Question ID: 413147The average U.S. dollar/Euro exchange rate from a sample of 36 monthly observations is $1.00/Euro. The population variance is 0.49. What is the 95% confidence interval for the mean U.S. dollar/Euro exchange rate?
$0.8075 to $1.1925. $0.7713 to $1.2287. $0.5100 to $1.4900.
Which of the following would least likely be categorized as a multivariate distribution?
The returns of the stocks in the DJIA.
The return of a stock and the return of the DJIA. The days a stock traded and the days it did not trade.
A probability distribution is least likely to:
contain all the possible outcomes. have only non-negative probabilities.
give the probability that the distribution is realistic.
Which of the following could be the set of all possible outcomes for a random variable that follows a binomial distribution?
(-1, 0, 1).
(0, 1, 2, 3, 4, 5, 6, 7, 8, 9, 10, 11). (1, 2).
A) B) C)
Question #16 of 193
Question ID: 413287A) B) C)
Question #17 of 193
Question ID: 413190A) B) C)
Question #18 of 193
Question ID: 413224X:(1,2,3,4) p(x) = 0.2. X:(1,2,3,4) p(x) = x / 10. X:(1,2,3,4) p(x) = (x × x) / 30.
The table below is for five samples drawn from five separate populations. The far left columns give information on the population distribution, population variance, and sample size. The right-hand columns give three choices for the appropriate tests: Z = z-statistic, and t = t-statistic. "None" means that a test statistic is not available.
Sampling From
Test Statistic Choices
Distribution Variance n
One Two Three
Normal
5.60
75
Z
Z
Z
Non-normal
n/a
45
Z
t
t
Normal
n/a
1000 Z
t
t
Non-normal 14.3
15
t
none
t
Normal
0.056
10
Z
Z
t
Which set of test statistic choices (One, Two, or Three) matches the correct test statistic to the sample for all five samples?
Two. One. Three.
The mean return of a portfolio is 20% and its standard deviation is 4%. The returns are normally distributed. Which of the following statements about this distribution are least accurate? The probability of receiving a return:
A) B) C)
Question #19 of 193
Question ID: 413316A) B) C)
Question #20 of 193
Question ID: 434206A) B) C)
Question #21 of 193
Question ID: 413164A) B) C)
Question #22 of 193
Question ID: 413166Given a holding period return of R, the continuously compounded rate of return is:
e − 1. ln(1 + R). ln(1 − R) − 1.
A research paper that reports finding a profitable trading strategy without providing any discussion of an economic theory that makes predictions consistent with the empirical results is most likely evidence of:
a sample that is not large enough. a non-normal population distribution. data mining.
The safety-first criterion focuses on:
SEC regulations. shortfall risk.
margin requirements.
A stock priced at $20 has an 80% probability of moving up and a 20% probability of moving down. If it moves up, it increases by a factor of 1.05. If it moves down, it decreases by a factor of 1/1.05. What is the expected stock price after two successive periods?
$22.05. $21.24. $20.05.
A total return index begins the year at 1350.23 and ends the year at 1412.95. A portfolio that tracks this index earns a total return
A) B) C)
Question #23 of 193
Question ID: 413142A) B) C)
Question #24 of 193
Question ID: 652911A) B) C)
Question #25 of 193
Question ID: 413146A) B) C)
of 3.65% for the year. The tracking error of this portfolio is closest to: -1.0%.
4.7%. 0.9%.
A random variable that has a countable number of possible values is called a:
continuous random variable. probability distribution. discrete random variable.
Cumulative Z-Table
z 0.05 0.06 0.07 0.08 0.09
2.4 0.9929 0.9931 0.9932 0.9934 0.9936 2.5 0.9946 0.9948 0.9949 0.9951 0.9952 2.6 0.9960 0.9961 0.9962 0.9963 0.9964 2.7 0.9970 0.9971 0.9972 0.9973 0.9974
The average return on the Russell 2000 index for 121 monthly observations was 1.5%. The population standard deviation is assumed to be 8.0%. What is a 99% confidence interval for the mean monthly return on the Russell 2000 index?
-0.4% to 3.4%. 0.1% to 2.9%. -6.5% to 9.5%.
If a smooth curve is to represent a probability density function, what two requirements must be satisfied? The area under the curve must be:
Question #26 of 193
Question ID: 413238A) B)
C)
Question #27 of 193
Question ID: 413317A) B) C)
Question #28 of 193
Question ID: 413145A) B) C)
Question #29 of 193
Question ID: 434219An analyst wants to generate a simple random sample of 500 stocks from all 10,000 stocks traded on the New York Stock Exchange, the American Stock Exchange, and NASDAQ. Which of the following methods is least likely to generate a random sample?
Using the 500 stocks in the S&P 500.
Listing all the stocks traded on all three exchanges in alphabetical order and selecting every 20th stock.
Assigning each stock a unique number and generating a number using a random number generator. Then selecting the stock with that number for the sample and repeating until there are 500 stocks in the sample.
The practice of repeatedly using the same database to search for patterns until one is found is called:
data mining. data snooping. sample selection bias.
In a continuous probability density function, the probability that any single value of a random variable occurs is equal to what?
Zero. 1/N. One.
Student's t-Distribution
Level of Significance for One-Tailed Test df 0.100 0.050 0.025 0.01 0.005 0.0005
A) B) C)
Question #30 of 193
Question ID: 413251A)
B) C)
Question #31 of 193
Question ID: 413185A) B) C)
Question #32 of 193
Question ID: 413228A) B) C)
40 1.303 1.684 2.021 2.423 2.704 3.551 60 1.296 1.671 2.000 2.390 2.660 3.460 120 1.289 1.658 1.980 2.358 2.617 3.373
The average salary for a sample of 61 CFA charterholders with 10 years experience is $200,000, and the sample standard deviation is $80,000. Assume the population is normally distributed. Which of the following is a 99% confidence interval for the population mean salary of CFA charterholders with 10 years of experience?
$172,514 to $227,486. $172,754 to $227,246. $160,000 to $240,000.
Which of the following statements regarding the central limit theorem (CLT) is least accurate? The CLT: states that for a population with mean µ and variance σ , the sampling distribution of the sample means for any sample of size n will be approximately normally distributed.
holds for any population distribution, assuming a large sample size.
gives the variance of the distribution of sample means as σ / n, where σ is the population variance and n is the sample size.
A multivariate distribution:
gives multiple probabilities for the same outcome. applies only to binomial distributions.
specifies the probabilities associated with groups of random variables.
Question #33 of 193
Question ID: 413315A) B) C)
Question #34 of 193
Question ID: 413208A) B) C)
Question #35 of 193
Question ID: 413242A) B) C)
Question #36 of 193
Question ID: 413167The average mutual fund return calculated from a sample of funds with significant survivorship bias would most likely be:
larger than the mean return of the population of all mutual funds. smaller than the mean return of the population of all mutual funds.
an unbiased estimate of the mean return of the population of all mutual funds if the sample size was large enough.
Which of the following portfolios provides the best "safety first" ratio if the minimum acceptable return is 6%?
Portfolio Expected Return (%) Standard Deviation (%)
1
13
5
2
11
3
3
9
2
1. 2. 3.
A sample of five numbers drawn from a population is (5, 2, 4, 5, 4). Which of the following statements concerning this sample is most accurate?
The sampling error of the sample is equal to the standard error of the sample. The mean of the sample is ∑X / (n − 1) = 5.
The variance of the sample is: ∑(x − mean of the sample) / (n − 1) = 1.5.
A portfolio begins the year with a value of $100,000 and ends the year with a value of $95,000. The manager's performance is measured against an index that declined by 7% on a total return basis during the year. The tracking error of this portfolio is
A) B) C)
Question #37 of 193
Question ID: 413241A) B) C)
Question #38 of 193
Question ID: 413248A) B) C)
Question #39 of 193
Question ID: 413196A) B) C)
Question #40 of 193
Question ID: 413204closest to: −5%. −2%. 2%.
Which of the following statements about sampling errors is least accurate?
Sampling errors are errors due to the wrong sample being selected from the population. Sampling error is the error made in estimating the population mean based on a sample mean. Sampling error is the difference between a sample statistic and its corresponding population parameter.
An analyst is asked to calculate standard deviation using monthly returns over the last five years. These data are best described as:
time series data. cross-sectional data. systematic sampling data.
If a stock's return is normally distributed with a mean of 16% and a standard deviation of 50%, what is the probability of a negative return in a given year?
0.3745. 0.5000. 0.0001.
A) B) C)
Question #41 of 193
Question ID: 413207A) B) C)
Question #42 of 193
Question ID: 413314A) B) C)
Question #43 of 193
Question ID: 413260A) B) C)
symmetrical distribution with a mean equal to its median. distribution that exhibits zero skewness and no excess kurtosis. normal distribution with a mean of zero and a standard deviation of one.
The mean and standard deviation of returns for three portfolios are listed below in percentage terms.
Portfolio X: Mean 5%, standard deviation 3%. Portfolio Y: Mean 14%, standard deviation 20%. Portfolio Z: Mean 19%, standard deviation 28%.
Using Roy's safety-first criteria and a threshold of 4%, select the optimal portfolio.
Portfolio X. Portfolio Y. Portfolio Z.
A study reports that from 2002 to 2004 the average return on growth stocks was twice as large as that of value stocks. These results most likely reflect:
survivorship bias. look-ahead bias. time-period bias.
Joseph Lu calculated the average return on equity for a sample of 64 companies. The sample average is 0.14 and the sample standard deviation is 0.16. The standard error of the mean is closest to:
Question #44 of 193
Question ID: 413300A) B) C)
Question #45 of 193
Question ID: 413295A) B) C)
Question #46 of 193
Question ID: 413281A) B) C)
Question #47 of 193
Question ID: 413133A) B)
C)
A local high school basketball team had 18 home games this season and averaged 58 points per game. If we assume that the number of points made in home games is normally distributed, which of the following is most likely the range of points for a confidence interval of 90%?
26 to 80. 24 to 78. 34 to 82.
A traffic engineer is trying to measure the effects of carpool-only lanes on the expressway. Based on a sample of 1,000 cars at rush hour, he finds that the mean number of occupants per car is 2.5, with a standard deviation of 0.4. Assuming that the population is normally distributed, what is the confidence interval at the 5% significance level for the number of occupants per car?
2.475 to 2.525. 2.288 to 2.712. 2.455 to 2.555.
When is the t-distribution the appropriate distribution to use? The t-distribution is the appropriate distribution to use when constructing confidence intervals based on:
small samples from populations with known variance that are at least approximately normal. small samples from populations with unknown variance that are at least approximately normal. large samples from populations with known variance that are nonnormal.
Which of the following statements about probability distributions is most accurate?
A discrete uniform random variable has varying probabilities for each outcome that total to one.
A binomial distribution counts the number of successes that occur in a fixed number of independent trials that have mutually exclusive (i.e. yes or no) outcomes.
Question #48 of 193
Question ID: 413253A) B) C)
Question #49 of 193
Question ID: 413140A) B) C)
Question #50 of 193
Question ID: 413322A)
B)
C)
Question #51 of 193
Question ID: 434214According to the Central Limit Theorem, the distribution of the sample means is approximately normal if: the underlying population is normal.
the standard deviation of the population is known. the sample size n > 30.
Which of the following is least likely a probability distribution?
Zeta Corp.: P(dividend increases) = 0.60, P(dividend decreases) = 0.30. Roll an irregular die: p(1) = p(2) = p(3) = p(4) = 0.2 and p(5) = p(6) = 0.1. Flip a coin: P(H) = P(T) = 0.5.
When sampling from a population, the most appropriate sample size:
involves a trade-off between the cost of increasing the sample size and the value of increasing the precision of the estimates.
minimizes the sampling error and the standard deviation of the sample statistic around its population value.
is at least 30.
Student's t-Distribution
Level of Significance for One-Tailed Test df 0.100 0.050 0.025 0.01 0.005 0.0005
A) B) C)
Question #52 of 193
Question ID: 413229A) B) C)
Question #53 of 193
Question ID: 413199A) B) C)
Question #54 of 193
Question ID: 41331127 1.314 1.703 2.052 2.473 2.771 3.690
Books Fast, Inc., prides itself on shipping customer orders quickly. Books Fast sampled 27 of its customers within a 200-mile radius and found a mean delivery time of 76 hours, with a sample standard deviation of 6 hours. Based on this sample and assuming a normal distribution of delivery times, what is the confidence interval for the mean delivery time at 5% significance?
65.75 to 86.25 hours. 73.63 to 78.37 hours. 68.50 to 83.50 hours.
A stock increased in value last year. Which will be greater, its continuously compounded or its holding period return?
Neither, they will be equal. Its holding period return.
Its continuously compounded return.
A grant writer for a local school district is trying to justify an application for funding an after-school program for low-income families. Census information for the school district shows an average household income of $26,200 with a standard deviation of $8,960. Assuming that the household income is normally distributed, what is the percentage of households in the school district with incomes of less than $12,000?
15.87%. 5.71%. 9.92%.
Sunil Hameed is a reporter with the weekly periodical The Fun Finance Times. Today, he is scheduled to interview a researcher who claims to have developed a successful technical trading strategy based on trading on the CEO's birthday (sample was taken from the Fortune 500). After the interview, Hameed summarizes his notes (partial transcript as follows). The researcher:
was defensive about the lack of economic theory consistent with his results.
used the same database of data for all his tests and has not tested the trading rule on out-of-sample data.
excluded stocks for which he could not determine the CEO's birthday.
A) B) C)
Question #55 of 193
Question ID: 434209A) B) C)
Question #56 of 193
Question ID: 413139A) B)
C)
Question #57 of 193
Question ID: 413263A) B) C)
Question #58 of 193
Question ID: 434207Select the choice that best completes the following: Hameed concludes that the research is flawed because the data and process are biased by:
data mining, time-period bias, and look-ahead bias. data mining, sample selection bias, and time-period bias. sample selection bias and time-period bias.
A stated interest rate of 9% compounded continuously results in an effective annual rate closest to:
9.67%. 9.42%. 9.20%.
Which of the following statements about probability distributions is least accurate?
The skewness of a normal distribution is zero.
A discrete random variable is a variable that can assume only certain clearly separated values resulting from a count of some set of items.
A binomial probability distribution is an example of a continuous probability distribution.
Melissa Cyprus, CFA, is conducting an analysis of inventory management practices in the retail industry. She assumes the population cross-sectional standard deviation of inventory turnover ratios is 20. How large a random sample should she gather in order to ensure a standard error of the sample mean of 4?
A) B)
C)
Question #59 of 193
Question ID: 413195A) B) C)
Question #60 of 193
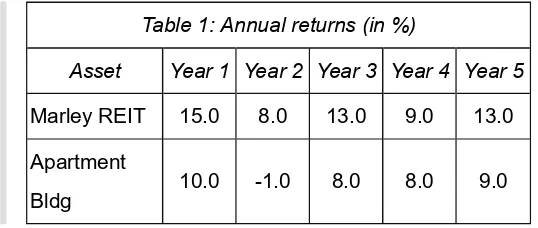
Question ID: 413191Claude Bellow, CFA, is an analyst with a real-estate focused investment firm. Today, one of the partners e-mails Bellow the following table and requests that he look into the reward-to-variability ratios of two asset classes. The table below gives five years of annual returns for Marley REIT (real estate investment trust) and a large urban apartment building. Marley REIT invests in commercial properties. The risk-free rate is 5.0% and the firm's threshold rate for this type is investment is 5.7%. (Note: For this question, calculate the mean returns using the arithmetic mean.)
Table 1: Annual returns (in %)
Asset
Year 1 Year 2 Year 3 Year 4 Year 5
Marley REIT
15.0
8.0
13.0
9.0
13.0
Apartment
Bldg
10.0
-1.0
8.0
8.0
9.0
One of the office assistants begins to "run some numbers," but is then called away to an important meeting. So far, the assistant has calculated the standard deviation of the apartment building returns at 3.97% and the standard deviation of the REIT returns at 2.65%. (He assumed that the returns given represent the entire population of returns.) Now, Bellow must finish the work.
Bellow should conclude that the:
REIT has a higher excess return per unit of risk than the apartment building has per unit of risk. partner is asking Bellow to select the investment with the minimal probability that the return falls below 5.70%.
safety-first ratio for the REIT is 2.49.
The average amount of snow that falls during January in Frostbite Falls is normally distributed with a mean of 35 inches and a standard deviation of 5 inches. The probability that the snowfall amount in January of next year will be between 40 inches and 26.75 inches is closest to:
87%. 79%. 68%.
A) B) C)
Question #61 of 193
Question ID: 413181A) B) C)
Question #62 of 193
Question ID: 413168A) B) C)
Question #63 of 193
Question ID: 413268A) B) C)
Question #64 of 193
Question ID: 41326766%. 95%. 99%.
A multivariate normal distribution that includes three random variables can be completely described by the means and variances of each of the random variables and the:
conditional probabilities among the three random variables. correlation coefficient of the three random variables. correlations between each pair of random variables.
Tracking error for a portfolio is best described as the:
standard deviation of differences between an index return and portfolio return. portfolio return minus a benchmark return.
sample mean minus population mean.
A traffic engineer is trying to measure the effects of carpool-only lanes on the expressway. Based on a sample of 100 cars at rush hour, he finds that the mean number of occupants per car is 2.5, and the sample standard deviation is 0.4. What is the standard error of the sample mean?
1.00. 0.04. 5.68.
A) B) C)
Question #65 of 193
Question ID: 413156A) B) C)
Question #66 of 193
Question ID: 413231A) B) C)
Question #67 of 193
Question ID: 413135A) B) C)
Question #68 of 193
Question ID: 4841671.28. 3.20. 0.64.
For a certain class of junk bonds, the probability of default in a given year is 0.2. Whether one bond defaults is independent of whether another bond defaults. For a portfolio of five of these junk bonds, what is the probability that zero or one bond of the five defaults in the year ahead?
0.4096. 0.7373. 0.0819.
Monte Carlo simulation is necessary to:
compute continuously compounded returns. reduce sampling error.
approximate solutions to complex problems.
The number of ships in the harbor is an example of what kind of variable?
Continuous. Discrete. Indiscrete.
A) B) C)
Question #69 of 193
Question ID: 413216A) B) C)
Question #70 of 193
Question ID: 413282A)
B) C)
Question #71 of 193
Question ID: 413225A) B) C)
Question #72 of 193
Question ID: 434208A)
1.90 to 4.10. 2.61 to 3.39. 0.85 to 5.15.
If random variable Y follows a lognormal distribution then the natural log of Y must be: normally distributed.
lognormally distributed. denoted as e .
Which one of the following statements about the t-distribution is most accurate?
The t-distribution approaches the standard normal distribution as the number of degrees of freedom becomes large.
Compared to the normal distribution, the t-distribution has less probability in the tails.
The t-distribution is the only appropriate distribution to use when constructing confidence intervals based on large samples.
If a stock decreases from $90 to $80, the continuously compounded rate of return for the period is:
-0.1250. -0.1178. -0.1000.
A stock that pays no dividend is currently priced at 42.00. One year ago the stock was 44.23. The continuously compounded rate of return is closest to:
−5.17%.
B) C)
Question #73 of 193
Question ID: 413165A) B) C)
Question #74 of 193
Question ID: 413313A) B) C)
Question #75 of 193
Question ID: 413134A) B) C)
Question #76 of 193
Question ID: 413187A)
+5.17%. −5.04%.
A stock priced at $10 has a 60% probability of moving up and a 40% probability of moving down. If it moves up, it increases by a factor of 1.06. If it moves down, it decreases by a factor of 1/1.06. What is the expected stock price after two successive periods?
$11.24. $10.27. $10.03.
An analyst has compiled stock returns for the first 10 days of the year for a sample of firms and estimated the correlation between these returns and changes in book value for these firms over the just ended year. What objection could be raised to such a correlation being used as a trading strategy?
The study suffers from look-ahead bias.
Use of year-end values causes a time-period bias. Use of year-end values causes a sample selection bias.
Which of the following is a discrete random variable?
The realized return on a corporate bond.
The amount of time between two successive stock trades. The number of advancing stocks in the DJIA in a day.
A portfolio manager is looking at an investment that has an expected annual return of 10% with a standard deviation of annual returns of 5%. Assuming the returns are approximately normally distributed, the probability that the return will exceed 20% in any given year is closest to:
B) C)
Question #77 of 193
Question ID: 413309A) B) C)
Question #78 of 193
Question ID: 413221A) B) C)
Question #79 of 193
Question ID: 413276A)
B)
C)
Question #80 of 193
Question ID: 4132232.28%. 4.56%.
Which of the following is the best method to avoid data mining bias when testing a profitable trading strategy?
Test the strategy on a different data set than the one used to develop the rules. Increase the sample size to at least 30 observations per year.
Use a sample free of survivorship bias.
Compared to a discretely compounded rate of return, continuous compounding will most likely result in a rate of return that is: lower.
the same. higher.
Which of the following statements about sampling and estimation is most accurate?
The standard error of the sample means when the standard deviation of the population is known equals σ / √n, where σ = sample standard deviation adjusted by n − 1.
The standard error of the sample means when the standard deviation of the population is unknown equals s / √n, where s = sample standard deviation.
The probability that a parameter lies within a range of estimated values is given by α.
A) B) C)
Question #81 of 193
Question ID: 710143A) B) C)
Question #82 of 193
Question ID: 413182A) B) C)
Question #83 of 193
Question ID: 413205A) B) C)
Question #84 of 193
Question ID: 413152-5.7%. -6.7%. -6.3%.
A stock price decreases in one period and then increases by an equal amount in the next period. The investor calculates a holding period return for each period and calculates their arithmetic mean. The investor also calculates the continuously compounded rate of return for each period and calculates the arithmetic mean of these. Which of the arithmetic means will be greater?
The mean of the holding period returns.
The mean of the continuously compounded returns. Neither, because both will equal zero.
In a multivariate normal distribution, a correlation tells the:
overall relationship between all the variables.
strength of the linear relationship between two of the variables. relationship between the means and variances of the variables.
The annual rainfall amount in Yucutat, Alaska, is normally distributed with a mean of 150 inches and a standard deviation of 20 inches. The 90% confidence interval for the annual rainfall in Yucutat is closest to:
137 to 163 inches. 110 to 190 inches. 117 to 183 inches.
A) B) C)
Question #85 of 193
Question ID: 413236A) B) C)
Question #86 of 193
Question ID: 413170A) B) C)
Question #87 of 193
Question ID: 413162x F(x)
5 0.14
10 0.25
15 0.86
20 1.00
The probability of an outcome less than or equal to 10 is:
14%. 25%. 39%.
From the entire population of McDonald's franchises, an analyst constructs a sample of the monthly sales volume for 20 randomly selected franchises. She calculates the mean sales volume for those 20 franchises to be $400,000. The sampling distribution of the mean is the probability distribution of the:
mean monthly sales volume estimates from all possible samples of 20 observations. mean monthly sales volume estimates from all possible samples.
monthly sales volume for all McDonald's franchises.
A random variable follows a continuous uniform distribution over 27 to 89. What is the probability of an outcome between 34 and 38?
0.0546. 0.0645. 0.0719.
A) B) C)
Question #88 of 193
Question ID: 413155A) B) C)
Question #89 of 193
Question ID: 413269A) B) C)
Question #90 of 193
Question ID: 413153A) B) C)
Question #91 of 193
Question ID: 5291500.350. 0.112. 0.417.
Possible outcomes for a discrete uniform distribution are the integers 2 to 9 inclusive. What is the probability of an outcome less than 5?
62.5%. 50.0%. 37.5%.
From a population of 5,000 observations, a sample of n = 100 is selected. Calculate the standard error of the sample mean if the population standard deviation is 50.
50.00. 5.00. 4.48.
The number of days a particular stock increases in a given five-day period is uniformly distributed between zero and five inclusive. In a given five-day trading week, what is the probability that the stock will increase exactly three days?
0.167. 0.600. 0.333.
A) B) C)
Question #92 of 193
Question ID: 434218A) B) C)
Question #93 of 193
Question ID: 413151A) B)
z 0.0 0.01 0.02 0.03 0.04 0.05 0.06 0.07 0.08 0.09
0.6 0.7257 0.7291 0.7324 0.7357 0.7389 0.7422 0.7454 0.7486 0.7517 0.7549
0.7 0.7580 0.7611 0.7642 0.7673 0.7704 0.7734 0.7764 0.7794 0.7823 0.7852
0.8 0.7881 0.7910 0.7939 0.7967 0.7995 0.8023 0.8051 0.8078 0.8106 0.8133
0.9 0.8159 0.8186 0.8212 0.8238 0.8264 0.8289 0.8315 0.8340 0.8365 0.8389
John Cupp, CFA, has several hundred clients. The values of the portfolios Cupp manages are approximately normally distributed with a mean of $800,000 and a standard deviation of $250,000. The probability of a randomly selected portfolio being in excess of $1,000,000 is:
0.2119. 0.3773. 0.1057.
Student's t-Distribution
Level of Significance for One-Tailed Test df 0.100 0.050 0.025 0.01 0.005 0.0005
Level of Significance for Two-Tailed Test df 0.20 0.10 0.05 0.02 0.01 0.001 30 1.310 1.697 2.042 2.457 2.750 3.646 40 1.303 1.684 2.021 2.423 2.704 3.551 60 1.296 1.671 2.000 2.390 2.660 3.460 120 1.289 1.658 1.980 2.358 2.617 3.373
From a sample of 41 orders for an on-line bookseller, the average order size is $75, and the sample standard deviation is $18. Assume the distribution of orders is normal. For which interval can one be exactly 90% confident that the population mean is contained in that interval?
$74.24 to $75.76. $70.27 to $79.73. $71.29 to 78.71.
Which of the following qualifies as a cumulative distribution function?
C)
Question #94 of 193
Question ID: 413149A) B) C)
Question #95 of 193
Question ID: 413194A) B) C)
Question #96 of 193
Question ID: 452011F(1) = 0, F(2) = 0.5, F(3) = 0.5, F(4) = 0.
The cumulative distribution function for a random variable X is given in the following table:
x F(x) 5 0.15 10 0.30 15 0.45 20 0.75 25 1.00
The probability of an outcome greater than 15 is:
75%. 55%. 45%.
A group of investors wants to be sure to always earn at least a 5% rate of return on their investments. They are looking at an investment that has a normally distributed probability distribution with an expected rate of return of 10% and a standard deviation of 5%. The probability of meeting or exceeding the investors' desired return in any given year is closest to:
98%. 84%. 34%.
Standard Normal Distribution P(Z ≤ z) = N(z) for z ≥ 0
z 0.00 0.01 0.02 0.03 0.04 0.05 0.06 0.07 0.08 0.09
A) B) C)
Question #97 of 193
Question ID: 413256A) B) C)
Question #98 of 193
Question ID: 710145A) B) C)
Question #99 of 193
Question ID: 4131610.7 0.7580 0.7611 0.7642 0.7673 0.7704 0.7734 0.7764 0.7794 0.7823 0.7852 0.8 0.7881 0.7910 0.7939 0.7967 0.7995 0.8023 0.8051 0.8078 0.8106 0.8133 0.9 0.8159 0.8186 0.8212 0.8238 0.8264 0.8289 0.8315 0.8340 0.8365 0.8389 1.0 0.8413 0.8438 0.8461 0.8485 0.8508 0.8531 0.8554 0.8577 0.8599 0.8621 1.1 0.8643 0.8665 0.8686 0.8708 0.8729 0.8749 0.8770 0.8790 0.8810 0.8830 1.2 0.8849 0.8869 0.8888 0.8907 0.8925 0.8944 0.8962 0.8980 0.8997 0.9015 1.3 0.9032 0.9049 0.9066 0.9082 0.9099 0.9115 0.9131 0.9147 0.9162 0.9177 1.4 0.9192 0.9207 0.9222 0.9236 0.9251 0.9265 0.9279 0.9292 0.9306 0.9319
Given a normally distributed population with a mean income of $40,000 and standard deviation of $7,500, what percentage of the population makes between $30,000 and $35,000?
15.96. 41.67. 13.34.
Suppose the mean debt/equity ratio of the population of all banks in the United States is 20 and the population variance is 25. A banking industry analyst uses a computer program to select a random sample of 50 banks from this population and compute the sample mean. The program repeats this exercise 1000 times and computes the sample mean each time. According to the central limit theorem, the sampling distribution of the 1000 sample means will be approximately normal if the population of bank
debt/equity ratios has:
a normal distribution, because the sample is random.
a Student's t-distribution, because the sample size is greater than 30. any probability distribution.
Which of the following statements regarding confidence intervals is most accurate? The lower the significance level, the wider the confidence interval.
The lower the degree of confidence, the wider the confidence interval. The higher the significance level, the wider the confidence interval.
A) B) C)
Question #100 of 193
Question ID: 413243A) B) C)
Question #101 of 193
Question ID: 413169A) B) C)
Question #102 of 193
Question ID: 413154A) B) C)
Question #103 of 193
Question ID: 413175A)
Sampling error can be defined as:
the standard deviation of a sampling distribution of the sample means. rejecting the null hypothesis when it is true.
the difference between a sample statistic and its corresponding population parameter.
If X follows a continuous uniform distribution over the interval 1 < X < 26, the probability that X is between 5 and 15 is closest to: 40%.
60%. 10%.
Which of the following random variables would be most likely to follow a discrete uniform distribution?
The number of heads on the flip of two coins.
The outcome of a roll of a standard, six-sided die where X equals the number facing up on the die. The outcome of the roll of two standard, six-sided dice where X is the sum of the numbers facing up.
In a normal distribution, the:
Question #104 of 193
Question ID: 413217A) B) C)
Question #105 of 193
Question ID: 413174A) B) C)
Question #106 of 193
Question ID: 413178A) B) C)
Question #107 of 193
Question ID: 413215A) B) C)
Question #108 of 193
Question ID: 413306If a random variable x is lognormally distributed then ln x is: normally distributed.
abnormally distributed. defined as e .
A normal distribution can be completely described by its:
mean and mode. mean and variance. skewness and kurtosis.
If X has a normal distribution with μ = 100 and σ = 5, then there is approximately a 90% probability that:
P(90.2 < X < 109.8). P(91.8 < X < 108.3). P(93.4 < X < 106.7).
Given Y is lognormally distributed, then ln Y is: a lognormal distribution.
normally distributed. the antilog of Y.
The confidence interval for a parameter is calculated as:
A) B) C)
Question #109 of 193
Question ID: 498734A) B) C)
Question #110 of 193
Question ID: 550538A) B) C)
Question #111 of 193
Question ID: 413230A) B) C)
Question #112 of 193
Question ID: 413237Point Estimate × Reliability Factor ± Standard Error. Point Estimate ± Standard Error.
Point Estimate ± Reliability Factor × Standard Error.
Which of the following random variables assigns an equal probability to each possible outcome?
Binomial random variable. Discrete uniform random variable. Bernoulli random variable.
The average return on small stocks over the period 1926-1997 was 17.7%, and the standard deviation of the sample was 33.9%. Assuming returns are normally distributed, the 95% confidence interval for the return on small stocks in any given year is:
16.8% to 18.6%. -48.7% to 84.1%. -16.2% to 51.6%.
Which of the following statements describes a limitation of Monte Carlo simulation?
Variables are assumed to be normally distributed but may actually have non-normal distributions. Simulations do not consider possible input values that lie outside historical experience.
Outcomes of a simulation can only be as accurate as the inputs to the model.
A) B) C)
Question #113 of 193
Question ID: 413258A) B) C)
Question #114 of 193
Question ID: 413286A) B) C)
Question #115 of 193
Question ID: 413298A) B) C)
Question #116 of 193
Question ID: 413254each element of the population has the same probability of being selected as part of the sample. each element of the population is also an element of the sample.
the sample size is random.
Frank Grinder is trying to introduce sampling into the quality control program of an old-line manufacturer. Currently, each item is individually inspected to make sure it meets size tolerances. For all items manufactured during August, the standard deviation of size was 0.02 centimeters. If Grinder takes a sample of 30 items and finds a standard deviation of size of 0.019 centimeters, what is the standard error of the sample mean?
0.00600. 0.00200. 0.00365.
A sample of 25 junior financial analysts gives a mean salary (in thousands) of 60. Assume the population variance is known to be 100. A 90% confidence interval for the mean starting salary of junior financial analysts is most accurately constructed as:
60 + 1.645(4). 60 + 1.645(10). 60 + 1.645(2).
A sample of 100 individual investors has a mean portfolio value of $28,000 with a standard deviation of $4,250. The 95% confidence interval for the population mean is closest to:
$27,575 to $28,425. $19,500 to $28,333. $27,159 to $28,842.
A) B) C)
Question #117 of 193
Question ID: 413247A) B) C)
Question #118 of 193
Question ID: 434217A) B) C)
Question #119 of 193
Question ID: 627885approaches a normal distribution. approaches the mean.
becomes larger.
Thomas Merton, a car industry analyst, wants to investigate a relationship between the types of ads used in advertising campaigns and sales to customers in certain age groups. In order to make sure he includes manufacturers of all sizes, Merton divides the industry into four size groups and draws random samples from each group. What sampling method is Merton using?
Simple random sampling. Cross-sectional sampling. Stratified random sampling.
Student's t-Distribution
Level of Significance for One-Tailed Test df 0.100 0.050 0.025 0.01 0.005 0.0005
Level of Significance for Two-Tailed Test df 0.20 0.10 0.05 0.02 0.01 0.001 40 1.303 1.684 2.021 2.423 2.704 3.551 60 1.296 1.671 2.000 2.390 2.660 3.460 120 1.289 1.658 1.980 2.358 2.617 3.373
From a sample of 41 monthly observations of the S&P Mid-Cap index, the mean monthly return is 1% and the sample variance is 36. For which of the following intervals can one be closest to 95% confident that the population mean is contained in that interval?
1.0% ± 1.6%. 1.0% ± 1.9%. 1.0% ± 6.0%.
Cumulative z-table:
A) B) C)
Question #120 of 193
Question ID: 413189A) B) C)
Question #121 of 193
Question ID: 413136A) B) C)
Question #122 of 193
Question ID: 413249A) B) C)
1.6 0.9452 0.9463 0.9474 0.9484
1.7 0.9564 0.9564 0.9573 0.9582
1.8 0.9641 0.9649 0.9656 0.9664
Monthly sales of hot water heaters are approximately normally distributed with a mean of 21 and a standard deviation of 5. What is the probabilility of selling 12 hot water heaters or less next month?
96.41%. 1.80%. 3.59%.
An investment has a mean return of 15% and a standard deviation of returns equal to 10%. If returns are normally distributed, which of the following statements is least accurate? The probability of obtaining a return:
greater than 35% is 0.025. between 5% and 25% is 0.68. greater than 25% is 0.32.
A dealer in a casino has rolled a five on a single die three times in a row. What is the probability of her rolling another five on the next roll, assuming it is a fair die?
0.200. 0.167. 0.001.
The sample of per square foot sales for 100 U.S. retailers in December 2004 is an example of:
Question #123 of 193
Question ID: 413192A) B) C)
Question #124 of 193
Question ID: 413183A) B) C)
Question #125 of 193
Question ID: 434215A) B) C)
Question #126 of 193
Question ID: 413180A stock portfolio's returns are normally distributed. It has had a mean annual return of 25% with a standard deviation of 40%. The probability of a return between -41% and 91% is closest to:
95%. 65%. 90%.
A multivariate distribution is best defined as describing the behavior of:
a random variable with more than two possible outcomes. two or more independent random variables.
two or more dependent random variables.
Student's t-Distribution
Level of Significance for One-Tailed Test df 0.100 0.050 0.025 0.01 0.005 0.0005
Level of Significance for Two-Tailed Test df 0.20 0.10 0.05 0.02 0.01 0.001 18 1.330 1.734 2.101 2.552 2.878 3.922 19 1.328 1.729 2.093 2.539 2.861 3.883 20 1.325 1.725 2.086 2.528 2.845 3.850
A traffic engineer is trying to measure the effects of carpool-only lanes on the expressway. Based on a sample of 20 cars at rush hour, he finds that the mean number of occupants per car is 2.5, with a standard deviation of 0.4. If the population is normally distributed, what is the confidence interval at the 5% significance level for the number of occupants per car?
A) B) C)
Question #127 of 193
Question ID: 413206A) B) C)
Question #128 of 193
Question ID: 442251A) B) C)
Question #129 of 193
Question ID: 413264Multivariate distributions can describe:
continuous random variables only. discrete random variables only.
either discrete or continuous random variables.
A food retailer has determined that the mean household income of her customers is $47,500 with a standard deviation of $12,500. She is trying to justify carrying a line of luxury food items that would appeal to households with incomes greater than $60,000. Based on her information and assuming that household incomes are normally distributed, what percentage of households in her customer base has incomes of $60,000 or more?
5.00%. 2.50%. 15.87%.
Cumulative Z-Table
z 0.04 0.05
1.8 0.9671 0.9678 1.9 0.9738 0.9744 2.0 0.9793 0.9798 2.1 0.9838 0.9842
The owner of a bowling alley determined that the average weight for a bowling ball is 12 pounds with a standard deviation of 1.5 pounds. A ball denoted "heavy" should be one of the top 2% based on weight. Assuming the weights of bowling balls are normally distributed, at what weight (in pounds) should the "heavy" designation be used?
14.22 pounds. 14.00 pounds. 15.08 pounds.
A) B) C)
Question #130 of 193
Question ID: 413141A) B) C)
Question #131 of 193
Question ID: 413273A) B) C)
Question #132 of 193
Question ID: 413222A) B) C)
0.8. 0.4. 2.0.
Which of the following statements about the normal probability distribution is most accurate?
Five percent of the normal curve probability is more than two standard deviations from the mean. The normal curve is asymmetrical about its mean.
Sixty-eight percent of the area under the normal curve falls between the mean and 1 standard deviation above the mean.
The range of possible values in which an actual population parameter may be observed at a given level of probability is known as a:
significance level. confidence interval. degree of confidence.
Mei Tekei just celebrated her 22nd birthday. When she is 27, she will receive a $100,000 inheritance. Tekei needs funds for the down payment on a co-op in Manhattan and has found a bank that will give her the present value of her inheritance amount, assuming an 8.0% stated annual interest rate with continuous compounding. Will the proceeds from the bank be sufficient to cover her down payment of $65,000?
Question #133 of 193
Question ID: 413255A) B) C)
Question #134 of 193
Question ID: 710144A)
B)
C)
Question #135 of 193
Question ID: 413289A) B) C)
Question #136 of 193
Question ID: 413283A) B) C)
Which of the following is NOT a prediction of the central limit theorem?
The mean of the sampling distribution of the sample means will be equal to the population mean. The standard error of the sample mean will increase as the sample size increases.
The variance of the sampling distribution of sample means will approach the population variance divided by the sample size.
Which of the following statements about a confidence interval for a population mean is most accurate?
For a sample size of 30, using a t-statistic will result in a wider confidence interval for a population mean than using a z-statistic.
If the population variance is unknown, a large sample size is required in order to estimate a confidence interval for the population mean.
When a z-statistic is acceptable, a 95% confidence interval for a population mean is the sample mean plus-or-minus 1.96 times the sample standard deviation.
Construct a 90% confidence interval for the mean starting salaries of the CFA charterholders if a sample of 100 recent CFA charterholders gives a mean of 50. Assume that the population variance is 900. All measurements are in $1,000.
50 ± 1.645(30). 50 ± 1.645(900). 50 ± 1.645(3).
Which statement best describes the properties of Student's t-distribution? The t-distribution is: symmetrical, and defined by a single parameter.
Question #137 of 193
Question ID: 413265A) B) C)
Question #138 of 193
Question ID: 413173A) B) C)
Question #139 of 193
Question ID: 413177A) B) C)
Question #140 of 193
Question ID: 413240A) B) C)
The following data are available on a sample of advertising budgets of 81 U.S. manufacturing companies: The mean budget is $10 million. The sample variance is 36 million. The standard error of the sample mean is:
$1,111. $400. $667.
A discount brokerage firm states that the time between a customer order for a trade and the execution of the order is uniformly distributed between three minutes and fifteen minutes. If a customer orders a trade at 11:54 A.M., what is the probability that the order is executed after noon?
0.500. 0.750. 0.250.
Which of the following statements about a normal distribution is least accurate?
Approximately 34% of the observations fall within plus or minus one standard deviation of the mean. The distribution is completely described by its mean and variance.
Kurtosis is equal to 3.
Sampling error is the:
difference between the point estimate of the mean and the mean of the sampling distribution. estimation error created by using a non-random sample.
Question #141 of 193
Question ID: 413138A) B) C)
Question #142 of 193
Question ID: 413193A) B) C)
Question #143 of 193
Question ID: 413280A) B) C)
Question #144 of 193
Question ID: 413305A) B)
C)
Which of the following statements about probability distributions is least accurate?
A probability distribution includes a listing of all the possible outcomes of an experiment. A probability distribution is, by definition, normally distributed.
In a binomial distribution each observation has only two possible outcomes that are mutually exclusive.
A stock portfolio has had a historical average annual return of 12% and a standard deviation of 20%. The returns are normally distributed. The range -27.2 to 51.2% describes a:
99% confidence interval. 68% confidence interval. 95% confidence interval.
Which one of the following distributions is described entirely by the degrees of freedom?
Normal distribution. Student's t-distribution. Lognormal distribution.
In which one of the following cases is the t-statistic the appropriate one to use in the construction of a confidence interval for the population mean?
The distribution is normal, the population variance is known, and the sample size is less than 30. The distribution is nonnormal, the population variance is unknown, and the sample size is at least 30.
Question #145 of 193
Question ID: 413211A) B) C)
Question #146 of 193
Question ID: 413262A) B) C)
Question #147 of 193
Question ID: 413250A) B) C)
Question #148 of 193
Question ID: 413200Which of the following portfolios provides the optimal "safety first" return if the minimum acceptable return is 9%?
Portfolio Expected Return (%) Standard Deviation (%)
1
13
5
2
11
3
3
9
2
1. 2. 3.
From a population with a known standard deviation of 15, a sample of 25 observations is taken. Calculate the standard error of the sample mean.
1.67. 0.60. 3.00.
Monthly Gross Domestic Product (GDP) figures from 1990-2000 are an example of:
cross-sectional data. time-series data. systematic data.
A) B) C)
Question #149 of 193
Question ID: 413143A) B) C)
Question #150 of 193
Question ID: 413188A) B) C)
Question #151 of 193
Question ID: 413307A) B) C)
Question #152 of 193
Question ID: 413239A) B)
mean, variance and skewness. mean and the standard deviation. natural logarithm of X.
Which of the following is least likely to be an example of a discrete random variable? The rate of return on a real estate investment.
The number of days of sunshine in the month of May 2006 in a particular city. Quoted stock prices on the NASDAQ.
A client will move his investment account unless the portfolio manager earns at least a 10% rate of return on his account. The rate of return for the portfolio that the portfolio manager has chosen has a normal probability distribution with an expected return of 19% and a standard deviation of 4.5%. What is the probability that the portfolio manager will keep this account?
0.977. 0.750. 0.950.
Which of the following would result in a wider confidence interval? A:
greater level of significance. higher alpha level.
higher degree of confidence.
The sampling distribution of a statistic is:
C)
Question #153 of 193
Question ID: 413244A) B) C)
Question #154 of 193
Question ID: 498735A) B) C)
Question #155 of 193
Question ID: 413279A) B) C)
Question #156 of 193
Question ID: 413233A) B)
the probability distribution consisting of all possible sample statistics computed from samples of the same size drawn from the same population.
Which of the following is least likely a step in stratified random sampling?
The population is divided into strata based on some classification scheme. The sub-samples are pooled to create the complete sample.
The size of each sub-sample is selected to be the same across strata.
Bill Phillips is developing a Monte Carlo simulation to value a complex and thinly traded security. Phillips wants to model one input variable to have negative skewness and a second input variable to have positive excess kurtosis. In a Monte Carlo simulation, Phillips can appropriately use:
only one of these variables. both of these variables. neither of these variables.
With 60 observations, what is the appropriate number of degrees of freedom to use when carrying out a statistical test on the mean of a population?
59. 61. 60.
Many analysts prefer to use Monte Carlo simulation rather than historical simulation because:
C)
Question #157 of 193
Question ID: 413209A) B) C)
Question #158 of 193
Question ID: 529151A) B) C)
Question #159 of 193
Question ID: 434213A) B) C)
Question #160 of 193
Question ID: 413184past distributions cannot address changes in correlations or events that have not happened before.
If the threshold return is higher than the risk-free rate, what will be the relationship between Roy's safety-first ratio (SF) and Sharpe's ratio?
The SF ratio will be lower. The SF ratio will be higher.
The SF ratio may be higher or lower depending on the standard deviation.
An equity analyst needs to select a representative sample of manufacturing stocks. Starting with the population of all publicly traded manufacturing stocks, she classifies each stock into one of the 20 industry groups that form the Index of Industrial Production for the manufacturing industry. She then selects four stocks from each industry. The sampling method the analyst is using is best characterized as:
stratified random sampling. random sampling.
nonrandom sampling.
A nursery sells trees of different types and heights. Suppose that 75 trees chosen at random are sold for planting at City Hall. These 75 trees average 60 inches in height with a standard deviation of 16 inches.
Using this information, construct a 95% confidence interval for the mean height of all trees in the nursery.
0.8 + 1.96(16). 60 + 1.96(1.85). 60 + 1.96(16).
A) B) C)
Question #161 of 193
Question ID: 413172A) B) C)
Question #162 of 193
Question ID: 413319A) B) C)
Question #163 of 193
Question ID: 413235A) B) C)
Question #164 of 193
Question ID: 41323210 correlations. overall correlation. 45 correlations.
The probability density function of a continuous uniform distribution is best described by a: line segment with a curvilinear slope.
line segment with a 45-degree slope. horizontal line segment.
Studies of performance of a sample of mutual fund managers most likely suffer from: survivorship bias.
look-ahead bias. sample-selection bias.
A drawback of historical simulation is it:
may not accurately reflect possible outcomes.
depends on the accuracy of the random number generator. may not account for very rare events.
A) B) C)
Question #165 of 193
Question ID: 413150A) B) C)
Question #166 of 193
Question ID: 413272A) B)
C)
Question #167 of 193
Question ID: 413321A) B) C)
Question #168 of 193
Question ID: 413163uses randomly selected variables from future distributions. projects variables based on a priori principles.
uses a computer to generate random variables.
A random variable X is continuous and bounded between zero and five, X:(0 ≤ X ≤ 5). The cumulative distribution function (cdf) for X is F(x) = x / 5. Calculate P(2 ≤ X ≤ 4).
0.50. 1.00. 0.40.
The sample mean is an unbiased estimator of the population mean because the:
expected value of the sample mean is equal to the population mean.
sampling distribution of the sample mean has the smallest variance of any other unbiased estimators of the population mean.
sample mean provides a more accurate estimate of the population mean as the sample size increases.
When sampling from a nonnormal distribution with an known variance, which statistic should be used if the sample size is large and if the respective sample size is small?
t-statistic; t-statistic. z-statistic; z-statistic. z-statistic; not available.
A) B) C)
Question #169 of 193
Question ID: 413176A) B) C)
Question #170 of 193
Question ID: 413310A) B) C)
Question #171 of 193
Question ID: 413274A) B) C)
Question #172 of 193
Question ID: 413246a factor of 1.02. If it moves down, it decreases by a factor of 1/1.02. What is the probability that the stock will be $100 after two successive periods?
42%. 21%. 9%.
A normal distribution is completely described by its:
mean, mode, and skewness. median and mode.
variance and mean.
An analyst has reviewed market data for returns from 1980-1990 extensively, searching for patterns in the returns. She has found that when the end of the month falls on a Saturday, there are usually positive returns on the following Thursday. She has
engaged in:
data mining. data snooping. biased selection.
Which of the following characterizes the typical construction of a confidence interval most accurately? Point estimate +/- (Standard error / Reliability factor).
Point estimate +/- (Reliability factor x Standard error). Standard error +/- (Point estimate / Reliability factor).
A) B) C)
Question #173 of 193
Question ID: 413318A) B) C)
Question #174 of 193
Question ID: 413157A) B) C)
Question #175 of 193
Question ID: 452012A) B) C) of:
stratified random sampling. simple random sampling.
systematic cross-sectional sampling.
A scientist working for a pharmaceutical company tries many models using the same data before reporting the one that shows that the given drug has no serious side effects. The scientist is guilty of:
look-ahead bias. sample selection bias. data mining.
Which of the following is NOT an assumption of the binomial distribution?
The trials are independent.
The expected value is a whole number. Random variable X is discrete.
The central limit theorem concerns the sampling distribution of the:
population mean. sample mean.
Question #176 of 193
Question ID: 413144A) B) C)
Question #177 of 193
Question ID: 413275A) B) C)
Question #178 of 193
Question ID: 413201A) B) C)
Question #179 of 193
Question ID: 413219A) B) C)
Assume a discrete distribution for the number of possible sunny days in Provo, Utah during the week of April 20 through April 26. For this discrete distribution, p(x) = 0 when x cannot occur, or p(x) > 0 if it can. Based on this information, what is the probability of it being sunny on 5 days and on 10 days during the week, respectively?
A positive value; zero. Zero; infinite.
A positive value; infinite.
A range of estimated values within which the actual value of a population parameter will lie with a given probability of 1 − α is a(n):
α percent point estimate. α percent confidence interval. (1 − α) percent confidence interval.
Which of the following represents the mean, standard deviation, and variance of a standard normal distribution?
1, 1, 1. 1, 2, 4. 0, 1, 1.
The farthest point on the left side of the lognormal distribution:
can be any negative number. is skewed to the left.
Question #180 of 193
Question ID: 413218A)
B)
C)
Question #181 of 193
Question ID: 413271A)
B) C)
Question #182 of 193
Question ID: 413320A)
B) C)
Question #183 of 193
Question ID: 413290A) B) C)
Which of the following statements regarding the distribution of returns used for asset pricing models is most accurate? Lognormal distribution returns are used for asset pricing models because they will not result in an
asset return of less than -100%.
Normal distribution returns are used for asset pricing models because they will only allow the asset price to fall to zero.
Lognormal distribution returns are used because this will allow for negative returns on the assets.
The sample mean is a consistent estimator of the population mean because the:
sample mean provides a more accurate estimate of the population mean as the sample size increases.
expected value of the sample mean is equal to the population mean.
sampling distribution of the sample mean has the smallest variance of any other unbiased estimators of the population mean.
Which of the following statements about sample statistics is least accurate?
There is no sample statistic for non-normal distributions with unknown variance for either small or large samples.
The z-statistic is used for nonnormal distributions with known variance, but only for large samples. The z-statistic is used to test normally distributed data with a known variance, whether testing a large or a small sample.
What is the 95% confidence interval for a population mean with a known population variance of 9, based on a sample of 400 observations with mean of 96?
Question #184 of 193
Question ID: 413148A) B) C)
Question #185 of 193
Question ID: 413266A) B) C)
Question #186 of 193
Question ID: 413213A) B) C)
Question #187 of 193
Question ID: 434216A probability function:
only applies to continuous distributions.
specifies the probability that the random variable takes on a specific value. is often referred to as the "cdf."
A population has a mean of 20,000 and a standard deviation of 1,000. Samples of size n = 2,500 are taken from this population. What is the standard error of the sample mean?
400.00. 20.00. 0.04.
Three portfolios with normally distributed returns are available to an investor who wants to minimize the probability that the portfolio return will be less than 5%. The risk and return characteristics of these portfolios are shown in the following table:
Portfolio Expected return Standard deviation
Epps
6%
4%
Flake
7%
9%
Grant
10%
15%
Based on Roy's safety-first criterion, which portfolio should the investor select?
Epps. Grant. Flake.
A) B) C)
Question #188 of 193
Question ID: 413159A) B) C)
Question #189 of 193
Question ID: 413179A) B) C)
Question #190 of 193
Question ID: 413270A) B)
Level of Significance for One-Tailed Test df 0.100 0.050 0.025 0.01 0.005 0.0005
Level of Significance for Two-Tailed Test df 0.20 0.10 0.05 0.02 0.01 0.001 24 1.318 1.711 2.064 2.492 2.797 3.745 25 1.316 1.708 2.060 2.485 2.787 3.725 26 1.315 1.706 2.056 2.479 2.779 3.707 27 1.314 1.703 2.052 2.473 2.771 3.690
A random sample of 25 Indiana farms had a mean number of cattle per farm of 27 with a sample standard deviation of five. Assuming the population is normally distributed, what would be the 95% confidence interval for the number of cattle per farm?
23 to 31. 25 to 29. 22 to 32.
A casual laborer has a 70% chance of finding work on each day that she reports to the day labor marketplace. What is the probability that she will work three days out of five?
0.6045. 0.3087. 0.3192.
The lower limit of a normal distribution is:
negative infinity. zero.
negative one.
A statistical estimator is unbiased if:
an increase in sample size decreases the standard error.
C)
Question #191 of 193
Question ID: 413292A) B) C)
Question #192 of 193
Question ID: 413277A) B)
C)
Question #193 of 193
Question ID: 434211A) B)
the expected value of the estimator is equal to the population parameter.
A sample size of 25 is selected from a normal population. This sample has a mean of 15 and the population variance is 4.
Using this information, construct a 95% confidence interval for the population mean, m.
15 ± 1.96(0.4). 15 ± 1.96(2). 15 ± 1.96(0.8).
Which of the following statements about sampling and estimation is most accurate? Time-series data are observations over individual units at a point in time.
A confidence interval estimate consists of a range of values that bracket the parameter with a specified level of probability, 1 − β.
A point estimate is a single estimate of an unknown population parameter calculated as a sample mean.
Student's t-Distribution
Level of Significance for One-Tailed Test df 0.100 0.050 0.025 0.01 0.005 0.0005
Level of Significance for Two-Tailed Test df 0.20 0.10 0.05 0.02 0.01 0.001 30 1.310 1.697 2.042 2.457 2.750 3.646 40 1.303 1.684 2.021 2.423 2.704 3.551 60 1.296 1.671 2.000 2.390 2.660 3.460 120 1.289 1.658 1.980 2.358 2.617 3.373
Based on Student's t-distribution, the 95% confidence interval for the population mean based on a sample of 40 interest rates with a sample mean of 4% and a sample standard deviation of 15% is closest to: