✗ A) ✓ B) ✗ C)
Question #3 of 193
Question ID: 434204✗ A) ✓ B) ✗ C)
Question #4 of 193
Question ID: 413257✗ A)
0.546% to 13.454%. -1.584% to 15.584%. 1.584% to 14.584%.
Explanation
The standard error for the mean = s / (n) = 25% / (60) = 3.227%. The critical value from the t-table should be based on 60 − 1 = 59 df. Since the standard tables do not provide the critical value for 59 df the closest available value is for 60 df. This leaves us with an approximate confidence interval. Based on 99% confidence and df = 60, the critical t-value is 2.660. Therefore the 99% confidence interval is approximately: 7% ± 2.660(3.227) or 7% ± 8.584% or -1.584% to 15.584%.
If you use a z-statistic, the confidence interval is 7% ± 2.58(3.227) = -1.326% to 15.326%, which is closest to the correct choice.
References
Question From: Session 3 > Reading 11 > LOS j Related Material:
Key Concepts by LOS
Assume 30% of the CFA candidates have a degree in economics. A random sample of three CFA candidates is selected. What is the probability that none of them has a degree in economics?
0.027. 0.343. 0.900.
Explanation
The probability of 0 successes in 3 trials is: [3! / (0!3!)] (0.3) (0.7) = 0.343
References
Question From: Session 3 > Reading 10 > LOS f Related Material:
Key Concepts by LOS
If the true mean of a population is 16.62, according to the central limit theorem, the mean of the distribution of sample means, for all possible sample sizes n will be:
16.62 / √n.
0.5 0.5
✗ B) ✓ C)
Question #5 of 193
Question ID: 413312✗ A) ✓ B) ✗ C)
Question #6 of 193
Question ID: 413212indeterminate for sample with n < 30. 16.62.
Explanation
According to the central limit theorem, the mean of the distribution of sample means will be equal to the population mean. n > 30 is only required for distributions of sample means to approach normal distribution.
References
Question From: Session 3 > Reading 11 > LOS e
Related Material: Key Concepts by LOS
An article in a trade journal suggests that a strategy of buying the seven stocks in the S&P 500 with the highest earnings-to-price ratio at the end of the calendar year and holding them until March 20 of the following year produces significant trading profits. Upon reading further, you discover that the study is based on data from 1993 to 1997, and the earnings-to-price ratio is
calculated using the stock price on December 31 of each year and the annual reported earnings per share for that year. Which of the following biases is least likely to influence the reported results?
Time-period bias. Survivorship bias. Look-ahead bias.
Explanation
Survivorship bias is not likely to significantly influence the results of this study because the authors looked at the stocks in the S&P 500 at the beginning of the year and measured performance over the following three months. Look-ahead bias could be a problem because earnings-price ratios are calculated and the trading strategy implemented at a time before earnings are actually reported. Finally, the study is conducted over a relatively short time period during the long bull market of the 1990s. This
suggests the results may be time-specific and the result of time-period bias.
References
Question From: Session 3 > Reading 11 > LOS k
Related Material: Key Concepts by LOS
✗ A) ✗ B) ✓ C)
Question #7 of 193
Question ID: 413234✗ A) ✓ B) ✗ C)
Portfolio X: Mean 5%, standard deviation 3%. Portfolio Y: Mean 14%, standard deviation 20%. Portfolio Z: Mean 19%, standard deviation 28%.
Using Roy's safety first criteria and a threshold of 3%, which of these is the optimal portfolio?
Portfolio Z. Portfolio Y. Portfolio X.
Explanation
According to the safety-first criterion, the optimal portfolio is the one that has has the largest value for the SFRatio (mean − threshold) / standard deviation.
For Portfolio X, (5 − 3) / 3 = 0.67. For Portfolio Y, (14 - 3) / 20 = 0.55. For Portfolio Z, (19 - 3) / 28 = 0.57.
References
Question From: Session 3 > Reading 10 > LOS n Related Material:
Key Concepts by LOS
Joan Biggs, CFA, acquires a large database of past returns on a variety of assets. Biggs then draws random samples of sets of returns from the database and analyzes the resulting distributions. Biggs is engaging in:
discrete analysis. historical simulation. Monte Carlo simulation.
Explanation
This is a typical example of historical simulation.
References
Question From: Session 3 > Reading 10 > LOS r Related Material:
Question #8 of 193
Question ID: 413278✓ A) ✗ B) ✗ C)
Question #9 of 193
Question ID: 710142✗ A) ✗ B) ✓ C)
Question #10 of 193
Question ID: 413259Which of the following statements about confidence intervals is least accurate? A confidence interval:
expands as the probability that a point estimate falls within the interval decreases.
has a significance level that is equal to one minus the degree of confidence. is constructed by adding and subtracting a given amount from a point estimate.
Explanation
A confidence interval contracts as the probability that a point estimate falls within the interval decreases.
References
Question From: Session 3 > Reading 11 > LOS h Related Material:
Key Concepts by LOS
Consider a random variable X that follows a continuous uniform distribution: 7 ≤ X ≤ 20. Which of the following statements is least accurate?
F(10) = 0.23.
F(12 ≤ X ≤ 16) = 0.307. F(21) = 0.00.
Explanation
F(21) = 1.00. For a cumulative distribution function, the expression F(x) refers to the probability of an outcome less than or equal to x. In this distribution all the possible outcomes are between 7 and 20. Therefore the probability of an outcome less than or equal to 21 is 100%.
The other choices are true.
F(10) = (10 - 7) / (20 - 7) = 3 / 13 = 0.23
F(12 ≤ X ≤ 16) = F(16) - F(12) = [(16 - 7) / (20 - 7)] − [(12 - 7) / (20 - 7)] = 0.692 − 0.385 = 0.307
References
Question From: Session 3 > Reading 10 > LOS i Related Material:
✗ A) ✓ B) ✗ C)
Question #11 of 193
Question ID: 413293✗ A) ✓ B) ✗ C)
Question #12 of 193
Question ID: 413186✗ A)
Frank Grinder is trying to introduce sampling into the quality control program of an old-line manufacturer. Grinder samples 38 items and finds that the standard deviation in size is 0.019 centimeters. What is the standard error of the sample mean?
0.00204. 0.00308. 0.00615.
Explanation
If we do not know the standard deviation of the population (in this case we do not), then we estimate the standard error of the sample mean = the standard deviation of the sample / the square root of the sample size = 0.019 / √38 = 0.00308 centimeters.
References
Question From: Session 3 > Reading 11 > LOS f Related Material:
Key Concepts by LOS
The average U.S. dollar/Euro exchange rate from a sample of 36 monthly observations is $1.00/Euro. The population variance is 0.49. What is the 95% confidence interval for the mean U.S. dollar/Euro exchange rate?
$0.8075 to $1.1925. $0.7713 to $1.2287. $0.5100 to $1.4900.
Explanation
The population standard deviation is the square root of the variance (√0.49 = 0.7). Because we know the population standard deviation, we use the z-statistic. The z-statistic reliability factor for a 95% confidence interval is 1.960. The confidence interval is $1.00 ± 1.960($0.7 / √36) or $1.00 ± $0.2287.
References
Question From: Session 3 > Reading 11 > LOS j Related Material:
Key Concepts by LOS
Which of the following would least likely be categorized as a multivariate distribution?
✗ B) ✓ C)
Question #13 of 193
Question ID: 413137✗ A) ✗ B) ✓ C)
Question #14 of 193
Question ID: 413158✗ A) ✓ B) ✗ C)
The return of a stock and the return of the DJIA. The days a stock traded and the days it did not trade.
Explanation
The number of days a stock traded and did not trade describes only one random variable. Both of the other cases involve two or more random variables.
References
Question From: Session 3 > Reading 10 > LOS k Related Material:
Key Concepts by LOS
A probability distribution is least likely to:
contain all the possible outcomes. have only non-negative probabilities.
give the probability that the distribution is realistic.
Explanation
The probability distribution may or may not reflect reality. But the probability distribution must list all possible outcomes, and probabilities can only have non-negative values.
References
Question From: Session 3 > Reading 10 > LOS a Related Material:
Key Concepts by LOS
Which of the following could be the set of all possible outcomes for a random variable that follows a binomial distribution?
(-1, 0, 1).
(0, 1, 2, 3, 4, 5, 6, 7, 8, 9, 10, 11). (1, 2).
Explanation
Question #15 of 193
Question ID: 413147✓ A) ✗ B) ✗ C)
Question #16 of 193
Question ID: 413287limit n. The upper limit in this case is 11.
References
Question From: Session 3 > Reading 10 > LOS f Related Material:
Key Concepts by LOS
Which of the following could least likely be a probability function?
X:(1,2,3,4) p(x) = 0.2. X:(1,2,3,4) p(x) = x / 10. X:(1,2,3,4) p(x) = (x × x) / 30.
Explanation
In a probability function, the sum of the probabilities for all of the outcomes must equal one. Only one of the probability functions in these answers fails to sum to one.
References
Question From: Session 3 > Reading 10 > LOS c Related Material:
Key Concepts by LOS
The table below is for five samples drawn from five separate populations. The far left columns give information on the population distribution, population variance, and sample size. The right-hand columns give three choices for the appropriate tests: Z = z-statistic, and t = t-statistic. "None" means that a test statistic is not available.
Sampling From
Test Statistic Choices
Distribution Variance n
One Two Three
Normal
5.60
75
Z
Z
Z
Non-normal
n/a
45
Z
t
t
Normal
n/a
1000 Z
t
t
Non-normal 14.3
15
t
none
t
✓ A) ✗ B) ✗ C)
Question #17 of 193
Question ID: 413190✗ A) ✓ B) ✗ C)
Which set of test statistic choices (One, Two, or Three) matches the correct test statistic to the sample for all five samples?
Two. One. Three.
Explanation
For the exam: COMMIT THE FOLLOWING TABLE TO MEMORY!
When you are sampling from a: and the sample size is small, use a: and the sample size is large, use a:
Normal distribution with a known variance Z-statistic Z-statistic
Normal distribution with an unknown variance t-statistic t-statistic
Nonnormal distribution with a known variance not available Z-statistic
Nonnormal distribution with an unknown variance not available t-statistic
References
Question From: Session 3 > Reading 11 > LOS j Related Material:
Key Concepts by LOS
The mean return of a portfolio is 20% and its standard deviation is 4%. The returns are normally distributed. Which of the following statements about this distribution are least accurate? The probability of receiving a return:
of less than 12% is 0.025. in excess of 16% is 0.16. between 12% and 28% is 0.95.
Explanation
The probability of receiving a return greater than 16% is calculated by adding the probability of a return between 16% and 20% (given a mean of 20% and a standard deviation of 4%, this interval is the left tail of one standard deviation from the mean, which includes 34% of the observations.) to the area from 20% and higher (which starts at the mean and increases to infinity and includes 50% of the observations.) The probability of a return greater than 16% is 34 + 50 = 84%.
Note: 0.16 is the probability of receiving a return less than 16%.
References
Question #18 of 193
Question ID: 413224✗ A) ✓ B) ✗ C)
Question #19 of 193
Question ID: 413316✗ A) ✗ B) ✓ C) Related Material:
Key Concepts by LOS
Given a holding period return of R, the continuously compounded rate of return is:
e − 1. ln(1 + R). ln(1 − R) − 1.
Explanation
This is the formula for the continuously compounded rate of return.
References
Question From: Session 3 > Reading 10 > LOS p Related Material:
Key Concepts by LOS
A research paper that reports finding a profitable trading strategy without providing any discussion of an economic theory that makes predictions consistent with the empirical results is most likely evidence of:
a sample that is not large enough. a non-normal population distribution. data mining.
Explanation
Data mining occurs when the analyst continually uses the same database to search for patterns or trading rules until he finds one that works. If you are reading research that suggests a profitable trading strategy, make sure you heed the following warning signs of data mining:
Evidence that the author used many variables (most unreported) until he found ones that were significant.
The lack of any economic theory that is consistent with the empirical results.
References
Question From: Session 3 > Reading 11 > LOS k
Question #20 of 193
Question ID: 434206✗ A) ✓ B) ✗ C)
Question #21 of 193
Question ID: 413164✗ A) ✓ B) ✗ C)
Key Concepts by LOS
The safety-first criterion focuses on:
SEC regulations. shortfall risk.
margin requirements.
Explanation
The safety-first criterion focuses on shortfall risk which is the probability that a portfolio's value or return will fall below a given threshold level. The safety-first criterion minimizes the probability of falling below the threshold level or return.
References
Question From: Session 3 > Reading 10 > LOS n Related Material:
Key Concepts by LOS
A stock priced at $20 has an 80% probability of moving up and a 20% probability of moving down. If it moves up, it increases by a factor of 1.05. If it moves down, it decreases by a factor of 1/1.05. What is the expected stock price after two successive periods?
$22.05. $21.24. $20.05.
Explanation
If the stock moves up twice, it will be worth $20 × 1.05 × 1.05 = $22.05. The probability of this occurring is 0.80 × 0.80 = 0.64. If the stock moves down twice, it will be worth $20 × (1/1.05) × (1/1.05) = $18.14. The probability of this occurring is 0.20 × 0.20 = 0.04. If the stock moves up once and down once, it will be worth $20 × 1.05 × (1/1.05) = $20.00. This can occur if either the stock goes up then down or down then up. The probability of this occurring is 0.80 × 0.20 + 0.20 × 0.80 = 0.32. Multiplying the potential stock prices by the probability of them occurring provides the expected stock price: ($22.05 × 0.64) + ($18.14 × 0.04) + ($20.00 × 0.32) = $21.24.
References
Question #22 of 193
Question ID: 413166✓ A) ✗ B) ✗ C)
Question #23 of 193
Question ID: 413142✗ A) ✗ B) ✓ C)
Question #24 of 193
Question ID: 652911Key Concepts by LOS
A total return index begins the year at 1350.23 and ends the year at 1412.95. A portfolio that tracks this index earns a total return of 3.65% for the year. The tracking error of this portfolio is closest to:
-1.0%. 4.7%. 0.9%.
Explanation
The return for the index is 1412.95 / 1350.23 − 1 = 4.65%. Tracking error is 3.65% − 4.65% = -1.00%.
References
Question From: Session 3 > Reading 10 > LOS h Related Material:
Key Concepts by LOS
A random variable that has a countable number of possible values is called a:
continuous random variable. probability distribution. discrete random variable.
Explanation
A discrete random variable is one for which the number of possible outcomes are countable, and for each possible outcome, there is a measurable and positive probability. A continuous random variable is one for which the number of outcomes is not countable.
References
Question From: Session 3 > Reading 10 > LOS b Related Material:
✓ A) ✗ B) ✗ C)
Question #25 of 193
Question ID: 413146✓ A) ✗ B) ✗ C)
Cumulative Z-Table
z 0.05 0.06 0.07 0.08 0.09
2.4 0.9929 0.9931 0.9932 0.9934 0.9936 2.5 0.9946 0.9948 0.9949 0.9951 0.9952 2.6 0.9960 0.9961 0.9962 0.9963 0.9964 2.7 0.9970 0.9971 0.9972 0.9973 0.9974
The average return on the Russell 2000 index for 121 monthly observations was 1.5%. The population standard deviation is assumed to be 8.0%. What is a 99% confidence interval for the mean monthly return on the Russell 2000 index?
-0.4% to 3.4%. 0.1% to 2.9%. -6.5% to 9.5%.
Explanation
Because we know the population standard deviation, we use the z-statistic. The z-statistic reliability factor for a 99% confidence interval is 2.575. The confidence interval is 1.5% ± 2.575[(8.0%)/√121] or 1.5% ± 1.9%.
References
Question From: Session 3 > Reading 11 > LOS j Related Material:
Key Concepts by LOS
If a smooth curve is to represent a probability density function, what two requirements must be satisfied? The area under the curve must be:
one and the curve must not fall below the horizontal axis. one and the curve must not rise above the horizontal axis. zero and the curve must not fall below the horizontal axis.
Explanation
If a smooth curve is to represent a probability density function, the total area under the curve must be one (probability of all outcomes equals 1) and the curve must not fall below the horizontal axis (no outcome can have a negative chance of occurring).
References
Question From: Session 3 > Reading 10 > LOS c Related Material:
Question #26 of 193
Question ID: 413238✓ A) ✗ B)
✗ C)
Question #27 of 193
Question ID: 413317✓ A) ✗ B) ✗ C)
An analyst wants to generate a simple random sample of 500 stocks from all 10,000 stocks traded on the New York Stock Exchange, the American Stock Exchange, and NASDAQ. Which of the following methods is least likely to generate a random sample?
Using the 500 stocks in the S&P 500.
Listing all the stocks traded on all three exchanges in alphabetical order and selecting every 20th stock.
Assigning each stock a unique number and generating a number using a random number generator. Then selecting the stock with that number for the sample and repeating until there are 500 stocks in the sample.
Explanation
The S&P 500 is not a random sample of all stocks traded in the U.S. because it represents the 500 largest stocks. The other two choices are legitimate methods of selecting a simple random sample.
References
Question From: Session 3 > Reading 11 > LOS a Related Material:
Key Concepts by LOS
The practice of repeatedly using the same database to search for patterns until one is found is called:
data mining. data snooping. sample selection bias.
Explanation
The practice of data mining involves analyzing the same data so as to detect a pattern, which may not replicate in other data sets, also known as torturing the data until it confesses.
References
Question From: Session 3 > Reading 11 > LOS k Related Material:
Question #28 of 193
Question ID: 413145✓ A) ✗ B) ✗ C)
Question #29 of 193
Question ID: 434219✗ A) ✓ B) ✗ C)
In a continuous probability density function, the probability that any single value of a random variable occurs is equal to what?
Zero.
1/N. One.
Explanation
Since there are infinite potential outcomes in a continuous pdf, the probability of any single value of a random variable occurring is 1/infinity = 0.
References
Question From: Session 3 > Reading 10 > LOS c Related Material:
Key Concepts by LOS
Student's t-Distribution
Level of Significance for One-Tailed Test df 0.100 0.050 0.025 0.01 0.005 0.0005
Level of Significance for Two-Tailed Test df 0.20 0.10 0.05 0.02 0.01 0.001 40 1.303 1.684 2.021 2.423 2.704 3.551 60 1.296 1.671 2.000 2.390 2.660 3.460 120 1.289 1.658 1.980 2.358 2.617 3.373
The average salary for a sample of 61 CFA charterholders with 10 years experience is $200,000, and the sample standard deviation is $80,000. Assume the population is normally distributed. Which of the following is a 99% confidence interval for the population mean salary of CFA charterholders with 10 years of experience?
$172,514 to $227,486. $172,754 to $227,246. $160,000 to $240,000.
Explanation
If the distribution of the population is normal, but we don't know the population variance, we can use the Student's t-distribution to construct a confidence interval. Because there are 61 observations, the degrees of freedom are 60. From the student's t table, we can determine that the reliability factor for t , or t , is 2.660. Then the 99% confidence interval is $200,000 ±
2.660($80,000 / √61) or $200,000 ± 2.660 × $10,243, or $200,000 ± $27,246.
References
Question #30 of 193
Question ID: 413251✓ A)
✗ B) ✗ C)
Question #31 of 193
Question ID: 413185✗ A) ✗ B) ✓ C)
Question From: Session 3 > Reading 11 > LOS j Related Material:
Key Concepts by LOS
Which of the following statements regarding the central limit theorem (CLT) is least accurate? The CLT:
states that for a population with mean µ and variance σ , the sampling distribution of the sample means for any sample of size n will be approximately normally distributed.
holds for any population distribution, assuming a large sample size.
gives the variance of the distribution of sample means as σ / n, where σ is the population variance and n is the sample size.
Explanation
This question is asking you to select the inaccurate statement. The CLT states that for a population with mean µ and a finite variance σ , the sampling distribution of the sample means becomes approximately normally distributed as the sample size becomes large. The other statements are accurate.
References
Question From: Session 3 > Reading 11 > LOS e Related Material:
Key Concepts by LOS
A multivariate distribution:
gives multiple probabilities for the same outcome. applies only to binomial distributions.
specifies the probabilities associated with groups of random variables.
Explanation
This is the definition of a multivariate distribution.
References
Question From: Session 3 > Reading 10 > LOS k Related Material:
Key Concepts by LOS
2
2 2
Question #32 of 193
Question ID: 413228✗ A) ✓ B) ✗ C)
Question #33 of 193
Question ID: 413315✓ A) ✗ B) ✗ C)
Question #34 of 193
Question ID: 413208Over a period of one year, an investor's portfolio has declined in value from 127,350 to 108,427. What is the continuously compounded rate of return?
-13.84%. -16.09%. -14.86%.
Explanation
The continuously compounded rate of return = ln( S / S ) = ln(108,427 / 127,350) = -16.09%.
References
Question From: Session 3 > Reading 10 > LOS p
Related Material: Key Concepts by LOS
The average mutual fund return calculated from a sample of funds with significant survivorship bias would most likely be:
larger than the mean return of the population of all mutual funds. smaller than the mean return of the population of all mutual funds.
an unbiased estimate of the mean return of the population of all mutual funds if the sample size was large enough.
Explanation
If we try to draw any conclusions from an analysis of a mutual fund database with survivorship bias, we overestimate the average mutual fund return, because we don't include the poorer-performing funds that dropped out. A larger sample size from a
database with survivorship bias will still result in a biased estimate.
References
Question From: Session 3 > Reading 11 > LOS k
Related Material: Key Concepts by LOS
✗ A) ✓ B) ✗ C)
Question #35 of 193
Question ID: 413242✗ A) ✗ B) ✓ C)
Which of the following portfolios provides the best "safety first" ratio if the minimum acceptable return is 6%?
Portfolio Expected Return (%) Standard Deviation (%)
1
13
5
2
11
3
3
9
2
1. 2. 3.
Explanation
Roy's safety-first criterion requires the maximization of the SF Ratio: SF Ratio = (expected return - threshold return) / standard deviation
Portfolio Expected Return (%) Standard Deviation
(%)
SF Ratio
1
13
5
1.40
2
11
3
1.67
3
9
2
1.50
Portfolio #2 has the highest safety-first ratio at 1.67.
References
Question From: Session 3 > Reading 10 > LOS n
Related Material: Key Concepts by LOS
A sample of five numbers drawn from a population is (5, 2, 4, 5, 4). Which of the following statements concerning this sample is most accurate?
The sampling error of the sample is equal to the standard error of the sample. The mean of the sample is ∑X / (n − 1) = 5.
The variance of the sample is: ∑(x − mean of the sample) / (n − 1) = 1.5.
Explanation
The mean of the sample is ∑X / n = 20 / 5 = 4. The sampling error of the sample is the difference between a sample statistic and
Question #36 of 193
Question ID: 413167✗ A) ✗ B) ✓ C)
Question #37 of 193
Question ID: 413241✓ A) ✗ B) ✗ C)
its corresponding population parameter.
References
Question From: Session 3 > Reading 11 > LOS b Related Material:
Key Concepts by LOS
A portfolio begins the year with a value of $100,000 and ends the year with a value of $95,000. The manager's performance is measured against an index that declined by 7% on a total return basis during the year. The tracking error of this portfolio is closest to:
−5%. −2%. 2%.
Explanation
Tracking error is the portfolio total return minus the benchmark total return. The portfolio return is ($95,000 − $100,000) / $100,000 = −5%. Tracking error = −5% − (−7%) = +2%.
References
Question From: Session 3 > Reading 10 > LOS h Related Material:
Key Concepts by LOS
Which of the following statements about sampling errors is least accurate?
Sampling errors are errors due to the wrong sample being selected from the population. Sampling error is the error made in estimating the population mean based on a sample mean. Sampling error is the difference between a sample statistic and its corresponding population parameter.
Explanation
Sampling error is the difference between a sample statistic (the mean, variance, or standard deviation of the sample) and its corresponding population parameter (the mean, variance, or standard deviation of the population).
Question #38 of 193
Question ID: 413248✓ A) ✗ B) ✗ C)
Question #39 of 193
Question ID: 413196✓ A) ✗ B) ✗ C)
Question From: Session 3 > Reading 11 > LOS b Related Material:
Key Concepts by LOS
An analyst is asked to calculate standard deviation using monthly returns over the last five years. These data are best described as:
time series data. cross-sectional data. systematic sampling data.
Explanation
Time series data are taken at equally spaced intervals, such as monthly, quarterly, or annual. Cross sectional data are taken at a single point in time. An example of cross-sectional data is dividend yields on 500 stocks as of the end of a year.
References
Question From: Session 3 > Reading 11 > LOS d Related Material:
Key Concepts by LOS
If a stock's return is normally distributed with a mean of 16% and a standard deviation of 50%, what is the probability of a negative return in a given year?
0.3745. 0.5000. 0.0001.
Explanation
The selected random value is standardized (its z-value is calculated) by subtracting the mean from the selected value and dividing by the standard deviation. This results in a z-value of (0 − 16) / 50 = -0.32. Changing the sign and looking up +0.32 in the z-value table yields 0.6255 as the probability that a random variable is to the right of the standardized value (i.e. more than zero). Accordingly, the probability of a random variable being to the left of the standardized value (i.e. less than zero) is 1 − 0.6255 = 0.3745.
References
Question #40 of 193
Question ID: 413204✗ A) ✗ B) ✓ C)
Question #41 of 193
Question ID: 413207✗ A) ✗ B) ✓ C) Related Material:
Key Concepts by LOS
The standard normal distribution is most completely described as a:
symmetrical distribution with a mean equal to its median. distribution that exhibits zero skewness and no excess kurtosis. normal distribution with a mean of zero and a standard deviation of one.
Explanation
The standard normal distribution is defined as a normal distribution that has a mean of zero and a standard deviation of one. The other choices apply to any normal distribution.
References
Question From: Session 3 > Reading 10 > LOS m
Related Material: Key Concepts by LOS
The mean and standard deviation of returns for three portfolios are listed below in percentage terms.
Portfolio X: Mean 5%, standard deviation 3%. Portfolio Y: Mean 14%, standard deviation 20%. Portfolio Z: Mean 19%, standard deviation 28%.
Using Roy's safety-first criteria and a threshold of 4%, select the optimal portfolio.
Portfolio X. Portfolio Y. Portfolio Z.
Explanation
Portfolio Z has the largest value for the SFRatio: (19 − 4) / 28 = 0.5357.
For Portfolio X, the SFRatio is (5 - 4) / 3 = 0.3333. For Portfolio Y, the SFRatio is (14 - 4) / 20 = 0.5000.
References
Question #42 of 193
Question ID: 413314✗ A) ✗ B) ✓ C)
Question #43 of 193
Question ID: 413260✗ A) ✗ B) ✓ C) Related Material:
Key Concepts by LOS
A study reports that from 2002 to 2004 the average return on growth stocks was twice as large as that of value stocks. These results most likely reflect:
survivorship bias. look-ahead bias. time-period bias.
Explanation
Time-period bias can result if the time period over which the data is gathered is either too short because the results may reflect phenomenon specific to that time period, or if a change occurred during the time frame that would result in two different return distributions. In this case the time period sampled is probably not large enough to draw any conclusions about the long-term relative performance of value and growth stocks, even if the sample size within that time period is large.
Look-ahead bias occurs when the analyst uses historical data that was not publicly available at the time being studied.
Survivorship bias is a form of sample selection bias in which the observations in the sample are biased because the elements of the sample that survived until the sample was taken are different than the elements that dropped out of the population.
References
Question From: Session 3 > Reading 11 > LOS k
Related Material: Key Concepts by LOS
Joseph Lu calculated the average return on equity for a sample of 64 companies. The sample average is 0.14 and the sample standard deviation is 0.16. The standard error of the mean is closest to:
0.0025. 0.1600. 0.0200.
Explanation
The standard error of the mean = σ/√n = 0.16/√64 = 0.02.
References
Question #44 of 193
Question ID: 413300✗ A) ✗ B) ✓ C)
Question #45 of 193
Question ID: 413295✓ A) ✗ B) ✗ C) Related Material:
Key Concepts by LOS
A local high school basketball team had 18 home games this season and averaged 58 points per game. If we assume that the number of points made in home games is normally distributed, which of the following is most likely the range of points for a confidence interval of 90%?
26 to 80. 24 to 78. 34 to 82.
Explanation
This question has a bit of a trick. To answer this question, remember that the mean is at the midpoint of the confidence interval. The correct confidence interval will have a midpoint of 58. (34 + 82) / 2 = 58.
References
Question From: Session 3 > Reading 11 > LOS j
Related Material: Key Concepts by LOS
A traffic engineer is trying to measure the effects of carpool-only lanes on the expressway. Based on a sample of 1,000 cars at rush hour, he finds that the mean number of occupants per car is 2.5, with a standard deviation of 0.4. Assuming that the population is normally distributed, what is the confidence interval at the 5% significance level for the number of occupants per car?
2.475 to 2.525. 2.288 to 2.712. 2.455 to 2.555.
Explanation
The Z-score corresponding with a 5% significance level (95% confidence level) is 1.96. The confidence interval is equal to: 2.5 ± 1.96(0.4 / √1,000) = 2.475 to 2.525. (We can use Z-scores because the size of the sample is so large.)
References
Question #46 of 193
Question ID: 413281✗ A) ✓ B) ✗ C)
Question #47 of 193
Question ID: 413133✗ A) ✓ B)
✗ C)
Key Concepts by LOS
When is the t-distribution the appropriate distribution to use? The t-distribution is the appropriate distribution to use when constructing confidence intervals based on:
small samples from populations with known variance that are at least approximately normal. small samples from populations with unknown variance that are at least approximately normal. large samples from populations with known variance that are nonnormal.
Explanation
The t-distribution is the appropriate distribution to use when constructing confidence intervals based on small samples from populations with unknown variance that are either normal or approximately normal.
References
Question From: Session 3 > Reading 11 > LOS i Related Material:
Key Concepts by LOS
Which of the following statements about probability distributions is most accurate?
A discrete uniform random variable has varying probabilities for each outcome that total to one.
A binomial distribution counts the number of successes that occur in a fixed number of independent trials that have mutually exclusive (i.e. yes or no) outcomes.
A continuous uniform distribution has a lower limit but no upper limit.
Explanation
Binomial probability distributions give the result of a single outcome and are used to study discrete random variables where you want to know the probability that an exact event will happen. A continuous uniform distribution has both an upper and a lower limit. A discrete uniform random variable has equal probabilities for each outcome.
References
Question From: Session 3 > Reading 10 > LOS a Related Material:
Question #48 of 193
Question ID: 413253✗ A) ✗ B) ✓ C)
Question #49 of 193
Question ID: 413140✓ A) ✗ B) ✗ C)
Question #50 of 193
Question ID: 413322✓ A)
According to the Central Limit Theorem, the distribution of the sample means is approximately normal if:
the underlying population is normal.
the standard deviation of the population is known. the sample size n > 30.
Explanation
The Central Limit Theorem states that if the sample size is sufficiently large (i.e. greater than 30) the sampling distribution of the sample means will be approximately normal.
References
Question From: Session 3 > Reading 11 > LOS e Related Material:
Key Concepts by LOS
Which of the following is least likely a probability distribution?
Zeta Corp.: P(dividend increases) = 0.60, P(dividend decreases) = 0.30. Roll an irregular die: p(1) = p(2) = p(3) = p(4) = 0.2 and p(5) = p(6) = 0.1. Flip a coin: P(H) = P(T) = 0.5.
Explanation
All the probabilities must be listed. In the case of Zeta Corp. the probabilities do not sum to one.
References
Question From: Session 3 > Reading 10 > LOS a Related Material:
Key Concepts by LOS
When sampling from a population, the most appropriate sample size:
✗ B)
✗ C)
Question #51 of 193
Question ID: 434214✗ A) ✓ B) ✗ C)
minimizes the sampling error and the standard deviation of the sample statistic around its population value.
is at least 30.
Explanation
A larger sample reduces the sampling error and the standard deviation of the sample statistic around its population value. However, this does not imply that the sample should be as large as possible, or that the sampling error must be as small as can be achieved. Larger samples might contain observations that come from a different population, in which case they would not necessarily improve the estimates of the population parameters. Cost also increases with the sample size. When the cost of increasing the sample size is greater than the value of the extra precision gained, increasing the sample size is not appropriate.
References
Question From: Session 3 > Reading 11 > LOS k Related Material:
Key Concepts by LOS
Student's t-Distribution
Level of Significance for One-Tailed Test df 0.100 0.050 0.025 0.01 0.005 0.0005
Level of Significance for Two-Tailed Test df 0.20 0.10 0.05 0.02 0.01 0.001 24 1.318 1.711 2.064 2.492 2.797 3.745 25 1.316 1.708 2.060 2.485 2.787 3.725 26 1.315 1.706 2.056 2.479 2.779 3.707 27 1.314 1.703 2.052 2.473 2.771 3.690
Books Fast, Inc., prides itself on shipping customer orders quickly. Books Fast sampled 27 of its customers within a 200-mile radius and found a mean delivery time of 76 hours, with a sample standard deviation of 6 hours. Based on this sample and assuming a normal distribution of delivery times, what is the confidence interval for the mean delivery time at 5% significance?
65.75 to 86.25 hours. 73.63 to 78.37 hours. 68.50 to 83.50 hours.
Explanation
The confidence interval is equal to 76 + or − (2.056)(6 / √27) = 73.63 to 78.37 hours.
Because the sample size is small, we use the t-distribution with (27 − 1) degrees of freedom.
References
Question #52 of 193
Question ID: 413229✗ A) ✓ B) ✗ C)
Question #53 of 193
Question ID: 413199✗ A) ✓ B) ✗ C) Related Material:
Key Concepts by LOS
A stock increased in value last year. Which will be greater, its continuously compounded or its holding period return?
Neither, they will be equal. Its holding period return.
Its continuously compounded return.
Explanation
When a stock increases in value, the holding period return is always greater than the continuously compounded return that would be required to generate that holding period return. For example, if a stock increases from $1 to $1.10 in a year, the holding period return is 10%. The continuously compounded rate needed to increase a stock's value by 10% is Ln(1.10) = 9.53%.
References
Question From: Session 3 > Reading 10 > LOS p Related Material:
Key Concepts by LOS
A grant writer for a local school district is trying to justify an application for funding an after-school program for low-income families. Census information for the school district shows an average household income of $26,200 with a standard deviation of $8,960. Assuming that the household income is normally distributed, what is the percentage of households in the school district with incomes of less than $12,000?
15.87%. 5.71%. 9.92%.
Explanation
Z = ($12,000 - $26,200) / $8,960 = -1.58.
From the table of areas under the standard normal curve, 5.71% of observations are more than 1.58 standard deviations below the mean.
References
Question From: Session 3 > Reading 10 > LOS m Related Material:
Question #54 of 193
Question ID: 413311✗ A) ✓ B) ✗ C)
Question #55 of 193
Question ID: 434209✗ A) ✓ B)
Sunil Hameed is a reporter with the weekly periodical The Fun Finance Times. Today, he is scheduled to interview a researcher who claims to have developed a successful technical trading strategy based on trading on the CEO's birthday (sample was taken from the Fortune 500). After the interview, Hameed summarizes his notes (partial transcript as follows). The researcher:
was defensive about the lack of economic theory consistent with his results.
used the same database of data for all his tests and has not tested the trading rule on out-of-sample data.
excluded stocks for which he could not determine the CEO's birthday.
used a sample cut-off date of the month before the latest market correction.
Select the choice that best completes the following: Hameed concludes that the research is flawed because the data and process are biased by:
data mining, time-period bias, and look-ahead bias. data mining, sample selection bias, and time-period bias. sample selection bias and time-period bias.
Explanation
Evidence that the researcher used data mining is that he was defensive about the lack of economic theory consistent with his results and that he used the same database of data for all his tests. One way to avoid data mining is to test the trading rule on out-of-sample data. Sample selection bias occurs when some data is systematically excluded from the analysis, usually because it is not available. Here, the researcher excluded stocks for which he could not determine the CEO's birthday. Time-period bias can result if the time period is too short or too long. Here, it is likely that the period was too short since the researcher used a cut-off date of the month before the latest market correction. Note: this could be an additional example of data mining.
We are not given enough information to determine if the researcher is guilty of look-ahead bias (which occurs when the analyst uses historical data that was not publicly available at the time being studied).
References
Question From: Session 3 > Reading 11 > LOS k Related Material:
Key Concepts by LOS
A stated interest rate of 9% compounded continuously results in an effective annual rate closest to:
✗ C)
Question #56 of 193
Question ID: 413139✗ A) ✗ B)
✓ C)
Question #57 of 193
Question ID: 413263✓ A) ✗ B) ✗ C)
9.20%.
Explanation
The effective annual rate with continuous compounding = e − 1 = e − 1 = 0.09417, or 9.42%.
References
Question From: Session 3 > Reading 10 > LOS p
Related Material: Key Concepts by LOS
Which of the following statements about probability distributions is least accurate?
The skewness of a normal distribution is zero.
A discrete random variable is a variable that can assume only certain clearly separated values resulting from a count of some set of items.
A binomial probability distribution is an example of a continuous probability distribution.
Explanation
The binomial probability distribution is an example of a discrete probability distribution. There are only two possible outcomes of each trial and the outcomes are mutually exclusive. For example, in a coin toss the outcome is either heads or tails.
The other responses are both correct definitions.
References
Question From: Session 3 > Reading 10 > LOS a Related Material:
Key Concepts by LOS
Melissa Cyprus, CFA, is conducting an analysis of inventory management practices in the retail industry. She assumes the population cross-sectional standard deviation of inventory turnover ratios is 20. How large a random sample should she gather in order to ensure a standard error of the sample mean of 4?
25. 20. 80.
Explanation
Question #58 of 193
Question ID: 434207✓ A) ✗ B)
✗ C)
Given the population standard deviation and the standard error of the sample mean, you can solve for the sample size. Because the standard error of the sample mean equals the standard deviation of the population divided by the square root of the sample size, 4 = 20 / n , so n = 5, so n = 25.
References
Question From: Session 3 > Reading 11 > LOS f Related Material:
Key Concepts by LOS
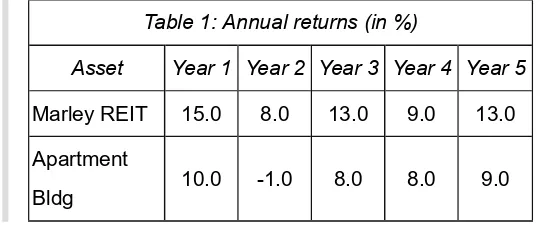
Claude Bellow, CFA, is an analyst with a real-estate focused investment firm. Today, one of the partners e-mails Bellow the following table and requests that he look into the reward-to-variability ratios of two asset classes. The table below gives five years of annual returns for Marley REIT (real estate investment trust) and a large urban apartment building. Marley REIT invests in commercial properties. The risk-free rate is 5.0% and the firm's threshold rate for this type is investment is 5.7%. (Note: For this question, calculate the mean returns using the arithmetic mean.)
Table 1: Annual returns (in %)
Asset
Year 1 Year 2 Year 3 Year 4 Year 5
Marley REIT
15.0
8.0
13.0
9.0
13.0
Apartment
Bldg
10.0
-1.0
8.0
8.0
9.0
One of the office assistants begins to "run some numbers," but is then called away to an important meeting. So far, the assistant has calculated the standard deviation of the apartment building returns at 3.97% and the standard deviation of the REIT returns at 2.65%. (He assumed that the returns given represent the entire population of returns.) Now, Bellow must finish the work.
Bellow should conclude that the:
REIT has a higher excess return per unit of risk than the apartment building has per unit of risk. partner is asking Bellow to select the investment with the minimal probability that the return falls below 5.70%.
safety-first ratio for the REIT is 2.49.
Explanation
Another name for the reward-to-variability ratio is the Sharpe ratio, and the Sharpe ratio measures the excess return per unit of risk. So, the question is asking us to identify which investment has the highest Sharpe ratio. The formula is:
Question #59 of 193
Question ID: 413195✗ A) ✓ B) ✗ C)
The Sharpe Ratio measures the excess return per unit of risk.
For the apartment building:
The standard deviation of apartment building returns is 3.97%.
The mean expected return of the apartment building = (10 − 1 + 8 + 8 + 9) / 5 = 6.8% Thus, the Sharpe Ratio = (6.80% - 5.00%) / 3.97% = 0.45.
For the REIT:
The standard deviation of the REIT returns is 2.65%.
The mean expected return of the REIT = (15 + 8 + 13 + 9 + 13) / 5 = 11.6% Thus, the Sharpe Ratio = (11.60% − 5.00%) / 2.65% = 2.49.
Thus, the REIT has a higher Sharpe ratio and thus a higher excess return per unit of risk than the apartment building has per unit of risk. Investors prefer a large Sharpe ratio because it is assumed that they prefer return to risk.
The other statements are false. Remember that the partner asked about the reward-to-variability ratio. The safety-first ratio is very similar to the Sharpe ratio, except that the safety-first ratio replaces the risk-free rate term with the threshold rate. Thus, the safety-first ratio for the REIT = [(11.6% − 5.7%) / 2.65%] = 2.23. If the partner had asked about the safety-first ratio, he would have been asking Bellow to select the investment with the minimal probability that the return falls below 5.70%. As shown in the calculation of the REIT Sharpe Ratio, the REIT's excess return over the risk free rate = 11.6% − 5.0% = 6.60%.
References
Question From: Session 3 > Reading 10 > LOS n Related Material:
Key Concepts by LOS
The average amount of snow that falls during January in Frostbite Falls is normally distributed with a mean of 35 inches and a standard deviation of 5 inches. The probability that the snowfall amount in January of next year will be between 40 inches and 26.75 inches is closest to:
87%. 79%. 68%.
Explanation
To calculate this answer, we will use the properties of the standard normal distribution. First, we will calculate the Z-value for the upper Apt
Question #60 of 193
Question ID: 413191✗ A) ✗ B) ✓ C)
Question #61 of 193
Question ID: 413181and lower points and then we will determine the approximate probability covering that range. Note: This question is an example of why it is important to memorize the general properties of the normal distribution.
Z = (observation - population mean) / standard deviation
Z = (26.75 - 35) / 5 = -1.65. (1.65 standard deviations to the left of the mean) Z = (40 - 35) / 5 = 1.0 (1 standard deviation to the right of the mean)
Using the general approximations of the normal distribution:
68% of the observations fall within ± one standard deviation of the mean. So, 34% of the area falls between 0 and +1 standard deviation from the mean.
90% of the observations fall within ± 1.65 standard deviations of the mean. So, 45% of the area falls between 0 and +1.65 standard deviations from the mean.
Here, we have 34% to the right of the mean and 45% to the left of the mean, for a total of 79%.
References
Question From: Session 3 > Reading 10 > LOS m Related Material:
Key Concepts by LOS
For a normal distribution, what approximate percentage of the observations fall within ±3 standard deviation of the mean?
66%. 95%. 99%.
Explanation
For normal distributions, approximately 99% of the observations fall within ±3 standard deviations of the mean.
References
Question From: Session 3 > Reading 10 > LOS l Related Material:
Key Concepts by LOS
A multivariate normal distribution that includes three random variables can be completely described by the means and variances of each of the random variables and the:
26.75
✗ A) ✗ B) ✓ C)
Question #62 of 193
Question ID: 413168✗ A) ✓ B) ✗ C)
Question #63 of 193
Question ID: 413268conditional probabilities among the three random variables. correlation coefficient of the three random variables. correlations between each pair of random variables.
Explanation
A multivariate normal distribution that includes three random variables can be completely described by the means and variances of each of the random variables and the correlations between each pair of random variables. Correlation measures the strength of the linear relationship between two random variables (thus, "the correlation coefficient of the three random variables" is inaccurate).
References
Question From: Session 3 > Reading 10 > LOS k
Related Material: Key Concepts by LOS
Tracking error for a portfolio is best described as the:
standard deviation of differences between an index return and portfolio return. portfolio return minus a benchmark return.
sample mean minus population mean.
Explanation
Tracking error is the difference between the total return on a portfolio and the total return on the benchmark used to measure the portfolio's performance. The difference between a sample statistic and a population parameter is sampling error. The standard deviation of the difference between a portfolio return and an index (or any chosen benchmark return) is more often referred to as tracking risk.
References
Question From: Session 3 > Reading 10 > LOS h Related Material:
Key Concepts by LOS
✗ A) ✓ B) ✗ C)
Question #64 of 193
Question ID: 413267✗ A) ✗ B) ✓ C)
Question #65 of 193
Question ID: 413156✗ A) ✓ B)
1.00. 0.04. 5.68.
Explanation
The standard error of the sample mean when the standard deviation of the population is not known is estimated by the standard deviation of the sample divided by the square root of the sample size. In this case, 0.4 / √100 = 0.04.
References
Question From: Session 3 > Reading 11 > LOS f
Related Material: Key Concepts by LOS
If the number of offspring for females of a certain mammalian species has a mean of 16.4 and a standard deviation of 3.2, what will be the standard error of the sample mean for a survey of 25 females of the species?
1.28. 3.20. 0.64.
Explanation
The standard error of the sample mean when the standard deviation of the population is known is equal to the standard deviation of the population divided by the square root of the sample size. In this case, 3.2 / √25 = 0.64.
References
Question From: Session 3 > Reading 11 > LOS f Related Material:
Key Concepts by LOS
For a certain class of junk bonds, the probability of default in a given year is 0.2. Whether one bond defaults is independent of whether another bond defaults. For a portfolio of five of these junk bonds, what is the probability that zero or one bond of the five defaults in the year ahead?
✗ C)
Question #66 of 193
Question ID: 413231✗ A) ✗ B) ✓ C)
Question #67 of 193
Question ID: 413135✗ A) ✓ B) ✗ C)
0.0819.
Explanation
The outcome follows a binomial distribution where n = 5 and p = 0.2. In this case p(0) = 0.8 = 0.3277 and p(1) = 5 × 0.8 × 0.2 = 0.4096, so P(X=0 or X=1) = 0.3277 + 0.4096.
References
Question From: Session 3 > Reading 10 > LOS f Related Material:
Key Concepts by LOS
Monte Carlo simulation is necessary to:
compute continuously compounded returns. reduce sampling error.
approximate solutions to complex problems.
Explanation
This is the purpose of this type of simulation. The point is to construct distributions using complex combinations of hypothesized parameters.
References
Question From: Session 3 > Reading 10 > LOS q
Related Material: Key Concepts by LOS
The number of ships in the harbor is an example of what kind of variable?
Continuous. Discrete. Indiscrete.
Explanation
A discrete variable is one that is represented by finite units.
References
Question #68 of 193
Question ID: 484167✗ A) ✗ B) ✓ C)
Question #69 of 193
Question ID: 413216✓ A) ✗ B) ✗ C)
Question From: Session 3 > Reading 10 > LOS a Related Material:
Key Concepts by LOS
The sample mean return of Bartlett Co. is 3% and the standard deviation is 6% based on 30 monthly returns. What is the confidence interval of a two tailed z-test of the population mean with a 5% level of significance?
1.90 to 4.10. 2.61 to 3.39. 0.85 to 5.15.
Explanation
The standard error of the sample is the standard deviation divided by the square root of n, the sample size. 6% / 30 = 1.0954%.
The confidence interval = point estimate +/- (reliability factor × standard error)
confidence interval = 3 +/- (1.96 × 1.0954) = 0.85 to 5.15
References
Question From: Session 3 > Reading 11 > LOS f Related Material:
Key Concepts by LOS
If random variable Y follows a lognormal distribution then the natural log of Y must be:
normally distributed. lognormally distributed. denoted as e .
Explanation
For any random variable that is lognormally distributed its natural logarithm (ln) will be normally distributed.
References
Question From: Session 3 > Reading 10 > LOS o Related Material:
1/2
Question #70 of 193
Question ID: 413282✓ A)
✗ B) ✗ C)
Question #71 of 193
Question ID: 413225✗ A) ✓ B) ✗ C)
Key Concepts by LOS
Which one of the following statements about the t-distribution is most accurate?
The t-distribution approaches the standard normal distribution as the number of degrees of freedom becomes large.
Compared to the normal distribution, the t-distribution has less probability in the tails.
The t-distribution is the only appropriate distribution to use when constructing confidence intervals based on large samples.
Explanation
As the number of degrees of freedom grows, the t-distribution approaches the shape of the standard normal distribution. Compared to the normal distribution, the t-distribution has fatter tails. When choosing a distribution, three factors must be considered: sample size, whether population variance is known, and if the distribution is normal.
References
Question From: Session 3 > Reading 11 > LOS i Related Material:
Key Concepts by LOS
If a stock decreases from $90 to $80, the continuously compounded rate of return for the period is:
-0.1250. -0.1178. -0.1000.
Explanation
This is given by the natural logarithm of the new price divided by the old price; ln(80 / 90) = -0.1178.
References
Question From: Session 3 > Reading 10 > LOS p Related Material:
Question #72 of 193
Question ID: 434208✓ A) ✗ B) ✗ C)
Question #73 of 193
Question ID: 413165✗ A) ✓ B) ✗ C)
A stock that pays no dividend is currently priced at 42.00. One year ago the stock was 44.23. The continuously compounded rate of return is closest to:
−5.17%. +5.17%. −5.04%.
Explanation
References
Question From: Session 3 > Reading 10 > LOS p Related Material:
Key Concepts by LOS
A stock priced at $10 has a 60% probability of moving up and a 40% probability of moving down. If it moves up, it increases by a factor of 1.06. If it moves down, it decreases by a factor of 1/1.06. What is the expected stock price after two successive periods?
$11.24. $10.27. $10.03.
Explanation
If the stock moves up twice, it will be worth $10 × 1.06 × 1.06 = $11.24. The probability of this occurring is 0.60 × 0.60 = 0.36. If the stock moves down twice, it will be worth $10 × (1/1.06) × (1/1.06) = $8.90. The probability of this occurring is 0.40 × 0.40 = 0.16. If the stock moves up once and down once, it will be worth $10 × 1.06 × (1/1.06) = $10.00. This can occur if either the stock goes up then down or down then up. The probability of this occurring is 0.60 × 0.40 + 0.40 × 0.60 = 0.48. Multiplying the potential stock prices by the probability of them occurring provides the expected stock price: ($11.24 × 0.36) + ($8.90 × 0.16) + ($10.00 × 0.48) = $10.27.
References
Question From: Session 3 > Reading 10 > LOS g Related Material:
Question #74 of 193
Question ID: 413313✓ A) ✗ B) ✗ C)
Question #75 of 193
Question ID: 413134✗ A) ✗ B) ✓ C)
An analyst has compiled stock returns for the first 10 days of the year for a sample of firms and estimated the correlation between these returns and changes in book value for these firms over the just ended year. What objection could be raised to such a correlation being used as a trading strategy?
The study suffers from look-ahead bias.
Use of year-end values causes a time-period bias. Use of year-end values causes a sample selection bias.
Explanation
The study suffers from look-ahead bias because traders at the beginning of the year would not be able to know the book value changes. Financial statements usually take 60 to 90 days to be completed and released.
References
Question From: Session 3 > Reading 11 > LOS k Related Material:
Key Concepts by LOS
Which of the following is a discrete random variable?
The realized return on a corporate bond.
The amount of time between two successive stock trades. The number of advancing stocks in the DJIA in a day.
Explanation
Since the DJIA consists of only 30 stocks, the answer associated with it would be a discrete random variable. Random variables measuring time, rates of return and weight will be continuous.
References
Question From: Session 3 > Reading 10 > LOS a Related Material:
Question #76 of 193
Question ID: 413187✗ A) ✓ B) ✗ C)
Question #77 of 193
Question ID: 413309✓ A) ✗ B) ✗ C)
Question #78 of 193
Question ID: 413221A portfolio manager is looking at an investment that has an expected annual return of 10% with a standard deviation of annual returns of 5%. Assuming the returns are approximately normally distributed, the probability that the return will exceed 20% in any given year is closest to:
0.0%. 2.28%. 4.56%.
Explanation
Given that the standard deviation is 5%, a 20% return is two standard deviations above the expected return of 10%. Assuming a normal distribution, the probability of getting a result more than two standard deviations above the expected return is 1 − Prob(Z ≤ 2) = 1 − 0.9772 = 0.0228 or 2.28% (from the Z table).
References
Question From: Session 3 > Reading 10 > LOS l Related Material:
Key Concepts by LOS
Which of the following is the best method to avoid data mining bias when testing a profitable trading strategy?
Test the strategy on a different data set than the one used to develop the rules. Increase the sample size to at least 30 observations per year.
Use a sample free of survivorship bias.
Explanation
The best way to avoid data mining is to test a potentially profitable trading rule on a data set different than the one you used to develop the rule (out-of-sample data). A larger sample size won't prevent data mining, and you can still data mine a database free of survivorship bias.
References
Question From: Session 3 > Reading 11 > LOS k Related Material:
✗ A) ✗ B) ✓ C)
Question #79 of 193
Question ID: 413276✗ A)
✓ B)
✗ C)
Question #80 of 193
Question ID: 413223✗ A) ✓ B)
Compared to a discretely compounded rate of return, continuous compounding will most likely result in a rate of return that is:
lower. the same. higher.
Explanation
A higher frequency of compounding leads to a higher compounded rate of return. A continuously compounded rate is therefore higher than any discretely compounded (and positive) rate of return.
References
Question From: Session 3 > Reading 10 > LOS p Related Material:
Key Concepts by LOS
Which of the following statements about sampling and estimation is most accurate?
The standard error of the sample means when the standard deviation of the population is known equals σ / √n, where σ = sample standard deviation adjusted by n − 1.
The standard error of the sample means when the standard deviation of the population is unknown equals s / √n, where s = sample standard deviation.
The probability that a parameter lies within a range of estimated values is given by α.
Explanation
The probability that a parameter lies within a range of estimated values is given by 1 − α. The standard error of the sample means when the standard deviation of the population is known equals σ / √n, where σ = population standard deviation.
References
Question From: Session 3 > Reading 11 > LOS h Related Material:
Key Concepts by LOS
The continuously compounded rate of return that will generate a one-year holding period return of -6.5% is closest to:
✗ C)
Question #81 of 193
Question ID: 710143✓ A) ✗ B) ✗ C)
Question #82 of 193
Question ID: 413182✗ A) ✓ B) ✗ C)
-6.3%.
Explanation
Continuously compounded rate of return = ln(1 − 0.065) = -6.72%.
References
Question From: Session 3 > Reading 10 > LOS p
Related Material: Key Concepts by LOS
A stock price decreases in one period and then increases by an equal amount in the next period. The investor calculates a holding period return for each period and calculates their arithmetic mean. The investor also calculates the continuously compounded rate of return for each period and calculates the arithmetic mean of these. Which of the arithmetic means will be greater?
The mean of the holding period returns.
The mean of the continuously compounded returns. Neither, because both will equal zero.
Explanation
The holding period returns will have a positive arithmetic mean. For example, a fall from 100 to 90 is a decrease of 10%, but a rise from 90 to 100 is an increase of 11.1%.
The continuously compounded returns will have an arithmetic mean of zero. Using the same example values, ln(90/100) = -10.54% and ln(100/90) = 10.54%.
References
Question From: Session 3 > Reading 10 > LOS p Related Material:
Key Concepts by LOS
In a multivariate normal distribution, a correlation tells the:
overall relationship between all the variables.
Question #83 of 193
Question ID: 413205✗ A) ✗ B) ✓ C)
Question #84 of 193
Question ID: 413152✗ A) ✓ B) Explanation
This is true by definition. The correlation only applies to two variables at a time.
References
Question From: Session 3 > Reading 10 > LOS k Related Material:
Key Concepts by LOS
The annual rainfall amount in Yucutat, Alaska, is normally distributed with a mean of 150 inches and a standard deviation of 20 inches. The 90% confidence interval for the annual rainfall in Yucutat is closest to:
137 to 163 inches. 110 to 190 inches. 117 to 183 inches.
Explanation
The 90% confidence interval is µ ± 1.65 standard deviations. 150 − 1.65(20) = 117 and 150 + 1.65(20) = 183.
References
Question From: Session 3 > Reading 10 > LOS m Related Material:
Key Concepts by LOS
A cumulative distribution function for a random variable X is given as follows:
x F(x)
5 0.14
10 0.25
15 0.86
20 1.00
The probability of an outcome less than or equal to 10 is:
✗ C)
Question #85 of 193
Question ID: 413236✓ A) ✗ B) ✗ C)
Question #86 of 193
Question ID: 413170✗ A) ✓ B) ✗ C)
39%.
Explanation
A cumulative distribution function (cdf) gives the probability of an outcome for a random variable less than or equal to a specific value. For the random variable X, the cdf for the outcome 10 is 0.25, which means there is a 25% probability that X will take a value less than or equal to 10.
References
Question From: Session 3 > Reading 10 > LOS d
Related Material: Key Concepts by LOS
From the entire population of McDonald's franchises, an analyst constructs a sample of the monthly sales volume for 20 randomly selected franchises. She calculates the mean sales volume for those 20 franchises to be $400,000. The sampling distribution of the mean is the probability distribution of the:
mean monthly sales volume estimates from all possible samples of 20 observations. mean monthly sales volume estimates from all possible samples.
monthly sales volume for all McDonald's franchises.
Explanation
The sampling distribution of a sample statistic is a probability distribution made up of all possible sample statistics computed from samples of the same size randomly drawn from the same population, along with their associated probabilities.
References
Question From: Session 3 > Reading 11 > LOS a
Related Material: Key Concepts by LOS
A random variable follows a continuous uniform distribution over 27 to 89. What is the probability of an outcome between 34 and 38?
Question #87 of 193
Question ID: 413162✗ A) ✓ B) ✗ C)
Question #88 of 193
Question ID: 413155Explanation
P(34 ≤ X ≤ 38) = (38 − 34) / (89 − 27) = 0.0645
References
Question From: Session 3 > Reading 10 > LOS i Related Material:
Key Concepts by LOS
The Night Raiders, an expansion team in the National Indoor Football League, is having a challenging first season with a current win loss record of 0 and 4. However, the team recently signed four new defensive players and one of the team sponsors (who also happens to hold a CFA charter) calculates the probability of the team winning a game at 0.40. Assuming that whether the team wins a game is independent of whether it wins any other game, the probability that the team will win 6 out of the next 10 games is closest to:
0.350. 0.112. 0.417.
Explanation
Use the formula for a binomial random variable to calculate the answer to this question. We will define "success" as the team winning a game. The formula is:
p(x) = P(X = x) = [number of ways to choose x from n] × p × (1 - p) ,
where [number of ways to choose x from n] = n! / [(n - x)! × x!].
Here, p(x) = P(X = 6) = [10! / (10 − 6)! × 6!] × 0.40 × (1 − 0.40) = 210.0 × 0.00410 × 0.12960 = 0.11159, or approximately 0.112.
To calculate factorial using your financial calculator: On the TI, factorial is [2nd] ¡→ [x!]. On the HP, factorial is [g] → [n!]. To compute 10! on the TI, enter [10] → [2nd] → [x!] = 3,628,800. On the HP, use [10] → [ENTER] → [g] → [n!].
References
Question From: Session 3 > Reading 10 > LOS f Related Material:
Key Concepts by LOS
Possible outcomes for a discrete uniform distribution are the integers 2 to 9 inclusive. What is the probability of an outcome less
x n-x