FIELD SPECTROSCOPY FOR VEGETATION EVALUATION ALONG THE NUTRIENT
AND ELEVATION GRADIENT ABOVE THE TREE LINE IN THE KRKONOŠE
MOUNTAINS NATIONAL PARK
L. Červená*, L. Kupková, R. Suchá
Department of Applied Geoinformatics and Cartography, Faculty of Science, Charles University in Prague, Albertov 6, Prague 2, Czech Republic - (lucie.cervena, lucie.kupkova, renata.sucha)@natur.cuni.cz
Youth Forum
KEY WORDS: field spectroscopy, plant cover, fAPAR, nutrient and elevation gradient, tundra, The Krkonoše Mountains National Park
ABSTRACT:
This paper examines the relations between vegetation spectra measured in the field along the nutrient and elevation gradient in the most valuable parts of The Krkonoše Mountains tundra and selected parameters describing vegetation state and condition (fAPAR, plant cover and average vegetation height). The main goal was to find relations and indices based on spectral measurements that could be used for vegetation evaluation and classification in practice and management. The vegetation parameters and spectral properties were also compared for two datasets – one acquired in July and second in August 2015. The best correlations were obtained for plant cover (R2 above 0.8 for July dataset and above 0.7 for August dataset) and two types of indices – using the wavelengths of red edge, e.g. OSAVI or mND705, and indices for vegetation water content estimates using the wavelengths in shortwave infrared region of the spectra in combination with wavelengths above 800 nm, e. g. NDII. The worst results were found for fAPAR with maximal values of R2 just above 0.4 with the indices using the wavelengths around 700 nm. For vegetation height the results differ between July and August data – R2 around 0.62 in July and only 0.47 in August for vegetation indices using the wavelengths of visible and red edge regions.
* Corresponding author
1. INTRODUCTION
The vegetation above the tree-line in the Krkonoše Mts., Czech Republic (50°N, 15°E, altitude above 1,350 m a. s. l.), is the unique ecosystem, southernmost relict area of the arctic-alpine tundra in Europe (Soukupová et al., 1995). Tundra belongs among the most valuable and also the most vulnerable ecosystem worldwide. Hence, sustainable management and preservation of tundra is important, but it requires comprehensive knowledge about vegetation cover and condition. And this knowledge can be provided by the remote sensing data and methods.
Two approaches to model the vegetation biophysical or biochemical parameters based on the spectral data exist: empirical (statistical methods) and physical (Radiative Transfer Models). Darvishzadeh et al. 2011 compared these two approaches for mapping the grassland leaf area index (LAI).
The empirical models for grass biomass estimation were tested by Mutanga and Skidmore (2004) using the band depth indices and stepwise regression under controlled laboratory conditions. Cho et al. (2007) compared the vegetation indices and partial least square regression (PLSR) for grass biomass estimations based on airborne hyperspectral images (HyMap). Biomass and groundcover were also estimated using the vegetation indices for winter crop fields by Prabhakara et al., 2015. Fensholt et al. (2004) evaluated the relations between MODIS fAPAR and NDVI for semi-arid environment. In Czech Republic the relationships between fAPAR resp. LAI of meadow vegetation
and selected invasive species and their spectral properties (vegetation indices) were examined by Jelének et al. (2014).
Radiative Transfer Models for grassland parameters estimations were evaluated by e. g. Jarocinska et al. (2014) or Darvishzadeh (2008) for heterogeneous grasslands.
For arctic-alpine tundra vegetation parameters estimations no literature references were found. Thus, this paper aims to examine the statistical relations between tundra vegetation spectra measured in the field along the nutrient and elevation gradient in Krkonoše Mts. and selected parameters describing its state and condition (plant cover, average vegetation height and Fraction of Absorbed Photosynthetically Active Radiation – fAPAR). The main goal is to find indices and statistical models based on field spectral measurements that could be used for vegetation evaluation and classification in practice and management. Other aim of this study is to compare two field datasets acquired in different time horizons (July 2015 and August 2015) and relations based on them.
2. DATA AND METHODS 2.1 Field data
Parameters describing the vegetation state and condition (plant cover, average vegetation height and Fraction of Absorbed Photosynthetically Active Radiation – fAPAR) were measured along the nutrient and elevation gradient in the most valuable parts of The Krkonoše Mountains tundra. This gradient was established between Luční bouda hut in the altitude of 1,410 m
The International Archives of the Photogrammetry, Remote Sensing and Spatial Information Sciences, Volume XLI-B6, 2016 XXIII ISPRS Congress, 12–19 July 2016, Prague, Czech Republic
This contribution has been peer-reviewed.
a. s. l., where also the mountain agriculture occurred till the first half of 20th century, and Luční Hora Mountain in the altitude of 1,550 m a. s. l. with no human impact. The nutrient and elevation gradient contains the following vegetation classes: 1) Herbaceous ruderal vegetation (near hut Luční bouda) 2) Species rich growths with high share of dicotyledonous (near the roads)
3) Grasslands with Solidago virgaurea
4) Connected alpine grasslands with dominant Nardus stricta 5) Nardus stricta stands
6) Alpine heathlands (growths of Calluna vulgaris) 7) Mosaic of Calluna vulgaris, lichens and bare land
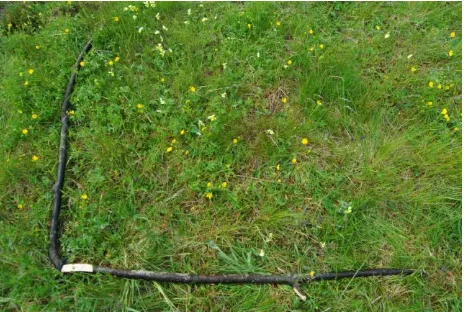
All of the above mentioned parameters together with the reflectance spectra were determined in the field during two campaigns, in July and August 2015. Plots of 1 m x 1 m (Figure 1) were delimited for each vegetation class: 7x12=84 plots in July and 7x4=28 plots in August. The plant cover (in percents) was estimated by botanist. The vegetation height was measured in centimetres at five different places in the plot and afterwards averaged. Fraction of Absorbed Photosynthetically Active Radiation was measured by the instrument AccuPAR LP-80 at three different places in the plot and also averaged. In each plot at evenly distributed spots, five spectra were measured by ASD FieldSpec Wide-Res 4 (350 – 2,500 nm) with fibre optic cable. The radiance spectra were normalized against a 99% Spectralon white reference to produce relative reflectance spectra for each measurement. Afterwards one median spectrum for each plot was calculated.
Figure 1. Example of one plot (1 m x 1 m, class 2: species rich growths with high share of dicotyledonous) for which all the
parameters were determined
2.2 Methods and software
At first, the differences between the classes in the parameters measured in the field were assessed using the Analysis of variance (ANOVA) and Tukey's Honest Significant Difference test (TukeyHSD) separately for July and August datasets. Also the averages and standard deviations were visualised for all classes and both time horizons – see the figure 2.
Secondly, fifty vegetation indices chosen based on the literature review (Thenkabail et al., 2012; Main et al., 2011; le Maire et al., 2004; Hernandez-Clemente et al., 2012; Yi at al., 2014, Zemek et al. 2014) were calculated using the field reflectance spectra. The models using the linear regression between each index and each parameter were built, again separately for July
and August dataset. The models were evaluated using Coefficients of Determination (R2) and p-value.
All the calculations were performed in R software with help of Microsoft Office Excel 2007.
Figure 2. Means and standard deviations of the plant cover, vegetation height and fAPAR measured in July and August
2015 for seven vegetation classes
3. RESULTS
The aim of ANOVA method was to find out if there are significant differences in vegetation parameters (plant cover, average vegetation height and fAPAR) between seven observed vegetation classes. Significant differences between classes were proven for all the parameters in both time horizons. TukeyHSD test revealed that most differences are for plant cover and fAPAR caused by the class 7 which has the lower values of these parameters than most of other classes. This can be explained by the definition of the class 7 which includes bare land and lichens. On the contrary, for vegetation height the majority of differences can be seen between classes located near Luční bouda hut (class 1 in July and class 2 in August) and other classes. These classes are composed of different species of
The International Archives of the Photogrammetry, Remote Sensing and Spatial Information Sciences, Volume XLI-B6, 2016 XXIII ISPRS Congress, 12–19 July 2016, Prague, Czech Republic
This contribution has been peer-reviewed.
plants which can grow higher during the vegetation season. The vegetation height is also the only studied parameter which values differ significantly between July and August. All of these results can be also found in figure 2.
Parameter Plant cover Datt2, SR6, Carter4, PSSRa, PSSRb
indices with
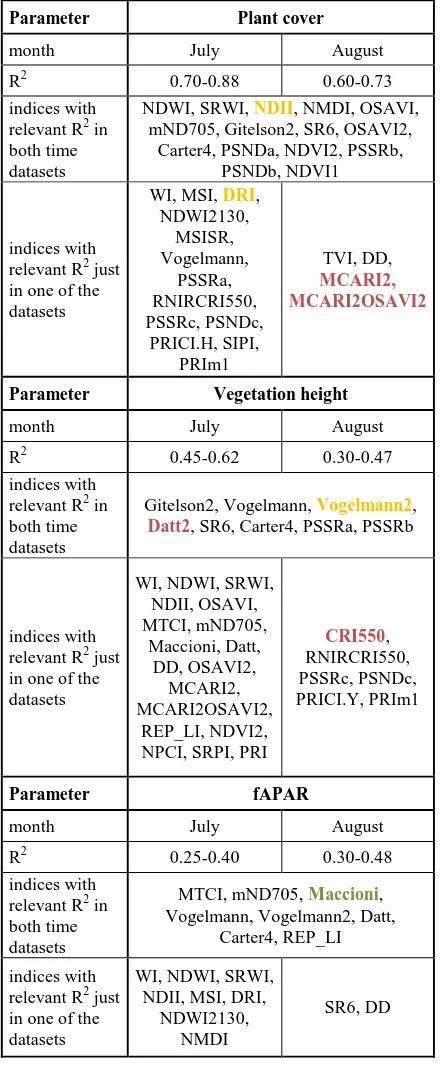
Table 1. The list of the indices for which the highest coefficients of determination (R2) of linear regressions with the
vegetation parameters were achieved. The best results are visualised in colour (yellow for July dataset, red for August dataset and green for both). For the indices formulas refer the literature: Thenkabail et al., 2012; Main et al., 2011; le Maire et
al., 2004; Hernandez-Clemente et al., 2012; Yi at al., 2014, Zemek et al. 2014.
Table 1 summarizes the indices for which the coefficients of determination (R2) of linear regressions with the vegetation parameters were the highest. The selection includes the indices which R2 were no lower than m – 0.2, where m is the maximum value of R2 obtained for the studied parameter.
The predictive equations modeled by the linear regressions show the similar values for both datasets (July and August) in basic types of indices – using the wavelengths of red edge, e.g. OSAVI or modified NDVI at 705 nm (mND705), and indices for vegetation water content estimates using the wavelengths in shortwave infrared region of the spectra (around 2,000 nm) in combination with wavelengths above 800 nm, e. g. NDII. For vegetation height the results differ between July and August datasets – R2 around 0.62 in July and only 0.47 in August for vegetation indices using the wavelengths of visible and red edge regions, e. g. Vogelmann2 and Datt2 (names of the indices based on Main et al., 2011). The worst results were found for fAPAR. Coefficients of determination reached the maximal values of 0.4 for July dataset and 0.48 for August dataset for vegetation index proposed by Maccioni et al. (2001) using the wavelengths around 700 nm.
Comparison of the statistical prediction models for the datasets acquired in July and August confirmed that in the case of the similar values of the studied parameters (fAPAR, vegetation cover) it could be possible to use one model repetitively during the season. On the other hand, in case of even relatively small differences in parameters between the datasets (vegetation height) the prediction equations can be noticeably changed. Of course, these results can be also affected by the different number of plots in datasets (84 plots in July vs. 24 plots in August).
In conclusion, our results proved that all the examined parameters have an influence on the spectra. Various combinations of the parameters together with species composition, soil properties and other additional information obtained in the field will be further examined by multivariate statistical methods. Based on the results in the next step we will extract the information about the selected parameters for the whole tundra area of the Krkonoše Mts. National Park from aerial hyperspectral image data (AISA Dual, APEX).
ACKNOWLEDGEMENT
This research was made possible by the Charles University in Prague project GAUK No. 938214. Our thanks belong also to botanists Stanislav Březina and Jan Šturma for their help during the fieldwork.
REFERENCES
Darvishzadeh, R., Atzberger C., Skidmore, A., Schlerf, M., 2011. Mapping grassland leaf area index with airborne
The International Archives of the Photogrammetry, Remote Sensing and Spatial Information Sciences, Volume XLI-B6, 2016 XXIII ISPRS Congress, 12–19 July 2016, Prague, Czech Republic
This contribution has been peer-reviewed.
hyperspectral imagery: A comparison study of statistical approaches and inversion of radiative transfer models. ISPRS Journal of Photogrammetry and Remote Sensing, 66(6): pp. 894-906.
Fensholt, R., Sandholt, I., Rasmussen, M. S., 2004. Evaluation of MODIS LAI, fAPAR and the relation between fAPAR and NDVI in a semi-arid environment using in situ measurements. Remote Sensing of Environment, 91 (3-4), pp. 490-507.
Hernández-Clemente, R., Navarro-Cerrillo, R. M., Zarco-Tejada, P. J., 2012. Carotenoid content estimation in a heterogeneous conifer forest using narrow-band indices and PROSPECT+DART simulations. Remote Sensing of Environment, 127, pp. 298-315.
Cho, M., A., Skidmore, A., K., Corsi, F., Sobhan, I., 2007. Estimation of green grass/herb biomass from airborne hyperspectral imagery using spectral indices and partial least squares regression. International Journal of Applied Earth Observation and Geoinformation, 9(4), pp. 414-424.
Jarocinska, A., Zagajewski, B., Ochtyra, A., Kupková, L., 2014. Prosail model for reflectance simulations of mountainous non-forest communities. EARSeL eProceedings, Special Issue: 34th EARSeL Symposium, pp. 18-23.
Jelének, J., Kupková, L., Zagajewski, B., Březina, S., Ochytra, A., Marcinkowska, A., 2014. Laboratory and image spectroscopy for evaluating the biophysical state of meadow vegetation in the Krkonoše National Park. Miscellanea Geographica, 18(2), pp. 15-22.
le Maire, G., François, C., Dufrêne, E., 2004. Towards universal broad leaf chlorophyll indices using PROSPECT simulated database and hyperspectral reflectance measurements. Remote Sensing of Environment, 89(1), pp. 1-28.
Maccioni, A., Agati, G., Mazzinghi, P., 2001. New vegetation indices for remote measurement of chlorophylls based on leaf directional reflectance spectra. Journal of Photochemistry and Photobiology, 61 (1–2), pp. 52–61.
Main, R., Cho, M. A., Mathieu, R., O’Kennedy, M. M., Ramoelo, A., Koch, S., 2011. An investigation into robust spectral indices for leaf chlorophyll estimation. ISPRS Journal of Photogrammetry and Remote Sensing, 66(6), pp. 751-761.
Mutanga, O., Skidmore, A., K., 2004. Hyperspectral band depth analysis for a better estimation of grass biomass (Cenchrus ciliaris) measured under controlled laboratory conditions. International Journal of applied Earth Observation and Geoinformation, 5 (2), pp. 87 - 96.
Prabhakara, K., Hively, W., D., McCarty, G., W., 2015. Evaluating the relationship between biomass, percent groundcover and remote sensing indices across six winter cover crop fields in Maryland, United States. International Journal of Applied Earth Observation and Geoinformation, 39, pp. 88-102.
Soukupová, L., Kociánová, M., Jeník, J., Sekyra, J., 1995. Arctic-alpina tundra in the Krkonoše, the Sudetes. Opera Corcontica, 32, pp. 5–88.
Thenkabail, P. S., Lyon, J., Huete, A., 2012. Hyperspectral remote sensing of vegetation. CRC Press, Boca Raton, FL, pp. 782.
Yi, Q., Jiapaer, G., Chen, J., Bao, A., Wang, F., 2014. Different units of measurement of carotenoids estimation in cotton using hyperspectral indices and partial least square regression. ISPRS Journal of Photogrammetry and Remote Sensing, 91, pp. 72-84.
Zemek, F. et al., 2014. Letecký dálkový průzkum Země: teorie a příklady hodnocení terestrických ekosystémů. Centrum výzkumu globální změny AV ČR, Brno, pp. 155.
The International Archives of the Photogrammetry, Remote Sensing and Spatial Information Sciences, Volume XLI-B6, 2016 XXIII ISPRS Congress, 12–19 July 2016, Prague, Czech Republic
This contribution has been peer-reviewed.