Climatic changes in yield index and soil water deficit trends in China
Axel Thomas
Institute of Geography, Johannes Gutenberg University, D 55099 Mainz, Germany
Received 28 July 1999; accepted 10 February 2000
Abstract
Long-term trends of the combined effects of evapotranspiration and precipitation effect surface hydrology and soil water and consequently natural and agricultural ecosystems. This paper analyses yield index and soil water deficit time series derived from water balance calculations for multiple cropping systems with FAO methodology. The analysis shows that yield index values have increased and soil water deficits have consequently decreased over much of China during 1954–1993. The likely parameters contributing to this trend are precipitation changes north of 35◦N and maximum evapotranspiration as well as
available soil water trends south of this line. Increasing the assumed maximum soil water storage did not result in substantially different results. While this analysis indicates that regional climatic change appears to have had a beneficial effect for several regions in China, predictions from combined global climate model climate change experiments anticipate decreasing yields due to decreased water availability by 2050 in the same regions. © 2000 Elsevier Science B.V. All rights reserved.
Keywords:Climate change; Yield index; Potential evapotranspiration; Soil water; Water balance; China
1. Introduction
The warming of the earth’s atmosphere by be-tween about 0.3 and 0.6◦C since the late 19th century (IPCC, 1997) has been established with a fair degree of confidence. Other climatological parameters, such as precipitation, cloudiness and evaporation have been investigated which show strongly varying trends on both global and regional scales. Important as the understanding of the changes of these single parame-ters may be, the response of terrestrial ecosystems to changing climatic conditions will ultimately depend not on a single but on the combined effects of several climatic variables. In this respect, soil water content, which is mainly determined by precipitation, evap-otranspiration and soil characteristics, is one of the most crucial factors in both natural and man-made
E-mail address:[email protected] (A. Thomas)
(agricultural) ecosystems. Climate change is very likely to have a major impact on the hydrological cycle and consequently on the available water re-sources, flood and drought potentials, and agricultural productivity (Evans, 1996).
In agro-ecosystems, the soil water content directly determines the amount of water available to field crops and in turn yields and irrigation requirements. Declining soil water contents and consequently de-clining yields can put agricultural based societies at risk if countermeasures are not put forward in time. Asian countries relying traditionally on the highly water consuming rice crop are especially vulnerable in this respect. China, with the world’s largest pop-ulation, plays a crucial role in any possible emerging world food crisis (Harris, 1996). Studies on changes in agricultural production due to changing climatic conditions over China, based on recorded climate data, have remained inconclusive (Zheng, 1994) or
have used the inappropriate Thornthwaite approach (Thornthwaite, 1948) to calculate evapotranspiration rates (e.g. Chen et al., 1992). Hulme et al. (1992) combined the results of several GCM simulations and predicted a negative net balance of precipitation and evapotranspiration throughout China by the year 2050. Several studies have been made of precipitation changes in China (Chen et al., 1992; Hulme et al., 1994; Yatagai and Yasunari, 1994; Zhai et al., 1997; Domrös and Schäfer, in press). Work on evapotranspi-ration trends is relatively scarce (Kayane, 1971; Chen et al., 1992) and has relied on the Thornthwaite for-mula that is inaccurate in tropical areas (Thornthwaite, 1951). During the last decades (1951–1990), summer precipitation has been mostly decreasing in South-east, Southwest and East China. Most precipitation trends, however, seem to reflect decadal-scale varia-tions rather than long-term trends (Hulme et al., 1994). Penman–Monteith evapotranspiration estimate trends (1954–1993) have shown to be declining in almost all seasons with some regional exceptions (Thomas, in press). The strongest seasonal changes have been found in summer with mainly negative trends in North-west and Central China and slightly positive trends in Southwest and Northeast China. These observed changes would indicate that agricultural production particularly in parts of South and Southwest China
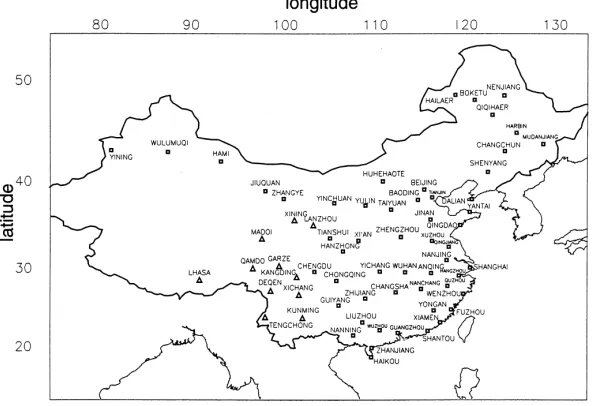
Fig. 1. Stations in the 65 station CDIAC data set. (△) Denote stations above 1500 m a.s.l.
would have to cope with decreasing water availability in the growing season.
This paper presents the results of a study assessing the combined influence of precipitation and evapotran-spiration changes on crop production over China in recent decades. It uses water balance estimations as a tool to determine soil water variations and water avail-ability for crops. It presents trend data, identifies the main contributors to observed changes and discusses their significance for agricultural production in China.
2. Data and analysis procedure
were taken from Domrös and Peng (1988) in order to evaluate the beginning and length of the growing season in more detail.
Of the available data only years of the 40-year period from 1954–1993 have been used as obser-vation methods in China were not standardized until 1951 with the set up of the meteorological observation network of the People’s Republic of China. Penman–Monteith evapotranspiration (EP) estimates were calculated for all months with com-plete records using ET1.0 software distributed by Cranfield University (Hess and Stephens, 1993). The Penman–Monteith method appears to be the most reliable method to estimate evapotranspiration under various climates (Jensen et al., 1990) and is recom-mended by FAO (Smith, 1992a). Aerodynamic resis-tance was estimated according to Smith (1992a) as
ra=208U−1 (1)
whereUis the windspeed measurement at 2 m height. Although the Penman–Monteith approach would eliminate the use of crop coefficients, there is insuffi-cient consolidated information on individual crop re-sistances presently available (Smith, 1992a). A fixed canopy resistance of 70 s m−1 was used throughout and maximum crop evapotranspiration (EM) was con-sequently defined as
EM=EPkC (2)
withkCas the crop coefficient of the respective pheno-logical stage of the crop (Smith, 1992b). MonthlykC values were obtained by first interpolating a smooth crop coefficient curve for each crop from lengths of individual growing stages (Doorenbos and Kassam, 1979) and correspondingkCvalues (Smith, 1992b) us-ing a cubic spline interpolation. After scalus-ing the du-ration of the crop coefficient curve linearly in relation to the calculated growing season of each station (see below), monthlykC values were resampled from the interpolated values. Crop coefficients for fallow peri-ods were set to 0.2 and for winter wheat during winter dormancy to 0.4.
Estimations of the water balance follow the FAO ap-proach (Doorenbos and Pruitt, 1977; Doorenbos and Kassam, 1979; Smith, 1992b) of a simple water budget calculation. This methodology has been used in many country-level studies under various climates around
the world (FAO, 1994, 1996). Monthly soil water val-ues were determined on a running basis beginning with January of the first year of complete data at each station and initial soil water content set to zero. Low soil water contents in January correspond closely to January estimates of the following years as the an-nual soil water minimum is reached during the winter dry season. This calculation procedure allows to mon-itor interannual variations and to calculate trends and is thought to be more meaningful than estimating cli-matic variability with the help of probabilities of ex-ceedance as recommended by FAO (Doorenbos and Pruitt, 1977; Doorenbos and Kassam, 1979; Smith, 1992b).
Monthly soil water values were calculated in the general form of
SW=PE−EA+SW-1 (3)
withSWas the soil water content over the considered soil depth,EA as the actual monthly crop evapotran-spiration andPE as effective monthly precipitation of the current month.SW-1is the soil water left over from the preceding month.PEwas set to 90% of measured precipitation for all months as most agricultural land in China is level or terraced with little surface run-off. If water available to the crop in a given month did not meet the demand of the plant (EM>PE+SW-1),EA
was calculated as
EA =PE+SW-1 (4)
otherwise, EA=EM. No effort was made to include the effects of soil water depletion into estimates of
Smith (1992b) and interpolated to monthly values as described forkC values. Maximum rooting depth for all crops except rice was set to 1.0 m.
Independent of crop development, rooting depth values of rice have been fixed at 0.3 m, the average depth of the impermeable plough sole in rice soils (Frère and Popov, 1979). In order to assess the effects of a larger soil moisture reservoir, a second run with maximum rooting depths of 0.60 m was conducted.
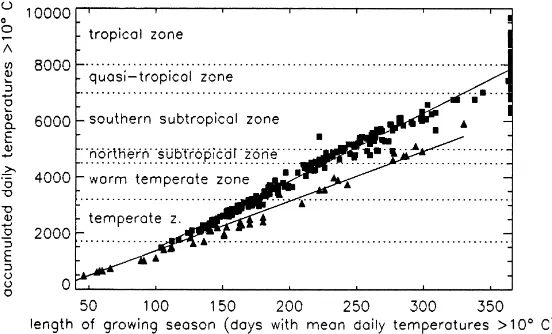
Crop performance and soil water variation are es-timated with the agricultural water balance (AWB). AWB is based on site specific thermal conditions and calculates soil water variations for a crop or combina-tion of crops chosen to represent the typical cropping pattern of that climatic zone withkCvalues set to the interpolated values of the respective months. To calcu-late AWB, the beginning and length of the (thermal) growing season (BGS and LGS, respectively) were de-termined with the help of accumulated temperatures. Accumulated temperatures (mainly with daily temper-atures >10◦C) are widely used by Chinese scientists to characterize thermal growing conditions in China (Zhang, 1959; Zhang and Lin, 1992; Zheng, 1994) and have been correlated to climate zones and crop-ping systems. According to Ren (1985), seven ther-mal zones and their respective cropping systems can be delineated for China (Table 1, Columns 1 and 2).
Accumulated temperatures for each station were de-termined by interpolating mean monthly temperatures to mean daily values using a cubic spline interpolation and summing all interpolated mean daily temperatures >10◦C (Fig. 2). BGS was obtained by determining the
Table 1
Selection of cropping systems according to thermal zones and altitude for water balance calculationsa
Thermal zone Accumulated temperature >10◦C <1500 m a.s.l. ≥1500 m a.s.l.
Harvests Typical cropping Harvests Typical cropping per year (t) system per year (t) system
Frigid temperate <1700 – –
Temperate 1700–≤3200 1 Wheat 1 Maize
Warm temperate 3200–≤4500 1.5 Rice/wheat 1.5 Maize/wheat
North subtropical 4500–≤5000 2 Rice/rice or rice/wheat 1.5 Rice/wheat
South subtropical 5000–≤7000 2.5 Rice/rice/wheat 1.5 Rice/wheat
Quasi-tropical 7000–≤8000 3 Rice/rice/sweet potatoes – –
Tropical >8000 3 Rice/rice/rice – –
aHarvests of 1.5 and 2.5 per year indicate that the harvest takes place in the next calendar year after sowing; source: (Ren, 1985,
Thomas, 1992).
first day with temperatures >10◦C, LGS by rounding degree–day sums to monthly values. BGS values be-longing to the second half of a month were assigned to the following month in order not to overestimate the actual starting date. LGS values were treated similarly. Scatter of LGS values occurs due to the combina-tion of long, warm growing seasons in subtropical climates and short, but hot growing seasons in con-tinental climates. Even within thermal zones LGS values determined from the 279 station data set vary considerably by 30–80 days. An additional compli-cation is introduced through mountain stations above 1500 m a.s.l. These stations, with one exception located in West or Southwest China and Tibet, show different correlations between accumulated temper-atures and BGS/LGS than lowland stations due to progressively lower temperatures at increasing alti-tudes (Fig. 3). For a given accumulated temperature, BGS occurs up to 40 days later at southern subtrop-ical mountain stations in Southwest China compared to lowland stations while LGS increases by up to 50 days. The highest station (Madoi, 4273 m a.s.l.) was excluded from AWB calculations as no growing season was recorded.
Fig. 2. Accumulated daily temperatures above 10◦C based on the 279 station data set. Stations above 1500 m a.s.l. are marked by (△). Boundaries shown correspond to thermal zones listed in Table 1.
for the prolonged nursery period (He, 1981). During the establishment period of rice with plants growing in the nursery, 90% of the cropping area was assumed to lie fallow and 10% planted with rice seedlings.
Results are expressed as the yield index (YI) and the cumulative soil water deficit. In contrast to Doorenbos and Kassam (1979),YIis defined as the percentage to which the cumulative water demand of the crop over the growing season has been met:
Fig. 3. Variation of length of growing season (determined from interpolated daily temperatures above 10◦C from the 279 station data set) vs. station altitude. Solid lines are regression lines for stations below (j) and above (m) 1500 m a.s.l. Definitions for thermal zones are as given in Table 1.
YI= EA
EM ×100 (5)
to different water availability can be explained byYI (Doorenbos and Kassam, 1979).
The cumulative soil water deficit (DSW) over the growing season has been defined as:
DSW=EA−EM (6)
A major part of China’s agricultural areas is irrigated so that, in practice,DSW is controlled and kept to a minimum. In this study, additional water input by ir-rigation has not been taken into account so that YI
is an estimate of cropping performance under rain-fed conditions and DSW closely resembles the sea-sonal irrigation demand for the given cropping system. For cropping systems with more than one crop per growing seasonYIandDSWrepresent estimates of the cumulative performance and irrigation requirements of all crops during that growing season.
Linear regression was performed on annualYIand
DSW values of all stations for the period 1954–1993. For China as a whole (All-China series) mean linear trends were calculated from the unweighted results of all stations. For the interpretation of the signifi-cance of linear trends the trend-to-noise ratio (Birongg and Schönwiese, 1988) and for non-linear trend sig-nals Mann’s Q (Hartung, 1993) were applied. If not, otherwise, noted significant’ trends are significant at
Fig. 4. Regionally averaged yield index (%) from 1954–1993 for 65 stations over China. Straight line shows the linear trend from 1954–1993. The smooth line results from a Gaussian binomial low-pass filter (10 years) that was applied to suppress high-frequency variations in the data.
the 95% level and are given for the 40-year period 1954–1993.
3. Results: observed trends 1954–1993 and contributing variables
3.1. All-China series
The mean linear trend for the country as a whole shows that YI rates have been increasing by 3.0% (Fig. 4) over the last 40 years. Correspondingly,DSW
rates have been decreasing by 36.4 mm (Fig. 5). Also apparent in the time series are large fluctuations with a frequency of about 10 years.YItrend values show a highly significant (≥99%) non-linear trend. Over the observation period,YIs have increased by 4.5% rela-tive to the long-term mean whileDSWs decreased by 13.9%.
3.2. Yield index and soil water deficit trends
Fig. 5. Regionally averaged soil water deficit (mm/growing season) from 1954–1993 for 65 stations over China. Straight line shows the linear trend from 1954–1993. The smooth line results from a Gaussian binomial low-pass filter (10 years) that was applied to suppress high-frequency variations in the data.
Northwest and Northeast China increases have been slight with insignificant trends of around 5%. Con-sequently, over large areas of South and East China,
DSWs have been decreasing to a considerable extent (Fig. 7). Both along the South Chinese coast and in East China DSW positive trends surpass 200 mm, in the major part of East China south of 40◦N stations record aDSWdecrease of at least 40 mm. The highest
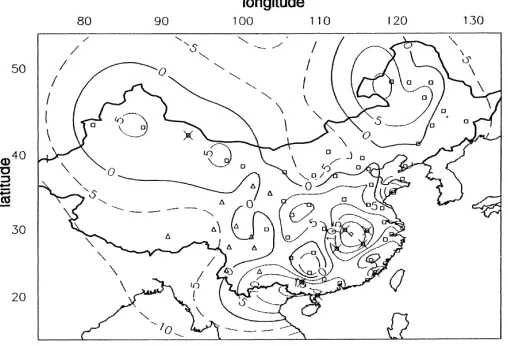
Fig. 6. Yield index trends (%) over China from 1954–1993. Solid lines depict positive trends, broken lines show negative trends. Open symbols mark station locations, station symbols with a cross mark significant non-linear trends.
increase occurred in the Northwest Chinese desert re-gion with 305 mm which however does not show up significantly inYItrends as this amounts to<20% of the annual evapotranspiration total.
Insignificant negative YI trends (≤−18%) are re-stricted to the Yellow Sea region and to North, North-east and South Central China in general not surpassing
Fig. 7. Soil water deficit trends (mm) over China from 1954–1993. Solid lines depict positive trends, broken lines show negative trends. Open symbols mark station locations, station symbols with a cross mark significant non-linear trends.
coastDSWvalues have increased by 152 mm (signifi-cant at the 90% level) over the last four decades.
Setting the maximum rooting depth to 60 cm in rice-based cropping systems did not result in any par-ticular changes. Maximum YI differences amounted to 3% with the majority of trend changes remaining below 0.5% (not shown).
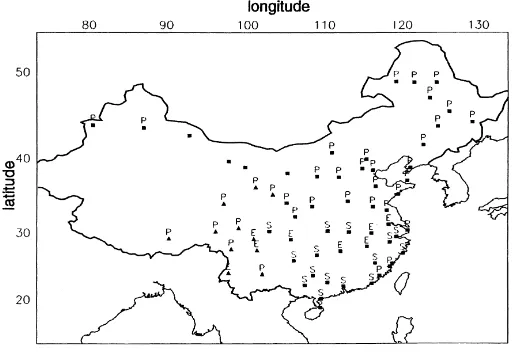
Fig. 8. Contribution of precipitation, maximum evapotranspiration and available soil water over the growing season to yield index rates over China (1954–1993). The first regression coefficient for each station is shown.P,E, andSindicate, respectively, precipitation, maximum evapotranspiration and available soil water. For four stations either no regression coefficients could be determined or the correlation was statistically not significant. (m) Denote stations above 1500 m a.s.l.
3.3. Influence of meteorological variables and soil water on yield index changes
and East China whereEP rates have decreased while precipitation has increased. In order to identify those variables that contribute most to the observed changes in YI a linear stepwise multi variate regression was performed for YI rates with PE, EM and available soil water summed over the growing season as in-dependent variables. Only for one station could no correlations be determined.
All multiple correlation coefficients accounted for more than 90% of the explained variance; 49% of the correlation coefficients of the first regression coeffi-cient were significant at the 99% level; 3% of all cases were not significant at the 95% level.
As expected,PE and soil water are positively cor-related with YI while EM is negatively correlated. Fig. 8 shows a clear zonal arrangement of the most important variables contributing to YI changes. In general, precipitation appears to be most important north of ≈32◦N, followed by evapotranspiration in a small band centered on 30◦N and soil water south of 25◦N and along the southeastern Chinese coast. A doubling of the rooting depth to 60 cm for rice based cropping systems resulted in changes at 8 sta-tions (13%) located mainly in South and East China (not shown). In five cases, precipitation or evapotran-spiration replaced soil water as the most important variable, in two cases, soil water became the most important variable.
4. Discussion
Based on water balance calculations with monthly precipitation data and Penman–Monteith evapotran-spiration estimates yield index rates (1954–1993) were found to have increased by up to 23.5% over a large part of China with statistically insignificant decreases of 18% restricted to the Yellow Sea region. In the ma-jor part of West China (east of 105◦E), no significant changes in yield index rates have occurred. In terms of actual soil water changes water deficits over the growing season have decreased by up to 300 mm over the major part of South, East and West China with only few localized upward trends of about 100 mm in South and East China.
For China as a whole, no single factor can be pointed out as leading to changed yield index estimates during the recent decades. Instead regional differences can
be traced chiefly to seasonal courses of precipitation and evapotranspiration in different climates of China combined with the spatial pattern of precipitation and evapotranspiration trends.
In northern China, the beginning and length of the single crop growing season and the rainy season are well correlated. With high evapotranspiration rates precipitation is always the limiting factor and the most important variable regulating yield index changes.
South of 35◦N precipitation and cloudiness in-crease rapidly due to the influence of summer mon-soon frontal systems over East China (Domrös and Peng, 1988). Thermal conditions begin, however, to allow double cropping systems south of this climatic dividing line. With the length of the double cropping growing season extending beyond the rainy season pre and post rainy season evapotranspiration becomes the most important factor determining yield index rates. Evapotranspiration trends in this region are obviously linked to changes in sunshine duration (Thomas, in press) thought to be caused by variations of the strength of the summer monsoon and the associated cloudiness (Kaiser and Vose, 1997). The diminishing influence of precipitation with decreasing latitude is also reflected in the growing importance of stored soil water, that increasingly contributes to the water supply outside the rainy season. As surface hydrol-ogy and soil moisture feedback are thought to have important impact on the northward progression of the Indian monsoon (Webster, 1983), a similar process might influence Chinese summer monsoon dynamics. South of≈25◦N triple cropping becomes feasible in East China. During the rainy season the contri-bution of stored soil water in relation to monthly precipitation is small. Despite the large precipitation surpluses during the rainy season soil water storage, as assumed here, is however, not fully capable of supporting crop evapotranspiration during the winter months with mean 1954–1993 yield index rates in this zone reaching only 70%. This emphasizes the importance of the contribution of stored soil water to the water balance in the quasi-tropical and tropical zone when the growing season extends considerably beyond the rainy season.
soil water were doubled for rice-based cropping sys-tems. In five cases, the response matched the expected change towards a diminished importance of soil wa-ter. Different results were obtained in a case study in Bangladesh (Frère and Popov, 1979) where the yield index calculated for paddy with a rooting depth of 60 cm did not show any water stress while restricting the rooting depth values to 30 cm reduced yield in-dex by up to 20%. Even under generally similar cli-matic conditions increased soil water storage capacity does obviously not lead in any case to an increased yield index; but has to be assessed individually based on the local precipitation, evapotranspiration and soil data.
Results of several combined GCM simulations (Hulme et al., 1992) predicted a larger area for rice based cropping systems in East China by the year 2050, but with mean yields decreasing due to decre-ased water availability. Wheat bdecre-ased double cropping systems should be even more affected. The general ability of current GCM simulations to predict regional climatic change for resource assessment studies has, however, been seriously challenged (Grotch, 1989, 1992) while Evans (1996) noted that precipitation out-puts from GCMs particularly will remain speculative and should not be used in detailed water resources planning. Kim et al. (1998) did, however, report good agreement of observed precipitation records with short term simulations of precipitation and soil mois-ture over East Asia with the Regional Climate System Model.
5. Conclusions
Results presented here indicate that water supply situation has generally improved over the last 40 years, particularly in the important agricultural centers of East and South China. Yield index rates, on average at about 70–80%, have increased by 5–10%. Irrigation demand (as determined by the soil water deficit) has decreased by more than 100–200 mm in this region. In Northeast China, the situation should have wors-ened to some extent as the assumed irrigation demand has increased by up to 100 mm to about 150–350 mm. Yield index decreases have however remained slight at about 5%. The largest decrease in water demand of more than 300 mm recorded in Northwest China is
actually small in relation to the actual water demand and is based on the results of only one station.
Regional climatic change appears to have had a ben-eficial effect for several regions in China that have to cope with an increased demand on water resources by a growing population and industry as well as an in-tensified agriculture. Whether this trend will continue is an open question as simple trend analysis results should not be extrapolated without additional analysis into the stability of the trends.
Results of climate model simulations have failed so far to capture the magnitude and distribution of climatic variables necessary for water resources plan-ning. Further analysis of observed water balance trends with an increased station density and detailed soil parameters should be useful for providing detailed results against which Regional Climate Models can be calibrated.
Acknowledgements
The author thanks Dale Kaiser, CDIAC, for supply-ing the updated data package and for further assistance and Tim Hess, Cranfield University, for assistance with the software package ET. This work was financed by the Deutsche Forschungsgemeinschaft (DFG).
References
Birongg, K., Schönwiese, E., 1988. Statistische Untersuchungen europäischer Niederschlagsvariationen in Zusammenhang mit Atmosphärischen Zirkulationsparametern. Meteorologische Rundschau 41, 53–62 (in German).
Chen, Y., Wang, S., Zhang, H., Min, J. (Eds.), 1992. Qi Hou Bian Hua Dui Nong Ye Ying Xiang Ji Qi Dui Ce (The Influence of Climatic Variation on Agriculture and Strategic Countermeasures). Chinese Meteorological Press, Beijing, 374 pp. (in Chinese).
Domrös, M., Peng, G., 1988. The Climate of China. Springer, Berlin, 360 pp.
Domrös, M., Schäfer, D. Recent climatic changes in High and Central Asia. In: Proceedings of International UNESCO Symposium on Environmental Changes in High Asia, 29 May–1 June 1997, Marburg, Germany, in press.
Doorenbos, J., Kassam, A.H., 1979. Yield response to water. FAO irrigation and drainage paper 33. Land and Water Development Division. FAO, Rome.
Evans, T.E., 1996. The effects of changes in the world hydrological cycle on availability of water resources. In: Bazzaz, F., Sombroek, W. (Eds.), Global Climate Change and Agricultural Production. Wiley, Chichester, 248 pp.
FAO, 1991. Digitized soil map of the world, Vol. 6. Near and Far East. FAO, Rome.
FAO, 1994. AEZ in Asia. World soil resources report 75. FAO, Rome.
FAO, 1996. Agro-ecological zoning. Guidelines. FAO soils bulletin 73. FAO, Rome.
Frère, M., Popov, G.F., 1979. Agrometeorological crop monitoring and forecasting. FAO plant protection and production paper 17. FAO, Rome.
Grotch, S.L., 1989. A statistical intercomparison of temperature and precipitation predicted by four General Circulation Models. In: Proceedings of DOE Workshop on Greenhouse-Gas Induced Climate Change. US Dept. of Energy, Univ. Mass., May 1989. Grotch, S.L., 1992. Regional intercomparisons of General Circulation Model Predictions and Historical Climate Data. US Dept. of Energy Global Change Research Program Technical Report 041.
Harris, J.M., 1996. World agricultural futures: regional sustainability and ecological limits. Ecol. Econ. 17, 95–115. Hartung, J., 1993. Statistik: Lehr- und Handbuch der Angewandten
Statistik. Oldenbourg, Munich, 484 pp. (in German). He, W., 1981. Agricultural Geography of Yunnan Province. Yunnan
People’s Press, Kunming, 191 pp. (in Chinese).
Henderson-Sellers, A., 1996. Soil moisture: a critical focus for global change studies. Glob. Plan. Change 13, 3–9.
Hess, T., Stephens, W., 1993. The Penman Equation. In: Noble, D.H., Courte, C.P. (Eds.), Spreadsheets in Agriculture. Longman, London, pp. 184–194.
Hulme, M., Ding, Y., Jiang, T., Leemans, R., Markham, A., Wang, F., Wigley, T., Zhao, Z.-C., 1992. Climate Change due to the Greenhouse Effect and its Implications for China. WWF, Gland, Switzerland. 57 pp.
Hulme, M., Zhao, Z.C., Jiang, T., 1994. Recent and future climate change in East Asia. Int. J. Clim. 14, 637–658.
IPCC, 1997. Intergovernmental panel on climate change. Second Assessment Climate Change 1995. UNEP/WMO, 63 pp. Jensen, M.E., Burman, R.D., Allen, R.G., 1990. Evaporation
and Irrigation Water Requirements. American Society of Civil Engineering Manual No. 70.
Kaiser, D.P., Vose, R.S., 1997. Changes in mean monthly cloud amount over China: a closer look. In: Proceedings of the Eighth Symposium on Global Change Studies, 2–7 February. Long Beach, CA. Am. Meteor. Soc., Boston, pp. 92–97.
Kayane, I., 1971. Hydrological regions in Monsoon Asia. In: Yoshino, M.M. (Ed.), Water Balance of Monsoon Asia. University of Hawaii Press, Honolulu, pp. 287–300.
Kim, J., Miller, N.L., Oh, J., Chung, J., Rha, D., 1998. Eastern Asian hydrometeorology simulation using the Regional Climate System Model. Glob. Plan. Change 19, 227–242.
Li, C., Liu, D., 1988, Response of dry-matter production and partitioning in the aerial part of rice grown at different altitude localities to basal dressing with nitrogen fertilizer. Acta Botanica Yunnanica 10 (3), 305–309 (in Chinese with English abstract).
Ren, M., 1985. An Outline of China’s Physical Geography. Foreign Languages Press, Beijing, 471 pp.
Smith, M., 1992a. Expert consultation on revision of FAO methodologies for crop water requirements. Land and Water Development Division. FAO, Rome.
Smith, M., 1992b. CROPWAT: a computer program for irrigation planning and managment. FAO Irrigation and Drainage paper 46. FAO, Rome.
Tao, S., Fu, C., Zeng, Z., Zhang, Q., 1991. Two Long-Term Instrumental Climatic Data Bases of the People’s Republic of China. ORNL/CDIAC-47, NDP039. Carbon Dioxide Information Analysis Center, Oak Ridge National Laboratory, Tennessee, 83 pp.
Thomas, A., 1992. Agricultural water balance of Yunnan Province, PR China: agroclimatic zoning with a Geographical Information System. Agric. Water Manage. 21, 249–263.
Thomas, A. Spatial and temporal characteristics of evapotranspiration trends over China. Int. J. Clim, in press. Thornthwaite, C.W., 1948. An approach towards a rational
classification of climate. Geogr. Rev. 38, 55–94.
Thornthwaite, C.W., 1951. The water balance in tropical climates. Bull. Am. Met. Soc. 32, 166–173.
Webster, P.J., 1983. Mechanisms of monsoon low frequency variability: surface hydrological effects. J. Atmos. Sci. 40, 2110–2124.
Yatagai, A., Yasunari, T., 1994. Trends and decadal-scale fluctuations of surface air temperature and precipitation over China and Mongolia during the recent year period (1951–1990). J. Met. Soc. Jpn. 72, 937–957.
Zhai, P.M., Ren, F., Zhang, Q., 1997. Indicators of change for extreme precipitation in China. In: Proceedings of the Workshop on Indices and Indicators for Climate Extremes, 3–6 June 1997. Asheville, NC, pp. 1–5.
Zhang, B., 1959. Climate Classification in China. Science Press, Beijing, 323 pp. (in Chinese).
Zhang, J., Lin, B., 1992. Climate of China. Wiley, Chichester, 363 pp.