SPECTRAL MATCHING THROUGH DATA COMPRESSION
D. Cerra∗, J. Bieniarz, J. Avbelj, P. Reinartz, and R. Mueller
German Aerospace Center (DLR) Earth Observation Center (EOC) Muenchner str. 20, 82234 Wessling, Germany
KEY WORDS:Spectral distance, similarity measure, data compression
ABSTRACT:
This paper proposes to use compression-based similarity measures to cluster spectral signatures on the basis of their similarities. Such universal distances estimate the shared information between two objects by comparing their compression factors, which can be obtained by any standard compressor. Experiments on spectra, both collected in the field and selected from a hyperspectral scene, show that these methods may outperform traditional choices for spectral distances based on vector processing such as Spectral Angle, Spectral Information Divergence, Spectral Correlation, and Euclidean Distance.
1 INTRODUCTION
The processing of hyperspectral images for detection and clas-sification purposes often relies on estimating the similarities be-tween spectra, represented by vectors composed of the values in each image element (or pixel) across all the spectral bands. Spec-tral matching has at its core the use of a distance measure as a mean to quantify the distance between any pair of such spectra. Among the adopted measures, often having their origins in vector processing, popular choices are the Euclidean distance (ED), the Spectral Angle (SA) (F.A. Kruse, 1993), the Spectral Correlation (SC) (De Carvalho and Meneses, 2000), and the Spectral Infor-mation Divergence (SID) (Du et al., 2004). The performances of these spectral distances have been compared in (Robila and Ger-shman, 2005) and (Van der Meer, 2006), with both works agree-ing on consideragree-ing SID as a slightly more discriminative distance among the mentioned ones.
This paper proposes to use compression-based similarity mea-sures as a valid alternative to quantify the similarity between spectral signatures. These measures employ general off-the-shelf compressors in an unusual way, by exploiting them to estimate the amount of information shared by two objects. They can be employed for clustering and classification on diverse data types, outperforming general distance measures (Keogh et al., 2004). Experiments on satellite images using these techniques have been presented in (Cerra et al., 2010).
To assess the quality of the distances obtained with the proposed method we perform an unsupervised hierarchical clustering with all the distances mentioned above on two sets of spectral signa-tures: one collected on the field and related to different kinds of rocks, and another related to different roofs materials and selected from a hyperspectral scene acquired by the satellite HyMAP. Re-sults suggest that compression-based methods could outperform traditional similarity measures employed in spectral matching at capturing similarities between the spectra which could be not ob-vious at a first inspection.
The work is structured as follows. Section 2 introduces the pro-posed Normalized Compression Distance (NCD), while Section 3 presents a brief reminder on well-known spectral distances. Sec-tion 4 reports experiments on rocks and roofs categorizaSec-tion. We conclude in Section 5.
∗Corresponding author. Email: [email protected].
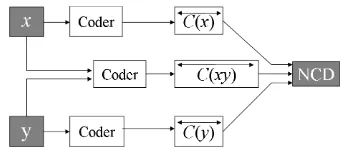
Figure 1: Computation of a distance between two general objects xandyby means of a standard compressorC. The sizes of the objects compressed separately and jointly are compared, yielding a distance ranging from 0 to 1.
2 NORMALIZED COMPRESSION DISTANCE
The most widely known and used compression based similarity measure for general data is the Normalized Compression Dis-tance (NCD). The NCD derives from the notion of the Kolmogorov complexityK(x)of an objectx, which quantifies how difficult it is to compute or describex(Kolmogorov, 1968). The quantity K(x)is incomputable in se, but can be approximated by com-pression algorithms and on its basis the NCD is defined for any two objectsxandyas:
N CD(x, y) = C(x, y)−min{C(x), C(y)}
max{C(x), C(y)} , (1)
whereC(x)represents the size ofxafter being compressed by a general off-the-shelf compressor (such as Gzip), andC(x, y)is the size of the compressed version ofxappended toy(Fig. 1). The NCD ranges approximately from 0 to 1, representing max-imum and minmax-imum similarity, respectively. The idea is that if xandyshare common information they will compress better to-gether than separately, as the compressor will be able to reuse recurring patterns found in one of them to more efficiently com-press the other. One of the main advantages of such distance is its parameter-free approach, which makes it applicable to di-verse data types (Cilibrasi and Vit´anyi, 2005), as the NCD only depends on the compressor adopted and its internal parameters. Anyway performance comparisons for general compression al-gorithms have shown this dependance to be loose (Cebrian et al., 2005). Furthermore, this distance has been shown to be resistant to noise (Cebrian et al., 2007). To compute the NCD between two spectra, a compressor belonging to the lz-family (Ziv and Lem-pel, 1978) has been applied to the spectra converted into ASCII
International Archives of the Photogrammetry, Remote Sensing and Spatial Information Sciences, Volume XXXVIII-4/W19, 2011 ISPRS Hannover 2011 Workshop, 14-17 June 2011, Hannover, Germany
text files.
3 SPECTRAL DISTANCES
In all the following definitions, unless otherwise stated,xand yare assumed to ben-dimensional vectors representing spectra, withnbeing the number of bands in each spectrum.
3.1 Euclidean Distance
The Euclidean Distance (ED) quantifies the distance between two vectorsxandyas:
As simple as it may be, this distance often gives the best results in several data mining problems (Keogh et al., 2004).
3.2 Spectral Angle
The Spectral Angle (SA) measures the angle between two vec-tors representing two spectra, and is a widely used distance in spectral matching for its partial independence from illumination conditions. It is defined forxandyas the arccosine of the dot-product between the two vectors (Kruse et al., 1993):
SA(x, y) = cos−1
We compute the Spectral Correlation (SC) between two spectrax andyas: the standard deviations ofxandy(De Carvalho and Meneses, 2000).
3.4 Spectral Information Divergence
The spectral information divergence (SID) (Du et al., 2004) de-rives from information theory notions. If we consider two spectra xandyas two probability distributionspx(i)andpy(i), the SID is given by the Kullback-Leibler divergence, or relative entropy (Kullback and Leibler, 1951), betweenpx(i)andpy(i):
We tested the discriminative power of the previously introduced distances on a set of spectral signatures, chosen from different materials divided into some categories.
4.1 Rocks Categorization
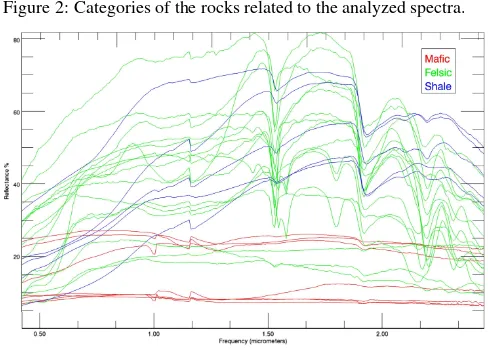
For this experiments we selected randomly a set of 41 spectra from the ASTER 2.0 spectral library (Baldridge et al., 2009), categorized as in Fig. 2. Being the spectral range not constant across all the spectra, each spectrum has been resampled to the 244 bands of the future EnMAP mission’s sensor (Mueller et al., 2010), spanning the interval 0.42-2.45µm, as described in (Van der Meer et al., 2001). The dataset looks a difficult one at first sight, as in some occasions the spectra exhibit similar be-haviour or overlap (Fig. 3).
Figure 2: Categories of the rocks related to the analyzed spectra.
Figure 3: The 41 spectra analyzed, belonging to three classes of rocks.
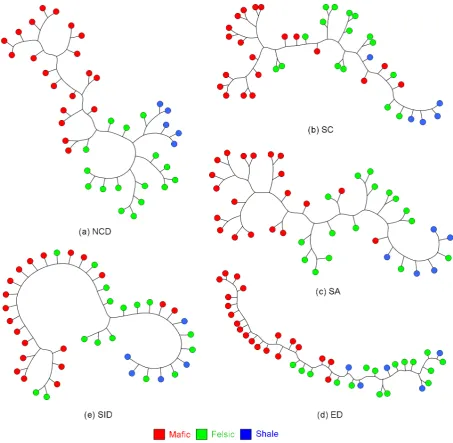
We computed a distance matrix related to the 41 spectra accord-ing to all the introduced distances. Then, we performed on each distance matrix an unsupervised hierarchical clustering, by deriv-ing a dendrogram (binary tree) which represents the matrix in 2 dimensions, as described in (Cilibrasi and Vit´anyi, 2005). Results are reported in Fig. 4. Each leaf represents a spectrum, with the spectra which behave more similarly appearing as siblings. The evaluation is done by visually inspecting if spectra belonging to the same class are correctly clustered in some branch of the tree, i.e. by checking how much each class can be isolated by ”cutting” the tree at convenient points. The NCD is the only method yield-ing a good separation between the clusters, with the exception of the acceptable results obtained by the SA. It is surprising how the SID, which outperforms other distances in (Robila and Gersh-man, 2005) and (Van der Meer, 2006), results in a quite confused dendrogram. For the NCD the values have been first quantized in bytes to provide a meaningful data representation to the compres-sor used (Keogh et al., 2004). We also tested the other distances on the quantized data, but this resulted in even worse results. This suggests that the NCD could be able to capture information inside the spectra which does not result obvious.
International Archives of the Photogrammetry, Remote Sensing and Spatial Information Sciences, Volume XXXVIII-4/W19, 2011 ISPRS Hannover 2011 Workshop, 14-17 June 2011, Hannover, Germany
Figure 4: Hierarchical clusterings for the dataset in Fig. 3, with each node in the tree representing an object, color-coded as in the reported legend. From top-left in clockwise order: results for NCD, SC, SA, ED, and SID distances.
4.2 Roofs Categorization
A second experiment has been carried out on the spectral signa-tures related to a set of homogeneous areas in an image captured by the airborne HyMAP sensor over Munich, Germany. Each area is represented by the average value of the pixels it contains, each of which has 126 spectral bands, spanning the wavelenght interval 0.45-2.5µm, and 5 metres spatial resolution. The pixels have been manually selected from a set of HyMAP scenes and belong to roofs composed of different materials (Heldens, 2010), and are shown in Fig. 5. Sometimes these pixels are not pure: for example roofs covered by vegetation result mixed with the un-derlying materials. The hierarchical clusterings reported in Fig. 6 has been derived as in the previous experiment for the NCD and the SA distances. In this case both clusterings present some confusion, as not every class has its elements correctly placed in an isolated cluster. No method is yielding a clear better perfor-mance: nevertheless, in the SA clustering a pixel belonging to a zinc roof is placed very far away from the other two, while for the NCD the misplaced objects are closer to their correct clusters.
5 CONCLUSIONS
In this paper we proposed to use a general similarity measure based on data compression, the Normalized Compression Dis-tance (NCD), to categorize spectra belonging to different kinds of rocks. Being the spectra extracted from different materials, the task looks quite demanding (Figs. 2 and 3). An unsupervised hierarchical clustering, carried out on the basis of the NCD dis-tances between the spectra, resulted in a better performance with respect to traditional distances used in spectral matching. The spectra have been analyzed in a spectral range characteristic of many hyperspectral sensors such as AVIRIS, HyMAP, EnMAP, and Hyperion. The proposed technique could be then success-fully employed to characterize the contents of a scene acquired by such sensors.
ACKNOWLEDGEMENTS
The authors would like to thank Wieke Heldens at Julius-Maximilians-Universitaet Wrzburg for providing the roofs dataset.
International Archives of the Photogrammetry, Remote Sensing and Spatial Information Sciences, Volume XXXVIII-4/W19, 2011 ISPRS Hannover 2011 Workshop, 14-17 June 2011, Hannover, Germany
Figure 5: The 27 spectra analyzed, belonging to roofs composed of 9 materials.
REFERENCES
Baldridge, A. M., Hook, S. J., Grove, C. I. and Rivera, G., 2009. The aster spectral library version 2.0. Remote Sensing of Envi-ronment 113(4), pp. 711–715.
Cebrian, M., Alfonseca, M. and Ortega, A., 2005. Common pit-falls using the normalized compression distance: What to watch out for in a compressor. Communications in Information and Systems 5(4), pp. 367–384.
Cebrian, M., Alfonseca, M. and Ortega, A., 2007. The normal-ized compression distance is resistant to noise. IEEE Transac-tions on Information Theory 53(5), pp. 1895–1900.
Cerra, D., Mallet, A., Gueguen, L. and Datcu, M., 2010. Algo-rithmic Information Theory-Based Analysis of Earth Observation Images: An Assessment. IEEE Geoscience and Remote Sensing Letters 7(1), pp. 8–12.
Cilibrasi, R. and Vit´anyi, P. M. B., 2005. Clustering by compres-sion. IEEE Transactions on Information Theory 51(4), pp. 1523– 1545.
De Carvalho, O. and Meneses, P., 2000. Spectral Correlation Mapper (SCM): An Improvement on the Spectral Angle Mapper (SAM). In: NASA JPL AVIRIS Workshop.
Du, H., Chang, C., Ren, H., Chang, C., Jensen, J. and D’Amico, F., 2004. New hyperspectral discrimination measure for spectral characterization. Optical Engineering 43(8), pp. 1777–1786.
F.A. Kruse, e. a., 1993. The Spectral Image Processing System (SIPS) - Interactive Visualization and Analysis of Imaging Spec-trometer Data. Remote Sensing of Environment 44, pp. 145–163.
Heldens, W., 2010. Use of Airborne Hyperspectral Data and Height Information to Support Urban Micro Climate Characteri-sation. Julius-Maximilians-Universitaet Wuerzburg.
Keogh, E., Lonardi, S. and Ratanamahatana, C., 2004. Towards parameter-free data mining. In: Proceedings of the tenth ACM SIGKDD international conference on Knowledge discovery and data mining, ACM, p. 215.
Kolmogorov, A. N., 1968. Three approaches to the quantita-tive definition of information. International Journal of Computer Mathematics 2(1), pp. 157–168.
Kruse, F. A., Lefkoff, A. B., Boardman, J. B., Heidebrecht, K. B., , Shapiro, A. T., Barloon, P. J. and Goetz, A. F. H., 1993. The Spectral Image Processing System (SIPS) - Interactive Visualiza-tion and Analysis of Imaging Spectrometer Data. Remote Sens-ing of Environment 44, pp. 145–163.
Figure 6: Hierarchical clusterings for 27 pixels collected on roofs of 9 different materials. Results for NCD and Spectral Angle distances.
Kullback, S. and Leibler, R., 1951. On information and suffi-ciency. The Annals of Mathematical Statistics 22(1), pp. 79–86.
Mueller, R., Bachmann, M., Makasy, C., de Miguel, A., Mueller, A., Neumann, A., Palubinskas, G., Richter, R., Schneider, M., Storch, T., Walzel, T., Kaufmann, H., Guanter, L., Segl, K., T.Heege and V.Kiselev, 2010. The processing chain and cal/val operations of the future hyperspectral satellite mission enmap. In: IEEE Aerospace Conference.
Robila, S. and Gershman, A., 2005. Spectral matching accuracy in processing hyperspectral data. In: Signals, Circuits and Sys-tems, 2005. ISSCS 2005. International Symposium on, Vol. 1, pp. 163–166.
Van der Meer, F., 2006. The effectiveness of spectral similar-ity measures for the analysis of hyperspectral imagery. Interna-tional journal of applied earth observation and geoinformation 8(1), pp. 3–17.
Van der Meer, F., De Jong, S. and Bakker, W., 2001. Imag-ing spectrometry: basic principles and prospective applications, Chapter 2. Kluwer Academic Publishers.
Ziv, J. and Lempel, A., 1978. Compression of individual se-quences via variable-rate coding. IEEE Transactions on Infor-mation Theory 24(5), pp. 530–536.
International Archives of the Photogrammetry, Remote Sensing and Spatial Information Sciences, Volume XXXVIII-4/W19, 2011 ISPRS Hannover 2011 Workshop, 14-17 June 2011, Hannover, Germany