SYNTHETIC APERTURE RADAR (SAR) AND OPTICAL IMAGERY DATA FUSION:
CROP YIELD ANALYSIS IN SOUTHEAST ASIA
S. M. Parksa
a Exelis Visual Information Solutions, 4990 Pearl East Circle, Boulder, Colorado, 80304
Working Group VII/6
KEY WORDS: Remote Sensing, SAR, Radar, Data Fusion, LandSAT ETM+, ENVISAT ASAR, ENVI, SARscape
ABSTRACT:
With the expanding energy crisis and rising food prices, crop yield analysis in Southeast Asia is an increasingly important topic in this region. Rice is the most important food crop in Southeast Asia and the ability to accurately predict crop yields during a growing season is useful for decision-makers, aid providers, and commercial trade organizations. The use of optical satellite image data by itself is difficult due to the almost constant cloud in many parts of Southeast Asia. However, Synthetic Aperture Radar (SAR), or SAR data, which can image the Earth’s surface through cloud cover, is suitable for many agricultural purposes, such as the detection of rice fields, and the identification of different crop species. Crop yield analysis is difficult in this region due to many factors. Rice cropping systems are often characterized by the type of rice planted, the size of rice field, the sowing dates for different fields, different types of rice cropping systems from one area to another, as well as cultural practices such as sowing and transplanting. This paper will discuss the use of SAR data fused with optical imagery to improve the ability to perform crop yield analysis on rice crops in Southeast Asia.
1. INTRODUCTION
Food source security is a major concern, particularly in Asia, due to the rapid population expansion happening in that region. Accurate evaluations of food crops can be difficult in many countries due to the lack of information available regarding yields. The regular usage of optical satellite image data for crop yield analysis is difficult due to the almost constant cloud in many parts of Southeast Asia. However, SAR data, which can image the Earth’s surface through cloud cover, is suitable for many agricultural purposes, such as the detection of rice fields, and the identification of different crop species. Crop yield analysis is difficult in this region due to many factors. Rice cropping systems are often characterized by the type of rice planted, the size of rice field, the sowing dates for different fields, different types of rice cropping systems from one area to another, as well as cultural practices such as sowing and transplanting.
Space-borne radar imagery has great potential for the delineation and monitoring of rice crop paddies. SAR images have proven to be suitable for many agricultural remote sensing purposes, for example, detection of agricultural land such as rice fields, and even identification of different crop species is possible using well-timed SAR images (Karjalainen, Kuittinen, Junnikkala, Karvonen, Nguyen, & Tran, 2010). Due to the abundance of cloud coverage in Southeast Asia, SAR data is often a better choice over optical data (Abu Bakar, Shaari, Chuah, & Ewe, 1997).
Multi-temporal and multi-sensor data fusion has also been successfully used to identify irrigated rice fields. Rice is often planted in paddy fields and grows in distinct stages, including germination, emergence, tillering, heading, and maturing (Wang, 2009). Rice backscatter coefficients in SAR imagery display higher temporal variation than other types of land cover (Wang, 2009). Rice in the planting stage
exhibits a lower backscatter coefficient from flooded water because the rice plant is short and sparse, whereas, in the tillering stage, the backscatter coefficient increases rapidly when more tillers emerge and develop into a denser canopy (Wang, 2009). The backscatter coefficient is slightly less in the late heading stage when the leaves start to dry up and mature (Wang, 2009).
It is possible to monitor the rice growth stage during crop yield analysis, by measuring the backscattering coefficient from the plants as a function of time if radar images are acquired at appropriate time intervals during the growing season. Due to the nature of rice growth, there is a rapid increase in biomass during the 30-day vegetative phase for the short growth duration rice, so it is necessary to acquire time series data on a monthly basis in order to capture the changes in backscatter between the beginning of the planting cycle and the end of the reproductive stage (Wang, 2009). Generally, the beginning of a rice season would be identified by a low backscatter in the time series when the field was inundated while the end of the reproductive stage is characterized by a high backscatter (Wang, 2009).
In this study, multi-temporal ENVISAT ASAR APS dual polarization (HH, HV) data from five different dates in 2011 were used to estimate rice crop yields in the Ganges Delta of Bangladesh. This data corresponds to the growing season of Aman rice crops, which typically occurs from July through November.
2. METHODS
Ten ENVISAT ASAR APS datasets (5 HH and 5 HV datasets) in the original ESA format that were acquired over the same track and frame (i.e. same viewing geometry) were used in this example. The ENVISAT ASAR data were
International Archives of the Photogrammetry, Remote Sensing and Spatial Information Sciences, Volume XXXIX-B7, 2012 XXII ISPRS Congress, 25 August – 01 September 2012, Melbourne, Australia
loaded into SARscape in ENVI using the ASAR product standard format reader. The processing of the multi-temporal ASAR APS data involved several steps including:
1. Data import of the original ESA datasets.
2. Data multilooking (number of looks: 1 and 5
6. Data geocoding with radiometric calibration and normalization (using a grid size 25 m to match the resolution of the ASAR data).
These steps roughly consist of image calibration or conversion to the radar backscattering coefficient sigma nought (σo), image registration or geocoding, and image spatial filtering (Nguyen, Armando, Thuy, Young, Trung, & Bouvet, 2009). Image calibration consists of correcting SAR images for incidence angle effect and for replica pulse power variations to derive physical values (Nguyen, Armando, Thuy, Young, Trung, & Bouvet, 2009).
The processed SAR datasets were then fused with Landsat ETM+ scenes from 2011, and ENVI was used to classify the images in order to quantify the area covered by the rice crops.
3. RESULTS
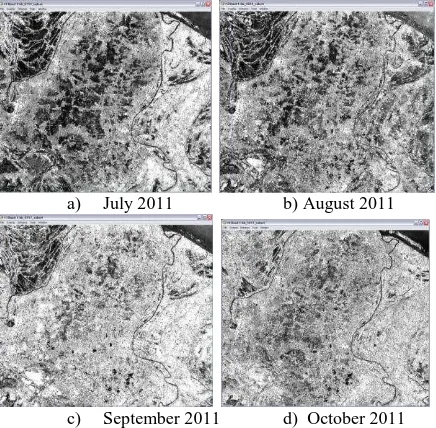
The processed SAR images for each of the dates during the growing season are represented in Figure 1 below. The rice crops are represented by the darker areas at the beginning of the growing season (Figure 1a) as the backscatter coefficient for water is lower. Once the plants emerge from the water, the backscatter coefficient gets higher and these areas become brighter in the images from August through October (Figure 1: b), c) and d)). As the crops mature and are harvested starting in November (Figure 1: e), the areas begin to appear darker again.
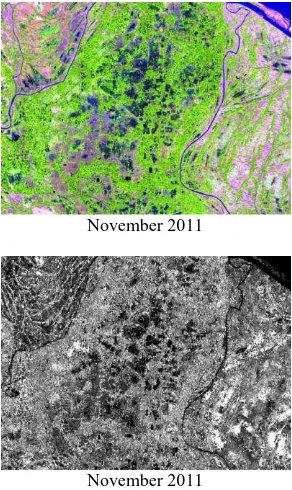
After the ENVISAT ASAR data was processed, SARscape in ENVI was used to produce an RGB color composites using HH and HV bands in order to improve the visualization of the objects in the images. In the series of RGB color composites shown in Figure 2 below, red = (input 1 - input 2) / (input 1 + input 2), green = input 2, and blue = input 1. This type of color composite enhances the differences in the backscatter results of the rice crops during different periods of the growing season. The forests (green) are more easily growing season in November, the light green areas represent the forested areas, the pink/purple areas represent the fields where the rice has been harvested, and the blue areas represent water.
International Archives of the Photogrammetry, Remote Sensing and Spatial Information Sciences, Volume XXXIX-B7, 2012 XXII ISPRS Congress, 25 August – 01 September 2012, Melbourne, Australia
November 2011
November 2011
Figure 3: Top: ETM+ Image RGB= bands 5,4,3 from November 2011; Bottom: ENVISAT ASAR APS HV processed data from November 2011
A maximum likelihood classifier was used in ENVI to compare the ETM+ image alone, a minimum distance classifier was used for the single band SAR image, and the two images fused together. The results are shown in Figure 4 below.
November 2011
November 2011
November 2011
Figure 4: Top: ETM+ Classification, Middle: SAR Classification, Bottom: Fused ETM+ and SAR classification
4. CONCLUSION
A combination of optical data with SAR data is an effective method to delineate rice crops in the Ganges Delta of Bangladesh as it gives more detail than using the optical image alone, and less noise than when using the SAR image on its own. The multi-temporal SAR data makes it easier to visualize the location of the rice crops as they change during the growing cycle, and the combination of fusing optical data with the processed SAR data allows for a more accurate classification of the rice fields for more accurate crop yield mapping.
5. REFERENCES
Abu Bakar, S., Shaari, A., Chuah, H. T., & Ewe, H. T. (1997). SAR Backscatter Response of Various Growth Stages of Wetland Rice Paddy in Malaysia. Retrieved 04 04, 2012, from Asian Associaton on Remote Sensing: http://a-a-r-s.org/acrs/proceeding/ACRS1997/Papers/AGS97-1.htm
Karjalainen, M., Kuittinen, R., Junnikkala, V., Karvonen, T., Nguyen, M. H., & Tran, H. T. (2010, 02 05). Rice yield estimation using SAR images, meteorological data and GIS. Retrieved 04 10, 2012, from European Space Agency publications:
http://earth.esa.int/pub/ESA_DOC/gothenburg/231karja.pdf
Liew, S. C., Kam, S. P., Tuong, T.-P., Chen, P., Minh, V.-Q., Balababa, L., et al. (1997). Delineation of Rice Cropping Systems in the Mekong River Delta using Multitemporal ERS Synthetic Aperture Radar. Retrieved 04 06, 2012, from ESA
International Archives of the Photogrammetry, Remote Sensing and Spatial Information Sciences, Volume XXXIX-B7, 2012 XXII ISPRS Congress, 25 August – 01 September 2012, Melbourne, Australia
Earthnet Online 3rd ERS Symposium 1997: http://earth.esa.int/workshops/ers97/papers/liew/
Nguyen, L.-D., Armando, A., Thuy, L.-T., Young, F., Trung, L.-V., & Bouvet, A. (2009). The Use of Envisat ASAR APP data for rice yield estimation - A case study of Mekong River Delta, Vietnam. Retrieved 04 12, 2012, from Map Asia 2009
Conference Proceedings:
http://mapasia.org/2009/proceeding/agriculture_health/ma09 _Nguyen.pdf
Wang, C. (2009, 04 09). Rice mapping using multi-temporal imagery in Monsoon Asia. Retrieved 04 13, 2012, from SPIE Remote Sensing: http://spie.org/x34289.xml
International Archives of the Photogrammetry, Remote Sensing and Spatial Information Sciences, Volume XXXIX-B7, 2012 XXII ISPRS Congress, 25 August – 01 September 2012, Melbourne, Australia