TERRESTRIAL LASER SCANNER DATA TO SUPPORT COASTAL EROSION
ANALYSIS: THE CONERO CASE STUDY
S. Calligaroa, , G. Sofiab, M. Prosdocimib, G. Dalla Fontanab, P. Tarollib
a
Interdepartmental Research Center of Geomatics (CIRGEO), University of Padova, Agripolis, viale dell’Università 16, 35020 Legnaro (PD), ITALY – [email protected]
bDepartment of Land, Environment, Agriculture and Forestry, University of Padova, Agripolis, viale dell’Università 16,
35020 Legnaro (PD), ITALY – (giulia.sofia, massimo.prosdocimi, giancarlo.dallafontana, paolo.tarolli)@unipd.it
KEY WORDS: Coastal erosion, Terrestrial Laser Scanner, Digital Terrain Model, Landform curvature, Feature extraction, Risk assessment
ABSTRACT:
In this work a detailed TLS survey was carried out in summer 2012, in the Conero Regional Park (Marche, province of Ancona),
along the “spiaggia San Michele” and “spiaggia Sassi Neri”. These areas present several sections affected by erosion, rock falls and slope failures. They also belong to a very prestigious place for tourism during the summer season; therefore, deriving a risk map for these areas is really useful. Thanks to the TLS survey, it was possible to obtain a centimetre resolution DTM covering a reach of about 1.5 km of the coast. This high resolution DTM was used to derive some primary topographic attributes that allowed to arrange a preliminary discussion about the likely unstable areas. These topographic information and results will also serve as the reference point for future yearly TLS surveys, which will absolutely help in recognizing any micro changes and slope failures, improving the risk maps.
Corresponding author
1. INTRODUCTION
In the last decades, the topic of coastal erosion and the derived risk have been subject of a growing interest for public authorities and researchers. Recent major natural events, such as hurricanes, tsunamis, and sea level rising, called the attention of media and society, underlining serious concerns about risk problems. In a high-density populated country such as Italy, where tourism is one of the major economic activities, the coastal erosion is really a critical issue. In April 2010, along a reach of the coast of Ventotene Island, two young students tragically died, killed by a rock fall. This event dramatically stressed public authorities about the effectiveness of structural and non-structural measures for the mitigation of such phenomena. It is clear that an improving of the actual knowledge about coastal erosion is needed, especially to monitor such events and to set alert systems.
Airborne LiDAR (ALS) and Terrestrial Laser Scanner (TLS) derived high-resolution Digital Terrain Models (DTMs) have opened avenues for hydrologic and geomorphologic studies (Slatton et al., 2007; Tarolli et al., 2009). Several researches demonstrated the opportunities and challenges of high resolution topography in many topics, including landsliding (McKean and Roering, 2004; Booth et al., 2009; Kasai et al., 2009; Tarolli et al., 2012; Lin et al., 2013), hillslope environments (Lashermes et al., 2007; Tarolli and Dalla Fontana, 2009; Passalacqua et al., 2010; Orlandini et al., 2011), fluvial environments (Hilldale and Raff, 2008; Jones et al., critical for risk assessment. TLS has proven to be a useful tool for such detailed field survey (Abellán et al., 2009) also in the presence of vegetation (Pirotti et al., 2013b) especially with the new full-waveform TLS sensors (Pirotti et al., 2013c). The acquired elevation data with TLS allow to derive a centimetres high quality DTMs. The possibility to detect in detail the slope failures’ signatures results in a better understanding and mapping of the erosion susceptibility (Tarolli et al., 2012; Lin et al., 2013), and of those areas where slope failures are more likely to happen. In addition, this information can be also considered as the basis for developing risk maps.
Along this line, the aim of this paper is to present a preliminary discussion about a case study related to a coastal area in the Conero Regional Park (Marche, province of Ancona). This stretch of the Adriatic coastal area presents several sections affected by erosion, rock falls and slope failures. This is also a part of a very prestigious place for tourism during the summer season. We highlight the effectiveness of high resolution DTMs derived by terrestrial laser scanner survey for the automatic recognition of geomorphic signatures of erosion or slope failures.
2. STUDY AREA
The study area is the Conero Regional Park (Marche, province of Ancona), in detail the “spiaggia San Michele” and “spiaggia
Sassi Neri”, two coastal areas on the Adriatic sea. This stretch of the coast (about 1.5 km), presents several sections affected by erosion, rock falls and slope failures. In fact, the cliff of the
“spiaggia San Michele” is constituted by marnoso-arenacea The International Archives of the Photogrammetry, Remote Sensing and Spatial Information Sciences, Volume XL-5/W3, 2013
rocks of the Schlier Formation. These are unstable rocks, and erosion factors can easily trigger rockfalls along fault the discontinuities (factures, bedding planes, etc.). Cliffs along the
“spiaggia Sassi Neri”, instead, are constituted by limestone with
the Majolica and the “Scaglia Bianca” and “Rossa” lithofacies. Calcareous cliffs are basically subjected to erosion by waves, that trigger rockfalls due to the erosion at the base of rocky walls. According with this process this kind of cliffs become less and less steep. This coast is also a very famous place from the naturalistic and touristic point of view. The derived risk is well documented by several mitigation measures (warning signs, protective rock barrier fencing, rock curtain) adopted by local authorities. In Figure 1 the location map of the study area is shown, with a view over the segment of analyzed coast.
Figure 1. Location map of the study area, with the analyzed section of the coast
Figure 2a and 2b display a warning sign, and protective rock barrier fencing located in two different places of the coast.
a) b)
Figure 2. (a) Warning sign in a likely unstable area interested by rock fall, (b) an example of protective rock barrier fencing
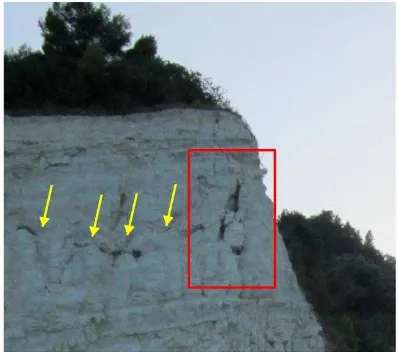
However, Figure 3 provides an example of an unstable rock (red box) sited in the main, and more unstable vertical cliff of the area. Yellow arrows indicate a likely scar on the cliff. This is the section of the coast where TLS survey has been carried out, and the proposed method has been tested.
Figure 3. Likely unstable rock and scar located upslope the path usually selected by the tourist for the connection of the
“spiaggia San Michele” with “spiaggia Sassi Neri”.
3. METHOD
3.1 TLS survey
The TLS survey was performed using a Riegl LMS-Z620 laser scanner. The instrument offers a maximum range up to 2 km in combination with high accuracy (10 mm), and high-speed data acquisition (from 11,000 pts/sec at low scanning rate to 8,000 pts/sec at high scanning rate). For each measured point, the scanner records the range, horizontal alignment angle, vertical alignment angle and backscattered signal amplitude. The Riegl LMS-Z620 is integrated with a high-resolution (12.9 megapixel) Nikon D90 digital camera equipped with a 20 mm lens, that provides an RGB value to the sampled point cloud. The survey was carried out during the summer 2012, and consisted in three scan positions, from which 4,053,303 elevation points were collected. Point density is really irregular on the study area, but on the cliffs, it is about 90 pts/m2 in average. The raw TLS elevation points were not filtered to remove the vegetation, since the section of the analysed coast is not affected by forest stands or shrubs. The absolute vertical accuracy, evaluated by a ground differential DGPS, was estimated to be less than 0.1 m. The TLS dataset was used to generate a DTM at 0.1 m, considering the natural neighbor method (Sibson, 1981).
3.2 Geomorphic features analysis
The surface morphology analysis of the coast subject to likely erosion and slope failures has been carried out through landform curvature. The landform curvature, especially when using high resolution topography with grid cell sizes less than 3 m, has already proven to be useful in the recognition of surface signatures related to geomorphic or anthropic processes (Lashermes et al., 2007; Pirotti and Tarolli, 2010; Tarolli et al., 2012). In this work, we used the curvature as defined by Evans (1979). The local surface is approximated by a quadratic function with reference to a coordinate system (x, y, z) and six parameters (a to e) (Evans, 1979; Wood, 1996), and curvature is found by differentiating the surface equation. Evans’ (1979) method is one of the most suitable at least for first-order derivatives (Shary et al., 2002), and it performs well in the presence of elevation errors (Albani et al., 2004; Florinsky, The International Archives of the Photogrammetry, Remote Sensing and Spatial Information Sciences, Volume XL-5/W3, 2013
1998). To perform terrain analysis across a variety of spatial scales different authors (eg. Wood, 1996) solved the bi-quadratic equation using a n×n window with a local coordinate system (x, y, z) defined with the origin at the pixel of interest (central pixel). Based on these assumptions, the two measures of maximum and minimum profile convexity proposed by Evans (1979), became:
a b a b2 c2
g n
Cmax ( ) (1) (3)
2 2
c b a b a g n
Cmin ( ) (2)
where n = size of the moving window g = grid resolution of the DTM
a, b, c = Evans’ quadratic coefficients for plan
curvature
These two formulae have been applied successfully for channel network extraction (Sofia et al., 2011) and landslide crown extraction (Tarolli et al. 2012; Lin et al., 2013). A mean curvature derived from these two formulae has been used by Pirotti and Tarolli (2010) for channel network extraction. For feature recognition we used the automatic thresholding approach based on statistical analysis of variability of curvature values proposed by Tarolli and Dalla Fontana (2009): multiples of curvature standard deviation ().
4. RESULTS AND DISCUSSION
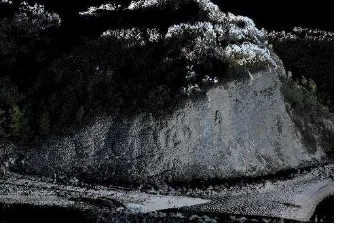
Figure 4 provides a detail of the TLS cloud elevation points in RGB colour.
Figure 4. TLS RGB cloud elevation points
The Figure 5 shows the shaded relief map of the analyzed section of the coast. The 0.1 m DTM is able to capture also the smallest detail related to any failure signatures on the cliff.
Figure 5. Shaded relief map obtained from 0.1 m DTM. The red box indicates the likely unstable area shown in detail in Figure 3.
In Figure 6, an example of curvature map considered in this work is shown. In this case, the raster of Cmin has been evaluated using a 7x7 moving window.
Figure 6. Cmin map obtained with a moving window of 7x7 cells. Red colour (minimum values of Cmin) indicates the concavities. The black arrow indicates the likely unstable rock
shown in Figure 3
Looking at the red colour in the maps, related to the lower values of Cmin, it is possible to recognize the signature of the scarp highlighted in Figure 3 with yellow arrows, and also the likely unstable rock, indicated with a black arrow in Figure 6. Such features have been then extracted using multiple of 2 of Cmin.
Figure 7. Geomorphic features extracted using the threshold of 2 of Cmin (Cmin - 2) and a moving window of 7x7 cells
In Figure 7 the map of extracted features is provided, considering the best performance (Cmin - 2) of the presented methodology. Comparing Figure 7 with Figure 3, one can note that the features related the main scar, especially the location of the unstable rock on the right, are correctly labelled.
5. CONCLUSIONS
This paper highlights the effectiveness of centimetre resolution topography obtained from TLS survey in the recognition of The International Archives of the Photogrammetry, Remote Sensing and Spatial Information Sciences, Volume XL-5/W3, 2013
likely unstable surfaces in a coastal area of Adriatic sea. An objective methodology for automatic feature recognition landform curvature is tested. The methodology uses the statistical analysis of variability of minimum curvature in order to define a likely threshold for feature extraction. The analysis has been carried out with the threshold value of 2 of minimum curvature (Cmin) calculated with a 7 x 7 moving window (0.7 m wide). The method was proven as efficient in terms of time consumption and valid to associate shapes and pattern derived from high-resolution topography with real topographic signature of unstable rocks, and scars on the cliffs. The method needs to be improved in order to better detect the feature and clean the noise derived by complex surface morphology. Nevertheless, this fast, high resolution, and preliminary analysis could meet the requirements for emergency planning, especially when the TLS survey is periodically scheduled. Minor movements could be yearly easily detected, thus providing the basis upon which improve the risk maps for such areas.
6. REFERENCES
References from Journals
Abellán, A., Jaboyedoff, M., Oppikofer, T., Vilaplana, J.M., 2009. Detection of millimetric deformation using a terrestrial laser scanner: experiment and application to a rockfall event.
Natural Hazards and Earth System Sciences, 9, pp. 365-372.
Albani, M., Klinkenberg, B., Andison, D.W., Kimmins, J.P., 2004. The choice of window size in approximating topographic surfaces from digital elevation models. International Journal of
Geographical Information Science, 18(6), pp. 577-593.
Booth, A.M., Roering, J.J., Perron, J.T., 2009. Automated landslide mapping using spectral analysis and high-resolution topographic data: Puget Sound lowlands, Washington, and Portland Hills, Oregon. Geomorphology, 109 (3-4), pp. 132-147.
Cavalli, M., Tarolli P., Marchi L., Dalla Fontana G., 2008. The effectiveness of airborne LiDAR data in the recognition of channel-bed morphology. Catena, 73(3), pp. 249-260.
Cavalli, M., Tarolli, P., 2011. Application of LiDAR technology for rivers analysis. Italian Journal of Engineering
Geology and Environment, Special Issue 1, pp. 33-44.
Florinsky, I.V., 1998. Accuracy of local topographic variables derived from digital elevation models. International Journal of
Geographical Information Science, 12(1), pp. 47-61.
Hilldale, R.C., Raff, D., 2008. Assessing the ability of airborne LiDAR to map river bathymetry. Earth Surface Processes and
Landforms 33, pp. 773-783.
Hilley, G.E., Arrowsmith, J.R., 2008. Geomorphic response to
uplift along the Dragon’s Back pressure ridge, Carrizo Plain,
California. Geology, 36, pp. 367-370.
Legleiter, C.J., 2012. Remote measurement of river morphology via fusion of LiDAR topography and spectrally based bathymetry. Earth Surface Processes and Landforms, 37(5), pp. 499-518.
Lin, C.W., Tseng, C.-M., Tseng, H., Fei, L.-Y., Hsieh, Y.-C., Tarolli, P., 2013. Recognition of large scale deep-seated landslides in forest areas of Taiwan using high resolution topography. Journal of Asian Earth Sciences, 62, pp. 389-400.
Kasai, M., Ikeda, M., Asahina, T., Fujisawa, K., 2009. LiDAR-derived DEM evaluation of deep-seated landslides in a steep and rocky region of Japan. Geomorphology, 113, pp. 57-69.
Kondo, H., Toda, S., Okumura, K., Takada, K., Chiba, T., 2008. A fault scarp in an urban area identified by LiDAR survey: A Case study on the Itoigawa-Shizuoka Tectonic Line, central Japan. Geomorphology, 101, pp. 731-739.
Lashermes, B., Foufoula-Georgiou, E., Dietrich, W.E., 2007. Channel network extraction from high resolution topography using wavelets. Geophysical Research Letters, 34, L23S04.
Jones, A.F., Brewer, P.A., Johnston, E., Macklin, M.G., 2007. High resolution interpretative geomorphological mapping of river valley environments using airborne LiDAR data. Earth
Surface Processes and Landforms, 21, pp. 1574-1592.
McKean, J., Roering, J., 2004. Objective landslide detection and surface morphology mapping using high-resolution airborne laser altimetry. Geomorphology, 57, pp. 331-351.
Notebaert, B., Verstraeten, G., Govers, G., Poesen, J., 2009. Qualitative and quantitative applications of LiDAR imagery in fluvial geomorphology. Earth Surface Processes and
Landforms, 34, pp. 217-231.
Orlandini, S., Tarolli, P., Moretti, G., Dalla Fontana, G., 2011. On the prediction of channel heads in a complex alpine terrain using gridded elevation data. Water Resources Research, 47, W02538.
Passalacqua, P., Tarolli, P., Foufoula-Georgiou, E., 2010. Testing space-scale methodologies for automatic geomorphic feature extraction from LiDAR in a complex mountainous landscape. Water resources research, 46, W11535.
Pirotti, F., Tarolli, P., 2010. Suitability of LiDAR point density and derived landform curvature maps for channel network extraction. Hydrological Processes, 24, pp. 1187-1197.
Pirotti, F., Guarnieri, A., Vettore, A. 2013a. State of the art of ground and aerial laser scanning technologies for high-resolution topography of the earth surface. European Journal of
Remote Sensing, 46, pp. 66-78.
Pirotti, F., Guarnieri, A., Vettore, A., 2013b. Ground filtering and vegetation mapping using multi-return terrestrial laser scanning. ISPRS Journal of Photogrammetry and Remote
Sensing, 76:56-63. doi: 10.1016/j.isprsjprs.2012.08.003 quantitative methods of land surface analysis. Geoderma, 107, pp. 1-32.
Slatton, K.C., Carter, W.E., Shrestha, R.L., Dietrich, W.E., 2007. Airborne laser swath mapping: achieving the resolution and accuracy required for geosurficial research. Geophysical
Research Letters, 34, L23S10.
Sofia, G., Tarolli, P., Cazorzi, F., Dalla Fontana, G., 2011. An objective approach for feature extraction: distribution analysis and statistical descriptors for scale choice and channel network identification. Hydrol. Earth Syst. Sci., 15, pp.1387–1402.
Tarolli, P., Arrowsmith, J.R., Vivoni, E.R., 2009. Understanding earth surface processes from remotely sensed digital terrain models. Geomorphology, 113, pp. 1-3.
Tarolli, P., Dalla Fontana, G., 2009. Hillslope to valley transition morphology: new opportunities from high resolution DTMs. Geomorphology, 113, pp. 47-56.
Tarolli, P., Sofia, G., Dalla Fontana, G., 2012. Geomorphic features extraction from high resolution topography: landslide crowns and bank erosion. Natural Hazards, 61, pp. 65-83.
References from Books
Sibson, R., 1981. A brief description of natural neighbor interpolation (Chapter 2). in V. Barnett: Interpreting
Multivariate Data. Chichester: John Wiley, pp. 21-36.
References from Other Literature
Evans, I.S., 1979. An integrated system of terrain analysis and slope mapping. Final report on grant DA-ERO-591-73-G0040, University of Durham, England.
Wood, J.D., 1996. The Geomorphological Characterisation of Digital Elevation Models. Ph.D. Thesis, University of Leicester.