ESTIMATION OF HOUSING VACANCY DISTRIBUTIONS:
BASIC BAYESIAN APPROACH USING UTILITY DATA
K. Kumagai a *, Y. Matsuda b, Y. Ono b
a Dept. of Civil & Environmental Engineering, Setsunan University, 17-8 Ikeda-Nakamachi, Neyagawa, Osaka 572-8508 Japan - [email protected]
b Division of Social Development Engineering, Graduate school of Science and Engineering, Setsunan University, 17-8 Ikeda-Nakamachi, Neyagawa, Osaka 572-8508 Japan
Commission II, Theme Session 17 Smart Cities
KEY WORDS: Housing vacancy distributions, Utility data, Spatial analysis, Urban planning
ABSTRACT:
In this study, we analyze the quality of water hydrant data for estimating housing vacancies based on their spatial relationships with the other geographical data that we consider are correlated with such vacancies. We compare with in-situ vacant house data in several small districts, thus verifying the applicability of the water hydrant data to the detection of vacant houses. Through applying Bayesian approach, we apply the water hydrant data and other geographical data to repeatedly Bayesian updating for the classification of vacant / no vacant houses. We discuss the results of this classification using the temporal intervals associated with turning off metering, fluctuations in local population density, the densities of water hydrants as indicators of vacancies and several other geographical data. We also conduct the feasibility study on visualisation for the estimation results of housing vacancy distributions derived from the fine spatial resolution data.
1. INTRODUCTION
A key housing problem in many large cities in the developed world involves high levels of vacancies that are spatially clustered. There are many causes that generate high vacancy rates, ranging from housing in large cities being regarded by mobile capital as an asset class, with luxury homes kept empty in order to maximize the performance of asset management (Gerald, 2005, Norris, 2009, Hoekstra, 2011, Vakili-Zad, 2011). Another key factor is population aging (Deilmann, 2009, Sasaki, 2010, Yamamoto, 2011). Japan is a rapidly aging society with a very low birth rate now below its replacement rate. The National Institute of Population and Social Security Research, 2012, suggests that population will keep declining until 2060. Throughout Japan, the government in 2013 reported that 13.5 % of houses were vacant with prospects for an increasing vacancy rate for the foreseeable future (Ministry of Internal Affairs and Communications, Statistic Bureau, 2013). Vacancy generates many problems such as crime, susceptibility to fire. Dereliction and abandonment are increasing in areas which includes many vacant houses (Schachterle, et al., 2012). The monetary value of the areas is decreasing and this again reinforces the spiral of decline (Ministry of Land, Infrastructure, Transport and Tourism, 2011).
To grasp the distribution of vacant houses, individual housing surveys need to be carried out. But these surveys are expensive and often need to be based on household interviews and on detailed archival and historical work associated with exploring land tenure, ownership and housing finance. The difficulty with such surveys depends on the definition of a vacant house (Parsons, 2014). Owners often do not consider their houses to be vacant even though their status is empty, and increasingly vacant houses are used as depositories, or for temporary or future living.
* Corresponding author
An increasingly important way of measuring housing vacancies is through the provision of utilities where most connections from these services to housing are now available through digital data sources (Gerald, 2005). It is now possible to recognize vacant houses where data shows their connection to utility lines such as electricity, water supply, possibly telephones and increasingly broadband services. This lifeline network data is usually recorded and available over long periods at a fine spatial resolution (at street address) where it is maintained by local government and supply companies. This data is often large in volume and increasingly is regarded as big data, requiring new methods of mining to explore the patterns that lie within.
In this study, we apply Bayesian approach to the estimation of housing vacancy distributions. As an initial step, we use the water hydrant data showing the status of water supply and several geographical data for the Bayesian approach. Field survey for identifying vacant houses was previously executed in a typical five districts. Prior probability and likelihood are calculated for the estimation of the posterior probability of the vacant house on the basis of the relationship between the vacant houses identified in the field survey and the geographical data including the utility data. We discuss the results of this estimation through applying the posterior probability of the vacant house to the comparison between the filed survey results. We also conduct the feasibility study on visualisation for the estimation results of housing vacancy distributions derived from the water hydrant data with fine spatial resolution.
2. DATA AND METHODOLOGY 2.1 Study area
The Neyagawa city was adopted as the area of interest in this study. This area is located in the Osaka prefecture in the western part of Japan. It covers about 5 km in an east-west direction and 5 km in a north-south direction.
2.2 Geographical data
We used water hydrant data the Neyagawa city provided. There are addresses of water hydrants, status with respect to their turning on / off, and the time when the hydrants are off in the data. The data was acquired in March, 2013. Fig. 1 shows the histogram of the turned-off water hydrants in each elapsed time (year) when they are off. In the class of “zero year”, which means less than one year, we can see the projecting maximum number of the hydrants. It seems to contain short term cases depended on moving in / out, demolition / rebuilding, and other factors regarding the active housing market. We can also see the considerable numbers of the turned-off water hydrants in the intervals of more than three years. The reason of these distributions is based on the management of water hydrant meters. For instance, a house owner needs to buy a water hydrant meter when he has a newly-built house. Local government, however, does not refund the money of the meter when he has to leave the house several years later. Most of owners then leave the meters in the houses after their moving. As a result, the data of water hydrants has been recorded though they were turned off. The data of the elapsed time when water hydrants are off seem to contain information with respect to housing vacancies, while it is difficult to distinguish whether a house has existed or not, whether renovation of a house has been undergone or not, and whether other changes regarding a house status have occurred or not. The analysis of relation between the water hydrant data and other data related to the vacancies is required. Geographical relationships between them should also be clarified through the analysis because there is the possibility of the detection of geographical factors with respect to the vacancies in the results.
Figure 1. Histogram of the turned-off water hydrants in each elapsed time (year) when they are off.
The basic unit blocks population data of the Population Census of Japan in 1995, 2000, 2005, and 2010 were applied as demographic dynamics. We used the basic map the Neyagawa city made in 2010. The map includes building polygon data, road line data, and railway line data. We adopted the building polygon data as building footprint data for extracting the features of water hydrant distributions.
2.3 Data Preparation
For the application of the Bayesian approach, we preprocessed the geographical data. The geographical data includes a variety of units, time intervals, and data types. For the analysis of housing vacancies, demographic dynamics is required generally. It is practical to apply types of increase, constant, and decrease to the analysis. We divided the population density arranged according to the basic unit blocks into the three statuses of demographic dynamics through applying statistical test. On the assumption that the blocks population density distribution depended on the Gaussian distribution, the statistics of test in regard to a real difference between the means of the blocks population density were calculated with a significance level of 5 %. We transformed the statistics to the values of population density, and we calculated the differences between the values and the mean. Finally, the differences were adapted as the reference of the divisions into the three statuses.
For extracting the feature of vacant houses, we preprocessed the number of water hydrants per building as the density of water hydrants using the building footprint data. The density data and the area of footprint of building are expected to play a role in the classification of the types of houses: a detached house, a row house, and an apartment flat.
The elapsed time when water hydrant was off, was defined as a temporal interval associated with turning off metering.
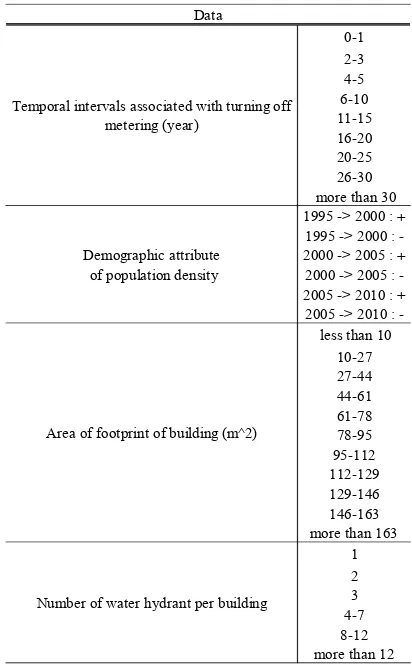
Table 1 shows the attributes of data we preprocessed. There are 4 types of geographical data including 32 items with respect to the status of housing.
Table 1. Attributes of geographical data we preprocessed 0-1
Temporal intervals associated with turning off metering (year)
Demographic attribute of population density
Area of footprint of building (m^2)
Number of water hydrant per building
0
There are several units of the data we applied. We transferred the spatial resolutions of all the geographical data to the highest resolution of the water hydrant before applying the Bayesian approach.
2.4 Field Survey
The field survey with respect to the vacancies was carried out from June to July, 2013. Five districts in the test site were selected as fields of typical features of this area. We conducted the survey through checking facility meters, the occupation of a house, and the status of a building and a garden. The vacant houses were then identified on a basis of the filed survey.
2.5 Application of Bayesian Analysis
We apply a naive Bayes classifier to the estimation of housing vacancies as a basic Bayesian approach. A prior probability and a likelihood function are generally derived from a statistical model for the observed data. We adapt the statistical model on the basis of the field survey data. Equation (1) indicates a basic formula for the naive Bayes classifier.
(1)
The geographical data in Table 1 are applied to Equation (1) through repeatedly Bayesian updating.
3. RESULTS AND DISSCUSION 3.1 Results of the field survey
Table 2 shows an error matrix between the status of water hydrants and the results of field survey. The ratio of agreement between no vacant houses in field survey results and turned-on hydrants indicates almost 1.0. It is apparent that most of water hydrants which are currently on are included in the no vacant houses. On the other hands, the ratio of agreement between vacant houses and turned-off water hydrants shows 0.565. It is clarified that the vacant house does not necessarily hold the turned-off water hydrants. The estimation of vacant house distributions should be executed through the application of both the water hydrant data and other geographical data.
Table 2. Comparison between the status of water hydrants and the results of field survey
3.2 Accuracy assessment of the classification
There are 16,855 water hydrants detected as “included in a vacant house” in the results of the classification. The vacant house ratio of the test site shows 20.3 % based on the classification results, while the vacant house ratio on the basis of the 2013 Housing and Land Survey held by Statistics Bureau, Ministry of Internal Affairs and Communications, has been 13.8 %. The ratio in the Housing and Land Survey was acquired by means of cluster
sampling. Table 3 indicates the results of accuracy assessment of the classification arranged in an error matrix. The degrees of agreements of the vacant houses and the no vacant houses show more than 0.87.
In the field survey, we divided the vacant houses into three types of houses: a detached house, a row house, and an old apartment flat which is the type of Japanese house incorporating Western elements that was made popular in the 1950s and 1960s. It is confirmed that errors of the classification happen mainly in the case that water hydrants classified as “Vacant house” are included “No vacant house” identified by the field survey. Most of those errors seem to generate in the old apartment flats. The features of the old apartment flat are easily able to be described in building factors: the area of footprint of building and the number of water hydrant per building. This structure of the geographical data applied in this study seems to cause the over estimation of the classification.
Table 3. Results of the accuracy assessment for the classification on the basis of the naive Bayes classifier
3.3 Visualisation of the results
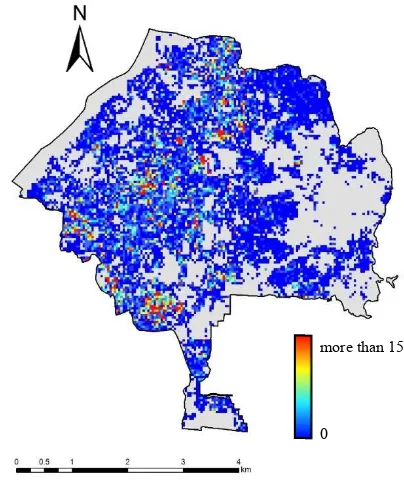
For the urban planning on a regional scale, the spatial resolution of water hydrant data is generally too high to display the whole picture of vacant house distributions. The dense distributions of vacant houses need to be detected for a long-term strategy with respect to urban sustainable development. Figure 2 describes the water hydrant distributions classified as “Vacant house” using discretization of 40 m by 40 m mesh. A mesh in the figure expresses the number of water hydrants classified as “Vacant
Figure 2. Distributions of the water hydrants classified as “Vacant house”. Gradations in colour from blue to red denote the number of water hydrants in the 40 m by 40 m mesh. No vacant house 0.435 0.99 Status of water hydrants
Field survey
Vacant house No vacant house
Vacant house 0.882 0.125
No vacant house 0.118 0.875
Field survey
Classification
more than 15
0
house” in the square with gradations in colour from blue to red. We can see several red points scattered in Figure 2, while the locality of the “Vacant house” distributions is not clarified. We therefore apply spatial autocorrelation analysis to the visualisation of the classification results. The spatial autocorrelation analysis is described by Getis, et al., 1992, in Equation (2) as
(2)
where G = G statistics
x = a spatial variable of interest
n = the number of spatial variables
wij = a symmetric one / zero spatial weight matrix with ones for all links defined as being within distance d of a given i; all other links are zero, including the link of point i to itself
We assign the number of water hydrants classified as “Vacant house” to the variable x. If the null hypothesis is that the set of x
values within d of location i is a random sample, we derive the Z
value described in Equation (3).
(3)
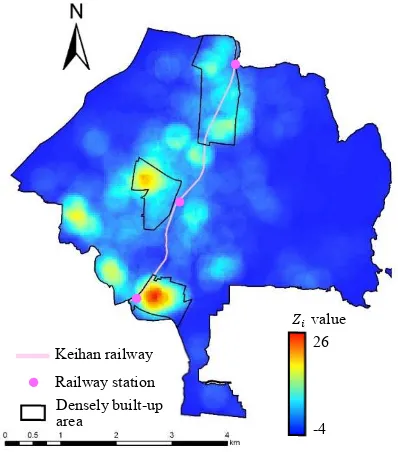
Figure 3 shows the result of the application of the spatial autocorrelation analysis. We adopt 260 m as the distance d on the basis of the quarter size of neighbourhood unit. Gradations in colour from blue to red denote Zivalue. Positive Zivalue means dese distribution of meshes containing many water hydrants classified “Vacant house”. We can see the clusters of high Zi values in densely built-up areas. The densely built-up areas were generated during the high economic growth period after World
Figure 3. Result of the application of spatial autocorrelation analysis to the water hydrants classified as “Vacant house”. Gradations in colour from blue to red denote Zivalue.
War II. There used to be rapid urbanization without any plan in these areas. The location where the clusters occurred seems to be appropriate. We can also recognize two new clusters at the west-south parts in the test site. The visualisation on the basis of the spatial autocorrelation analysis seems to play a role in describing the vacant house distributions derived from high resolution data such as utility data.
4. CONCLUSIONS
In this study, we pointed out the possibility of utility data for applying the estimation of vacancy distributions. We adapted water hydrant data as the utility data, and we verified relationship between turned-off water hydrants and vacant houses identified by filed survey. It was suggested that turned-off water hydrants seemed to include information with respect to vacant houses though the agreement between them showed 0.565. Through the application of the water hydrant data and geographical data to naive Bayes classifier, there were 16,855 water hydrants detected as “included in a vacant house”. The degrees of the agreement of the classification results and the field survey results showed more than 0.87. It was, however, confirmed that errors of the classification occurred mainly in the case that water hydrants classified as “Vacant house” are included “No vacant house” identified by the field survey. The geographical data regarding building factors seemed to cause the over estimation of the classification. We also studied the feasibility of the visualisation of the whole picture of vacant house distributions derived from the utility data with fine spatial resolution. It appeared that the application of spatial autocorrelation analysis was appropriate to detect the cluster of vacant houses.
There are two problems remaining for future research. Firstly, the feasibility of new geographical data will be studied. For instance, the lapse of years after construction of a building seems to contribute to higher accurate classification. Secondly, the improvement of the application of Bayesian approach will be needed. There seems to be the possibility of the usage of natural conjugate prior, Bayesian hierarchical model and other statistical model.
ACKNOWLEDGEMENTS
This work was supported primarily through the Neyagawa City Urban Planning Division. We appreciate great cooperation and suggestion of Prof. Michael Batty.
REFERENCES
Deilmann, C., Effenberger, K., Banse, J., 2009. Housing stock shrinkage: vacancy and demolition trends in Germany. Building Research & Information, 37, pp.660-668.
Gerald, J.F., 2005. The Irish housing stock: Growth in number of vacant dwellings. Quarterly Economic Commentary, Spring 2005, pp.42-63.
Getis, A. & Ord, J.K., 1992. The analysis of spatial association by use of distance Statistics, Geographical Analysis, 24(3), pp.189-206.
Hoekstra, J., & Vakili-Zad, C., 2011. High vacancy rates and rising house prices: The spanish paradox. Tijdschrift Voor Economische En Sociale Geografie, 102(1), pp.55-71.
Ministry of Internal Affairs and Communications, Statistic Bureau, 2013. Housing and Land Survey.
http://www.stat.go.jp/english/data/jyutaku/index.htm (5 Apr. 2016).
Ministry of Land, Infrastructure, Transport and Tourism, 2011. White paper on land, infrastructure, transport and tourism in Japan http://www.mlit.go.jp/english/white-paper/2011.pdf (5 Apr. 2016).
National Institute of Population and Social Security Research, 2012. Population Projections for Japan (January 2012) http://www.ipss.go.jp/site-d/index_english/esuikei/gh2401e.asp (5 Apr. 2016).
Norris, M. & Winston, N., 2009. Rising Second Home Numbers in Rural Ireland: Distribution, Drivers and Implications. European Planning Studies, 17(9), pp.1303-1322.
Parsons, P., 2014. Determining Infiltration Rates and Predicting Building Occupancy Using CO2 Concentration Curves. Journal of Energy, 2014, pp.1-6.
Sasaki, T., Sano, K., Kawabata, M., Kaji, M., 2010. An Intention and Progress Measures on the Offer of Vacant House in Rural Area. Journal of Rural Planning Association, 29, pp.173-178.
Schachterle, S. E., Bishai, D., Shields, W., Stepnitz, R., Gielen, A.C., 2012. Proximity to vacant buildings is associated with increased fire risk in Baltimore, Maryland, homes. Injury Prevention, 18, pp.98-102.
Vakili-Zad, C. & Hoekstra, J., 2011. High dwelling vacancy rate and high prices of housing in Malta a mediterranean phenomenon. Journal of Housing and the Built Environment, 26, pp.441-455.
Yamamoto, S., Kuroki, A., Nakazono, M., 2011. Characteristics of Website Information Style of Vacant House by Local Governments. AIJ Journal of Technology and Design, 17(35), pp.329-332.