I
MPACT OFS
CHEMATICD
ESIGNS ON THEC
OGNITION OFU
NDERGROUNDT
UBEM
APSZheng LIUa and Zhilin LIa*
a
Dept. of Land Surveying and Geo-Informatics, Hong Kong Polytechnic University, Hong Kong [email protected]
Commission II, WG II/6
KEY WORDS : Schematic maps, M ap design, M ap cognition, Tube maps, M ap usability.
ABS TRACT:
Schematic maps have been popularly employed to represent transport networks, particularly underground tube lines (or metro lines), since its adoption by the Official London Underground in early 1930s. Such maps employ straightened lines along horizontal, vertical and diagonal directions. Recently, some researchers started to argue that the distortion in such a schematization may cause big distortion and some new designs are proposed. This project aims to make a comparative analysis of such a schematic design with a new design proposed by M ark Noad in 2011, which makes use of lines along 30º and 60º directions instead of the 45º direction. Tasks have been designed for evaluating the effect of schematic designs on route planning by travellers. The participant was asked to choose the route s/he would take among two or three possible route options and then read the name of the selected trans fer station.
Eye-tracking technique has been employed to track the map recognition process. Total travel time is used as criterion for effectiveness; completion time and mental work cost are used for efficiency evaluation. It has been found that (1) the design of map
style has significant impact on users’ travel decision making, especially map distance and transfer station symbol designs, and (2) the design style of a schematic map will have great impact on the effectiveness and efficiency of map recognition.
1. INTRODUCTION
Schematic maps have been popularly employed to represent transport networks, particularly underground tube lines (or metro lines), since its adoption by the Official London Underground in early 1930s. On such a map, the schematization follows Harry Beck’s rules, i.e. (a) straightening lines, (b) re-orientating lines in horizontal, vertical and diagonal directions, (c) expanding city centre area, and (d) removing background features.
However, in recent years, criticisms on the official London Tube maps have been made. Some researchers argue that the geometric (geographical) distortions caused by the schematization of route lines may affect map recognition and thus affect the trip plans of travellers. As a result, some alternative designs have been produced. One of such designs was by M ark Noad in 2011, who made use of lines along 30º and 60º directions instead of the 45º directions. In this way, the resultant schematic maps will have smaller distortion in geometric (geographical) shape of the network. This new design sounds good, at least in theory .
Therefore, it is decided to conduct a comparative analysis of the effectiveness and efficiency of such a new design and the effect of different designs on map recognition.
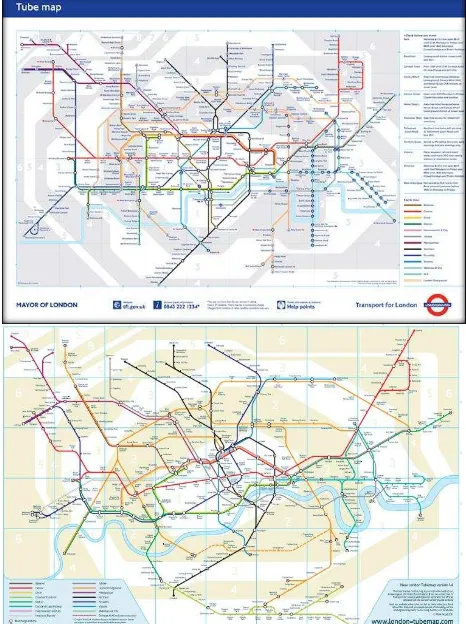
Figure 1 Two types of Schematic maps for London Tube. Upper: official version; Lower: New design by Noad (2011) The International Archives of the Photogrammetry, Remote Sensing and Spatial Information Sciences, Volume XLI-B2, 2016
XXIII ISPRS Congress, 12–19 July 2016, Prague, Czech Republic
This contribution has been peer-reviewed.
Evaluation of map design has been carried by map researchers (e.g. Pickle 2003, Slocum et al. 2001, Haklay and Zafiri 2008, Nivala et al. 2008, Roberts et al. 2010). However, one can rarely see a thorough evaluation on schematic maps. This project is to particularly investigate the impact of design style on the recognition of schematic maps.
2. EXAMPLE OF NEW S CHEMATIC MAP DES IGNED
As mentioned in the introduction, a different schematization scheme was employed by Noad (2011), i.e. making use of lines along horizontal, vertical, 30º and 60º directions. That is, in between the horizontal and vertical directions, two more directions are used instead of only the 45º direction. As a result, the geographic shapes of these two types of maps look quite different, as shown in Figure 1.
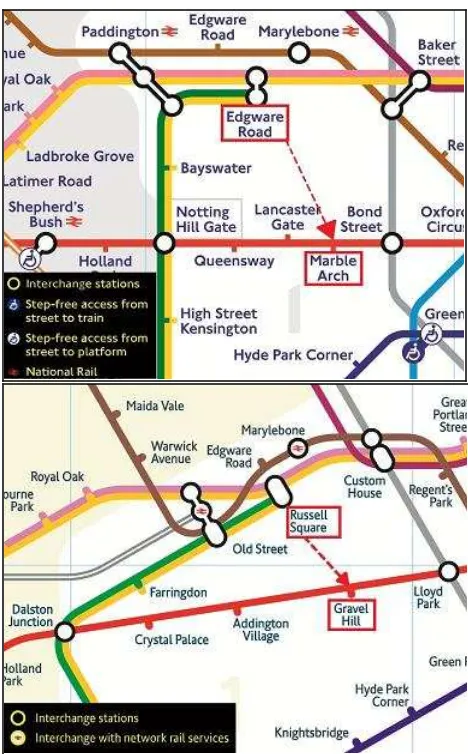
If one enlarges the two maps, it could be found that some of the lines and transfer stations on the two maps appear quite differently, in terms of relative positions, symbol sizes and symbol shape (Figure 2).
Upper: Official map; Lower: M ap designed by Noad (2011) Figure 2 Two maps for comparative study
3. DES IGN OF EXPERIMENT S TUDY
It is suspected that these differences will affect users’ perception of distance between stations and thus affect the travellers’ decision on where to make a transfer to another line. Therefore, it is decided to make a comparative study on effect of map designs on the traveller’s decisions.
Tasks have been designed for evaluating the effect of schematic designs on route planning. In each of them, the origin and destination stations were framed in red, with an arrow pointing from the origin to the destination. There are more than one transfer options to get to the destination, the participant is asked to choose the one s/he prefers.
It should be noted that, in the images from the new map, the names of the origin, the destination and the stations nearby are all changed, in order to minimize the impact of previous decision on the travel plan based on the new map. In another words, although the two maps have different station names, they are actually the representations of tuber lines at the same area. Legends of the two maps are also selectively added on the lower left corner of each image.
Eye-tracking technique has been employed to track the map recognition process. The participant was asked to choose the route s/he would take among two or three possible route options and then read the name of the selected transfer station.
Total travel time is used as criterion for effectiveness; completion time and mental work cost are used for efficiency evaluation.
4. THE EXPERIMENT FOR COMPARATIVE S TUDY
The eye-tracking device used in this study was Tobii X120 system with 60Hz sampling resolution. It is a stand-alone eye-tracking unit that allows for large head movements, providing a distraction-free test environment for gathering valid results (Tobii, 2010). The eye-tracking software used was Tobii Studio 2.1.4. It ran on a Window Vista system and provided eye movements datasets. The tested images were displayed on a LCD monitor with 1280*1024 resolution. The test took place in a university interactive multimedia laboratory, which provided a quiet and undisturbed environment so that the participants would not be distracted during the experiment process.
The following procedure was used for the experiment. First, the participants were given an introduction about the objective, the contents of the test, the equipment. Second, a printed copy of an instruction was given to the participant s, illustrating an example of the task and how to handle it, with simulation images and detailed explanations. The points for attentions were also listed on the instruction. the participants were also warned that there were no pressure on time and no model answers, and it was to test the map usability instead of personal skills.
The International Archives of the Photogrammetry, Remote Sensing and Spatial Information Sciences, Volume XLI-B2, 2016 XXIII ISPRS Congress, 12–19 July 2016, Prague, Czech Republic
This contribution has been peer-reviewed.
5. THE RES ULTS AND COMPARATIVE ANALYS IS
The results from the experiment shows that the different designs of the official Tube map and the new version of Noad’s map have significant impacts on users’ travel decision makings. There are two options for making the transfer, i.e. either change at Notting Hill Gate Station or Baker Street Station Bond Street Station.
With the official map, 25 out of the 27 participants made decision to change at Notting Hill Gate Station. However, in the case of the new map, only 13 out of the 27 made decision to change at Notting Hill Gate Station. In this case, the more effective choice is to change at Baker St./Bond St. because journey time is less according to the information given in Noad’s map website (2011).
With this result, it might be suspected that the distance on map delivers information to the users of how far two stations are apart from each other, or how long it will take to travel from one station to another, since there is no other information about travel times. A longer distance on map indicates that a longer distance between those two stations and is strongly related to travel time. Although it is possible that experienced users may know the actual distance or time needed to take the trip and thus be able to make a better plan relying on their own knowledge, yet the most may not be aware of such information. That is to say, for majority of metro map users, map distance is actual distance.
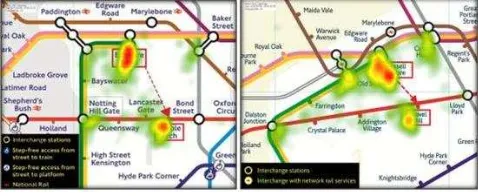
Figure 3 Heat maps of fixations
The eye tracking results from the 27 participants are combined together to generate a heat map of fixations (Figure 3). The
“high temperature” zones are those with high number of fixations. From Figure 3, it could be noted that the Paddington Station has attracted a lot of attention.
In addition to observing where people looked most, watching the eye movement film is more informative because it provides not only where but also in what order the participant was looking at the map. These are the most outstanding advantages of using eye-tracking to analyze map reading. It is noted that the different designs of the official map and the new map had great impacts on users’ searching strategies, but in distinct ways for distinct individuals. The number of times a user shifts his or her vision between transfer stations is used as the measurements. A higher number of shifts suggest a more weighted and balanced decision making process. In other words, the user thought about the alternatives back and forth trying to find the best
solution. The average number of times in fixation shifts is 6.9 for the official map and 5.2 for the new map.
The time spent during the eye-tracking experiment was recorded automatically by the software. The average completion times required for the official map and the new map are 13.2 and 15.4.
6. CONCLUS IONS
From the limited experimental results, two conclusions are drawn: (1) the design style of a schematic map has significant
impact on users’ travel decision making, especially map distance
and transfer station symbol designs, and (2) the design style of a schematic map will have great impact on the effectiveness and efficiency of map recognition.
It is noted here that we are not able to conclude which map is more effective or more efficient because this test is so limited.
ACKNOWLEDGEMENT
This paper is supported by a grant from the Hong Kong Grant Council (B-Q49E) and the Hong Kong Polytechnic University (G-UA7K). Special thanks to Dr. Chi Zheru and his research assistants for their great helps in the eye-tracking experiment.
REFERENCES
Hakley, M ., and Zafiri, A., 2008. Usability engineering for GIS: Learning from a screenshot. The Cartographic Journal, 45 (2), 87-97.
Nivala, A.M ., Brewster, S. and Sarjakoski, L.T., 2008. Usability evaluation of web mapping sites. The Cartographic Journal, 45(2), pp.129-138.
Noad, M ., 2011. London Tubemap . http://www.london-tubemap.com/index.php. [Accessed 10 June 2011].
Pickle, L. Williams., 2003. Usability testing of map designs. Proceedings of Symposium on the Interface of Computing Science and Statistics. Alexandria (VA), pp.42–56.
Roberts, M .J., Newton, E.J. and Lagattolla, E.J., 2010. Objective and subjective measures of metro map usability: Investigating the benefits of breaking design rules. Department of Psychology, University of Essex, UK.
Slocum, T.A. et al., 2001. Cognitive and usability issues in geo-visualization. Cartography and Geographic Information Science, 28(1), pp.61-75.
Tobii Technology AB, 2010. Tobii Eye Tracking: An introduction to eye tracking and Tobii Eye Trackers. http:// www.tobii.com [Accessed 10 Oct. 2011].
The International Archives of the Photogrammetry, Remote Sensing and Spatial Information Sciences, Volume XLI-B2, 2016 XXIII ISPRS Congress, 12–19 July 2016, Prague, Czech Republic
This contribution has been peer-reviewed.