A. Murtiyoso a*, P. Grussenmeyer a, T. Freville b a
Photogrammetry and Geomatics Group, ICube Laboratory UMR 7357, INSA Strasbourg, France – (arnadi.murtiyoso, pierre.grussenmeyer)@insa,strasbourg.fr
b
Drone Alsace, 4 Rue Sainte Catherine, 67000 Strasbourg, France – contact@drone,alsace.fr
! "close range, photogrammetry, UAV, 3D reconstruction, heritage documentation
"
Close,range photogrammetry is an image,based technique which has often been used for the 3D documentation of heritage objects. Recently, advances in the field of image processing and UAVs (Unmanned Aerial Vehicles) have resulted in a renewed interest in this technique. However, commercially ready,to,use UAVs are often equipped with smaller sensors in order to minimize payload and the quality of the documentation is still an issue. In this research, two commercial UAVs (the Sensefly Albris and DJI Phantom 3 Professional) were setup to record the 19th century St,Pierre,le,Jeune church in Strasbourg, France. Several software solutions (commercial and open source) were used to compare both UAVs’ images in terms of calibration, accuracy of external orientation, as well as dense matching. Results show some instability in regards to the calibration of Phantom 3, while the Albris had issues regarding its aerotriangulation results. Despite these shortcomings, both UAVs succeeded in producing dense point clouds of up to a few centimeters in accuracy, which is largely sufficient for the purposes of a city 3D GIS (Geographical Information System). The acquisition of close range images using UAVs also provides greater LoD flexibility in processing. These advantages over other methods such as the TLS (Terrestrial Laser Scanning) or terrestrial close range photogrammetry can be exploited in order for these techniques to complement each other.
*
Corresponding author
#$
Photogrammetry has long been employed for the documentation of heritage buildings and objects. This technique enables the extraction of 3D information from 2D images, and is thus very useful in recording architectural or archeological details. Aided by the development of SfM (Structure from Motion) algorithms, it has become a viable alternative to range,based techniques. In addition, UAVs has recently become a very popular tool for acquiring aerial images. Its use in small,scale and close range photogrammetry is therefore only natural. This adds the advantage of aerial views over other classical terrestrial techniques, where traditionally special mechanisms or higher vantage points were necessary in order to rectify this problem. UAVs are also becoming more and more specialized in various specific domains, close range inspection and modeling among them. However, the results obtained from commercial, ready,to, use UAVs depend strongly on the sensors, which are often integrated within the platform. Questions regarding sensor quality and stability may influence the geometric precision of the 3D model obtained. Furthermore, the question of image number must be tackled using a processing strategy which economizes the available computing resources.
In this research, state,of,the,art commercial UAVs were used to acquire the images of St,Pierre,le,Jeune Catholic church, a historic neo,romanesque 19th century building located in the Neustadt area of the city of Strasbourg, France (Figure 1). The objective of the research is to test the use of these UAVs in 3D reconstruction, as well as to evaluate several software solutions
available in the market. Various scenarios were proposed in order to evaluate the results of each algorithm employed in regards to calibration, aerotriangulation, and dense matching quality. The final result is, however, a 3D model for the purpose of integration within the city of Strasbourg’s 3D GIS.
Figure 1. The main façade of the St,Pierre,le,Jeune church, Strasbourg, France built from typical Alsatian red sandstone.
%$
%$#
Originally a military conception, the UAV has seen a significant shift towards civilian use. The spread of UAVs complements the already existing terrestrial image based techniques, in enabling a close range aerial photogrammetry operation. Coupled with the developments in sensors as well as computing power, this type of surveying becomes a very powerful solution The International Archives of the Photogrammetry, Remote Sensing and Spatial Information Sciences, Volume XLII-2/W3, 2017
for various uses. Heritage documentation naturally benefits from these developments, as it complements terrestrial techniques (Nex and Remondino, 2014). Some examples in this domain include the modeling of façades (Cefalu et al., 2013; Fritsch et al., 2013a; Murtiyoso et al., 2016), whole buildings or monuments (Alidoost and Arefi, 2015; Chiabrando et al., 2015; Suwardhi et al., 2015), and post,catastrophe damage assessment (Achille et al., 2015; Baiocchi et al., 2013).
Several detailed categorizations of UAVs were given by
2. , with the capability of covering
a large surface but may be limited in payload as well as wind resistance. The fixed,wing UAV is suited for larger,scale mapping resembling classical small, format aerial photogrammetry.
3. , either with a single or
multiple rotors. This type of UAV has a larger payload and wind resistance, but its surface coverage can be significantly lower than that of the fixed,wing type.
Some UAV manufacturers have tried to accommodate geometric demands by integrating higher quality lenses, although it is still often limited by the payload. Furthermore, the use of UAVs for heritage documentation is not limited to an exclusive use of aerial unmanned platforms. Combinations exist with other terrestrial techniques such as terrestrial laser scanners (TLS) (Barsanti et al., 2014; Grenzdörffer et al., 2015).
%$% & &'( ) & ( *+ ,(*'
Sensor calibration is a very important step in photogrammetric projects, especially if a high level of accuracy is required. A calibrated camera is one whose internal parameters such as principal distance, principal point offset, and distortions are known. Note that in the computer vision domain, usually only the principal distance is calculated. This shows the differing point of view between the two domains; photogrammetry stresses on accuracy while computer vision emphasizes automation (Remondino and Fraser, 2006).
Several types of calibration exist, with self,calibration being the most used method in modern SfM,based software solutions. This is due to its flexibility for non,metric cameras. However, attention should be paid to this method because there are several scenarios where self,calibration is not recommended simply due to unfavorable network geometry. It is therefore always recommended to perform laboratory calibration before taking images in projects requiring high level of precision (Remondino and Fraser, 2006).
In order to perform a good calibration, several rules can be followed. The most important of these rules include the use of a multi,station network with strong geometric convergence, variations to the roll,angle of the camera, a constant lens focus,
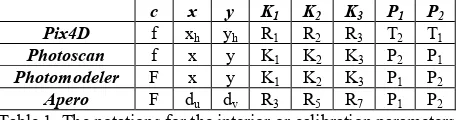
and the existence of scale variations on the image (Luhmann et al., 2016; Remondino, 2014; Remondino and Fraser, 2006). It should also be noted that different software packages define interior parameters in a different way. Table 1 presents their notations in the four algorithms used in this paper. In the first row of the table, c represents the principal distance, x and y the principal point offset, and K1, K2 and K3 denote the radial Table 1. The notations for the interior or calibration parameters
in the software solutions used in this paper.
%$- & & *'). / 00( *).&
Most 3D reconstruction software packages which are based on images have their own algorithm for the generation of a dense point cloud. Remondino et al. (2013, 2014) have tried to classify the different existing approaches to dense matching. The most basic classification is between the matching of features (i.e. comparison of descriptors) and the matching of grayscale values within a set search window. Once the correspondence is done, a simple mathematical calculation is performed in order to determine the coordinates of the object on the object space. The matching of features is otherwise called Feature,Based Matching (FBM) while the other classification is called Area,Based Matching (ABM) (Remondino et al., 2013).
Algorithms which follow the ABM classification are very powerful, with the possibility to reach a matching precision of up to 1/50 pixel. However, ABM requires objects with textures as well as approximate values. On the other hand, FBM is less dependent on textures, even though the resulting point cloud is often not dense enough. Examples of FBM algorithms include SIFT (Lowe, 2004), SURF (Bay et al., 2006), Harris detectors (Harris and Stephens, 1988), etc.
-$
Two commercial UAVs were used in this research. The Albris (from Sensefly) first appeared in the market in May 2015 (at the time called “Exom” and renamed to Albris in April 2016). The Albris is aimed to perform close,range high resolution inspections, mapping, and 3D modeling. It is equipped with multiple sensors, including a still 38 megapixels (MP) camera, a thermal and a video camera. Several ultrasonic sensors give an approximate distance measurement of its surroundings, enabling it to fly on a fixed and set distance from an object. The still camera itself is furnished with an 8 mm lens and a 10 x 7.5 mm sensor.
The DJI Phantom 3 Professional, also a multi,copter rotary wing type, was first released also in May 2015. The Phantom 3 is lightweight and relatively low,cost, but it is not geared especially for dedicated close,range inspection tasks. It is equipped with a 4 mm lens and a 6.5 x 5 mm sensor capable of producing 12 MP images.
In addition to the UAVs, a standard DSLR camera was also used to complement the data acquisition. This is due to the existence of vegetations (trees and shrubs) around the church, The International Archives of the Photogrammetry, Remote Sensing and Spatial Information Sciences, Volume XLII-2/W3, 2017
which hindered aerial images of the lower parts of the building to be taken. The DSLR camera used was a Nikon D3200 with 24 MP images. The lens used had a focal length of 24 mm. The camera to object distance was maintained in such way as to imitate the GSD (Ground Sampling Distance) of the UAV images. A time,of,flight TLS was also employed in this project in order to obtain reference data with which comparisons can be made with the photogrammetry data. In this case, a Trimble TX8 laser scanner was used to obtain point clouds of the church’s main façade and its South,East façade.
As regards to the software solutions tested, Photoscan (Agisoft), Photomodeler (EosSystems), and Pix4D were used from the commercial side. From the open source domain, the Apero, Micmac software suite developed by IGN (France) was also tested. For further use in this article, Pix4D will be abbreviated as P4D, Photoscan as PS, Photomodeler as PM, and Apero, Micmac as (AP,MM).
Pix4D (P4D) and Photoscan (PS) are two commercial solutions with a rather black,box nature. However, concurrent with the results of Remondino et al. (2014), PS most probably performs a modified SGM (Semi,Global Matching) (Hirschmüller, 2011) of stereo pairs to generate depth maps, and then employs epipolar constraints at the end of this process to filter the results. P4D may have used a similar albeit different approach, since an SGM,based matching is offered as an additional plug, in. Photomodeler (PM) has long been used by the architecture and archeology community for performing 3D image,based measurements (Grussenmeyer et al., 2002). This software has an advantage over other commercial solutions in that it provides more statistical information on its results, making it less black, box like. PM has since added a dense matching module based on stereo,pairs and more recently on a multi,view geometry. Meanwhile, Micmac (MM) uses a multi,resolution and multi, image approach to dense matching (Pierrot,Deseilligny and Paparoditis, 2006). MM is modular and works with several levels of complexity and automation. The first module, Pastis, searches and matches tie points on the images. Apero (AP) performs bundle block adjustment to retrieve the external orientation parameters of the camera stations. Finally, Micmac performs a pyramidal processing to search pixel correspondences. Results from a lower resolution matching are used to guide the matching at the higher resolution level, with the maximum resolution determined by a parameter (Remondino et al., 2014).
In taking the images of the building’s main façade, a particular acquisition strategy was used. A flight plan was made to encompass the whole façade using perpendicular images, similar to the classical strategy employed in traditional aerial photogrammetry. However, this was immediately followed by five other flights following the same flight plan but with the sensor tilted upwards, downwards, to the left and to the right respectively. This generates oblique images and is designed to cover the most details and hidden parts in a systematic manner (Murtiyoso et al., 2016). However, the main downfall of this method is that the same flight plan must be flown five times, which generates problems related to texture homogeneity, flight time, and battery. That being said, a system which permits the UAV to take perpendicular and oblique images in the same time can be envisaged in the future. A similar concept has already been implemented in larger,scale aerial photography (Murtiyoso et al., 2014; Rupnik et al., 2014).
1$
1$# *+ ,(*'
The calibration was performed on the two sensors used in this project. All software solutions were used to calibrate these sensors. However, due to licensing limitations, calibration on P4D was only performed for the Albris sensor. Furthermore, P4D gives the values of pre,calibrated parameters for both sensors, which may serve as references.
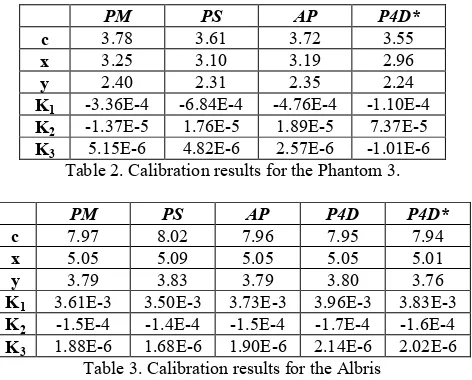
A calibration site was established within the INSA Strasbourg building in order to provide a stable calibration frame. A corner of a room was chosen for this in order to give a multi,scale effect to the images. Coded targets were placed on this site, and their coordinates were determined using a total station. The calibration was performed by taking images around this calibration site in three different heights, all converging on the said corner. The results can be seen in Tables 2 and 3, where the units for the principal distance and the principal point offsets are in millimeters and P4D* denotes the values of the calibration parameters given by the P4D database. The plotted radial distortion curves can also be seen in Figure 2.
) 3.78 3.61 3.72 3.55
Table 2. Calibration results for the Phantom 3.
) 7.97 8.02 7.96 7.95 7.94
Table 3. Calibration results for the Albris
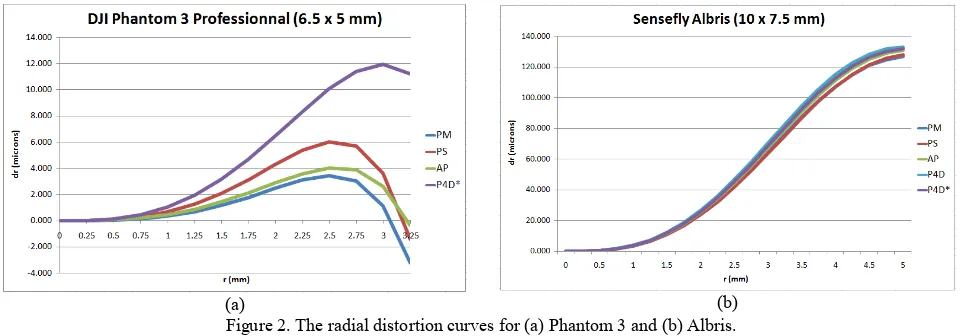
In the case of the Phantom 3, a small systematic error was observed on the principal distance and principal point offset values. A systematic difference between 0.1 and 0.2 mm were detected for these three parameters, in comparing the computed values from the various algorithms with the ones given by the P4D database (P4D* values). On the other hand, the Albris only produced a very small difference of 0.04 mm for these parameters. As regards to the radial distortion coefficients, the Phantom 3 radial distortion curve showed an anomaly. Here the curve presents both positive and negative values towards the edges of the image. However the graph was plotted using the unbalanced mathematical model; the distortion values should therefore be always either positive or negative.
According to the statistics furnished by PM, the correlation between K2 and K3 in Phantom 3 reached 96.9%. The standard deviation of the resulting K2 was also 1.6 times larger than the value itself. This may be caused by the instability of the interior geometry of the sensor, as well as the quality of the optics itself (bearing in mind that these sensors are very small and low,cost). Caution should therefore be exercised when integrating the computed K3 (and eventually also K2) in Phantom 3 projects. The International Archives of the Photogrammetry, Remote Sensing and Spatial Information Sciences, Volume XLII-2/W3, 2017
(a) (b) Figure 2. The radial distortion curves for (a) Phantom 3 and (b) Albris.
As for the Albris, the results were stable between the different software computations. However, the difference between the computed and provided values emphasizes the necessity to perform pre,project sensor calibration, even if it would serve only as approximate values for the eventual self,calibration process.
1$% &( '( * /4+*'
Two data sets were obtained on the St,Pierre,le,Jeune church. The first was the main façade data set, which was acquired using the Albris. By benefiting from its ultrasonic sensors, the camera to object distance in this data set was set to a constant of 8 meters in an effort to keep the GSD from changing. This yielded a theoretical GSD of 1.4 mm. Also, the perpendicular plus oblique acquisition method was applied in this case. The rest of the church was imaged using the Phantom 3 with camera to object distances, which range from 10 to 15 meters (hence a GSD of around 4 to 6 mm). Phantom 3 did not have the ability to maintain its camera to object distance, so it was up to the pilot to approximate this parameter on the field.
Analysis on the quality of the exterior orientation or aerotriangulation was performed on the two data sets. The first data set was the main façade, which was acquired using the Albris (with 11 control points scattered on the façade). On the contrary only a portion of the rest of the church acquired by the Phantom 3 was analyzed (with 9 control points).
The Albris aerotriangulation quality was tested using all four solutions. The differences between the calculated and measured coordinates of the control points were averaged. The resulting values from the four algorithms give on average an error of 7.5 mm. It should be noted that since no coded targets were placed on the object, each control point measurement was performed independently in each software packages. This may lead to influences of accidental error on the differing results. However, it is interesting to note is that this value is much higher than expected.
By taking into account sub,pixel measurement and accidental errors, an approximation to the expected aerotriangulation error was obtained at 0.6 times the average GSD. This gave an expected aerotriangulation error for this data set of 0.84 mm. The calculated value is therefore almost 9 times higher. It should be noted that the Albris images were plagued by noises (an issue which had been acknowledged by Sensefly and is to be addressed soon), which hampered a proper sub,pixel marking of the control points. This led to worse manual
measurement of the control points, and certainly contributed to this overestimation of the aerotriangulation result.
On the contrary, the Phantom 3 dataset had an average theoretical GSD of 6 mm and an expected aerotriangulation error of 3.6 mm. The obtained result gave an average error of 13 mm between PS and AP. Using a 2.7 σ tolerance, this value is only a little overestimated. It should also be noted that Phantom 3’s camera to object distance can only be approximated. The value of the theoretical GSD can therefore vary. In any case, both UAVs managed to reach centimetric precision.
1$- & & *'). /
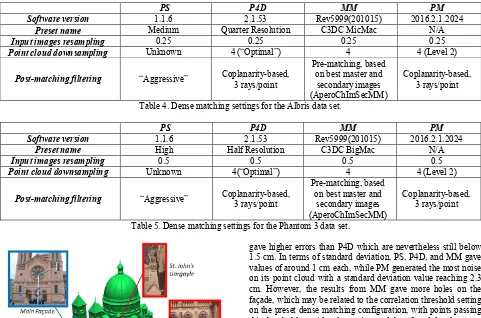
The dense matching was performed using all four algorithms in order to compare their performance. The comparison of dense matching parameters in each algorithm can be seen in Tables 4 and 5. The main façade (the Albris dataset) comprises approximately 500 images while the rest of the building (the Phantom 3 dataset) amounted to approximately 2,000 images. In addition, around 200 terrestrial images were also taken.
Since different sensors were used to record the building, processing was performed independently for each data source (Albris, Phantom 3, and also the complementing terrestrial images). The resulting dense point clouds were then combined and meshed as a single entity. This was done in order to reduce the processing requirements, which can be very high for such a project with more than 2,700 images. The meshing was then performed on the merged point cloud and decimated to reduce its size. Finally, the textures from all images were projected on the unified 3D mesh. This strategy was taken in order to avoid abrupt changes in the texture due to the individual processing of each data set. A nadiral view of the resulting 3D model before and after merging and texturing is shown in Figure 3.
In order to validate the dense matching results, a laser scanning mission was performed on the main and South,Eastern façades. Overall, five scans were performed and the clouds registered with an average error of 2.2 mm. The resulting point cloud was then subsampled spatially to a 3 mm resolution point cloud and meshed using the Poisson method (level of Octree 13).
Samples were taken both from the main façade and the South, Eastern façade to be compared to the TLS data. The overall façades were analyzed, and then details from these two façades were extracted (Eastern tympanum for the main façade and a gargoyle statue for the South,Eastern façade) to be assessed in a smaller scale (Figure 4).
(a) (b)
Figure 3. The merged dense point cloud (a) before global texturing and the final meshed and textured 3D model (b).
1.1.6 2.1.53 Rev5999(201015) 2016.2.1.2024
Medium Quarter Resolution C3DC MicMac N/A
! " " 0.25 0.25 0.25 0.25
! " Unknown 4 (“Optimal”) 4 4 (Level 2)
# " " “Aggressive” Coplanarity,based,
3 rays/point
Pre,matching, based on best master and
secondary images (AperoChImSecMM)
Coplanarity,based, 3 rays/point
Table 4. Dense matching settings for the Albris data set.
1.1.6 2.1.53 Rev5999(201015) 2016.2.1.2024
High Half Resolution C3DC BigMac N/A
! " " 0.5 0.5 0.5 0.5
! " Unknown 4(“Optimal”) 4 4 (Level 2)
# " " “Aggressive” Coplanarity,based,
3 rays/point
Pre,matching, based on best master and
secondary images (AperoChImSecMM)
Coplanarity,based, 3 rays/point
Table 5. Dense matching settings for the Phantom 3 data set.
Figure 4. The 3D meshed model of the church, with the four samples taken in order to compare them with TLS data. Blue squares indicate acquisition by Albris while red squares indicate acquisition by Phantom 3.
In order to eliminate the influence of errors due to georeferencing, the Iterative Closest Point (ICP) process was performed between the reference and each of the photogrammetric point cloud samples. As regards to the comparison on the main façade sample (Figure 5), each software managed to obtain an average error of around 1 mm, with P4D giving a value below 0.5 mm. MM, PS, and PM each
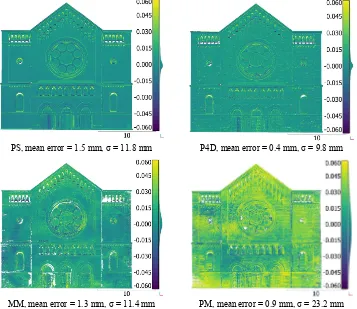
gave higher errors than P4D which are nevertheless still below 1.5 cm. In terms of standard deviation, PS, P4D, and MM gave values of around 1 cm each, while PM generated the most noise on its point cloud with a standard deviation value reaching 2.3 cm. However, the results from MM gave more holes on the façade, which may be related to the correlation threshold setting on the preset dense matching configuration, with points passing this threshold considered as noises and therefore deleted.
A more detailed analysis can be observed on the Eastern tympanum, as can be seen in Figure 6. In this case, the mean error of PS, P4D, and PM remains stable from the previously obtained values from the façade. The value for MM was reduced almost by half, which may indicate the presence of systematic error on the main façade data set result. It should be noted that the error on all results may be caused by the lack of points (therefore holes on the reference mesh) on the upper parts of the laser scan data due to the terrestrial nature of the laser scanning stations. Therefore care should also be taken in interpreting these results. Results which are too precise might indicate an interpolating algorithm hidden behind the photogrammetric software or the presence of high accidental error. In any case, PS, P4D, and MM gave similar results in terms of standard deviation while PM once again suffered from noises as shown by its high standard deviation value (1.6 cm). The International Archives of the Photogrammetry, Remote Sensing and Spatial Information Sciences, Volume XLII-2/W3, 2017
For the dataset imaged using the Phantom 3 UAV, the South, Eastern façade (Figure 7) shows a comparable result in terms of average error for all algorithms tested. Note that the lack of data on the roof beneath the gargoyles is due to the absence of sufficient points from the terrestrial laser scanner. When compared to the results of the previous comparison, a slight systematic error may have been present on the Albris dataset. However in terms of standard deviation, all algorithms gave values of around 2 cm. This may be linked to the resolution of the Phantom 3 images. It is interesting to note that the standard deviation for the Albris and Phantom 3 datasets are of the same order, even though the Albris is supposed to have 38 MP in image resolution compared to the Phantom 3’s 12 MP images. PM again generated the most noise, but this time its standard
deviation value is comparable to that of PS. However, visually PS gave a more homogeneous point cloud. This may indicate a post,processing stage in PS which refines the generated point cloud.
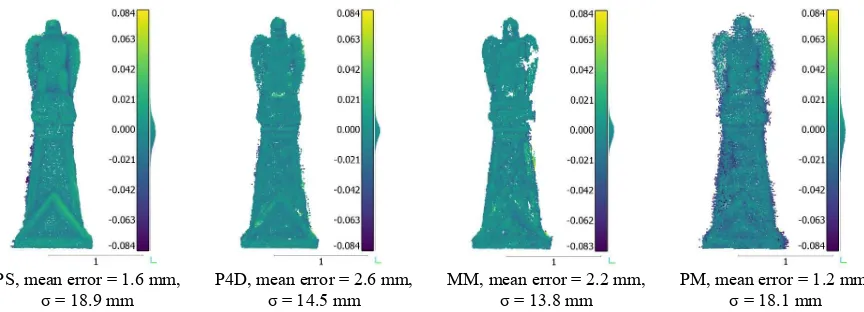
A more detailed view can be seen on the comparison of the St. John’s gargoyle sample (Figure 8). In this sample, the mean error is again roughly comparable between the four algorithms. The standard deviation also corresponds with the previously compared South,Eastern façade. It should be noted that the gargoyle was processed in the same time as the façade. A more LoD,oriented processing workflow can well be implemented in this type of case, where the architectural detail is processed in a higher resolution than the rest of the global façade.
PS, mean error = 1.5 mm, σ = 11.8 mm P4D, mean error = 0.4 mm, σ = 9.8 mm
MM, mean error = 1.3 mm, σ = 11.4 mm PM, mean error = 0.9 mm, σ = 23.2 mm
Figure 5. Comparison of dense matching results of the main façade to TLS data.
PS, mean error = 1.4 mm, σ = 8.4 mm P4D, mean error = 0.3 mm, σ = 8.6 mm
MM, mean error = 0.7 mm, σ = 8.9 mm PM, mean error = 1.1 mm, σ = 15.9 mm
Figure 6. Comparison of dense matching results of the South,Eastern tympanum to TLS data.
PS, mean error = 0.3 mm, σ = 21.0 mm
P4D, mean error = 0.5 mm, σ = 16.8 mm
MM, mean error = 0.3 mm, σ = 17.2 mm
PM, mean error = 0.3 mm, σ = 21.1 mm
Figure 7. Comparison of dense matching results of the South,Eastern portal to TLS data.
PS, mean error = 1.6 mm, σ = 18.9 mm
P4D, mean error = 2.6 mm, σ = 14.5 mm
MM, mean error = 2.2 mm, σ = 13.8 mm
PM, mean error = 1.2 mm, σ = 18.1 mm
Figure 8. Comparison of dense matching results of the St. Matthew’s gargoyle to TLS data.
All four software managed to process both UAV’s dataset to reach a millimetric (in some cases even sub,millimetric) error in terms of dense matching. The supposedly high resolution of Albris images is however hampered by noises as evidenced by the centimetric standard deviation values constant throughout the results. Phantom 3 on the other hand is limited by its low resolution images in this regard. PM constantly gives high values of accuracy, but accompanied by a higher amount of noise. MM in its C3DC mode is most of the time comparable to the other solutions, but its signal to noise parameter remains to be determined manually for each case to avoid too much holes. P4D managed to generate the best result for the Albris dataset (but not so with the Phantom 3 dataset). This may indicate the presence of corrections in regard to Albris images processed in P4D. Finally, it is interesting to note the high value of standard deviation in PS despite the homogeneous visual result. Suspicion is given to a hidden post,processing interpolation and/or extrapolation of the dense point cloud (see also Murtiyoso et al. (2016) and Lachat et al. (2017)).
5$
The acquisition of close range images using UAVs require not only a careful planning, but also a good experience in UAV handling. Results from this project showed that a careful estimation of the required GSD is also an important factor, even more so in large projects requiring higher details. Furthermore, the analysis and comparison of the dense matching results showed that the understanding of different matching parameters present on different algorithms is important. However, these parameters are often defined differently by each software, and a
complete harmonization of them remains a complicated task. A multi,LoD (Level of Detail) approach may also be implemented in these types of project. In this regard, the acquisition of close range images using UAVs not only gives the advantage of aerial view, but also provides greater LoD flexibility in processing. These advantages over other methods such as the TLS or terrestrial close range photogrammetry can be exploited to complement each other.
!
The research presented in this paper is the result of collaboration between INSA Strasbourg’s Photogrammetry and Geomatics Group and the Drone Alsace company (www.drone, alsace.fr/). The final 3D model (meshed and textured) of the St, Pierre,le,Jeune church can be viewed through the following link: https://skfb.ly/PtQF (last accessed 20 January 2017).
Achille, C., Adami, A., Chiarini, S., Cremonesi, S., Fassi, F., Fregonese, L., Taffurelli, L., 2015. UAV,based photogrammetry and integrated technologies for architectural applications , methodological strategies for the after,quake survey of vertical structures in Mantua (Italy). Sensors (Switzerland) 15, 15520– 15539.
Alidoost, F., Arefi, H., 2015. An image,based technique for 3D building reconstruction using multi,view UAV images. ISPRS , International Archives of the Photogrammetry, Remote Sensing and Spatial Information Sciences XL,1/W5, 43–46.
Baiocchi, V., Dominici, D., Mormile, M., 2013. UAV application in post,seismic environment. ISPRS , International Archives of the Photogrammetry, Remote Sensing and Spatial Information Sciences XL,1/W2, 21–25.
Barsanti, S.G., Remondino, F., Fenández,Palacios, B.J., Visintini, D., 2014. Critical factors and guidelines for 3D surveying and modelling in Cultural Heritage. International Journal of Heritage in the Digital Era 3, 141–158.
Bay, H., Tuytelaars, T., Van Gool, L., 2006. SURF: Speeded up robust features. Lecture Notes in Computer Science 3951 LNCS, 404–417.
Cefalu, A., Abdel,wahab, M., Peter, M., Wenzel, K., Fritsch, D., 2013. Image based 3D Reconstruction in Cultural Heritage Preservation. Proceedings of the 10th International Conference on Informatics in Control, Automation and Robotics, 201–205.
Chiabrando, F., Donadio, E., Rinaudo, F., 2015. SfM for orthophoto generation: a winning approach for cultural heritage knowledge. ISPRS , International Archives of the Photogrammetry, Remote Sensing and Spatial Information Sciences XL,5/W7, 91–98.
Colomina, I., Molina, P., 2014. Unmanned aerial systems for photogrammetry and remote sensing: A review. ISPRS Journal of Photogrammetry and Remote Sensing 92, 79–97.
Fritsch, D., Becker, S., Rothermel, M., 2013a. Modeling Façade Structures Using Point Clouds From Dense Image Matching. Proceedings of the Intl. Conf. on Advances in Civil, Structural and Mechanical Engineering 57–64.
Fritsch, D., Cramer, M., Haala, N., 2013b. UAV im Einsatz für die Datenerfassung beim LGL BW Abschlussbericht. Stuttgart.
Grenzdörffer, G.J., Naumann, M., Niemeyer, F., Frank, A., 2015. Symbiosis of UAS Photogrammetry and TLS for Surveying and 3D Modeling of Cultural Heritage Monuments , a Case Study About the Cathedral of St. Nicholas in the City of Greifswald. ISPRS , International Archives of the Photogrammetry, Remote Sensing and Spatial Information Sciences XL,1/W4, 91–96.
Grussenmeyer, P., Hanke, K., Streilein, A., 2002. Architectural Photogrammety, in: Kasser, M., Egels, Y. (Eds.), Digital Photogrammetry. Taylor & Francis, pp. 300–339.
Harris, C., Stephens, M., 1988. A Combined Corner and Edge Detector. Procedings of the Alvey Vision Conference 1988 147–151.
Hirschmüller, H., 2011. Semi,Global Matching Motivation, Developments and Applications. Photogrammetric Week 173– 184.
Lachat, E., Landes, T., Grussenmeyer, P., 2017. First Experiences with the Trimble SX10 Scanning Total Station for Building Facade Survey. ISPRS , International Archives of the Photogrammetry, Remote Sensing and Spatial Information Sciences. 3DArch 2017 Conference Proceedings, Nafplio, Greece, 1,3 March 2017.
Lowe, D.G., 2004. Distinctive image features from scale invariant keypoints. International Journal of Computer Vision 60, 91–110.
Luhmann, T., Fraser, C., Maas, H.G., 2016. Sensor modelling and camera calibration for close,range photogrammetry. ISPRS Journal of Photogrammetry and Remote Sensing 115, 37–46.
Murtiyoso, A., Grussenmeyer, P., Koehl, M., Freville, T., 2016. Acquisition and Processing Experiences of Close Range UAV Images for the 3D Modeling of Heritage Buildings, in: Ioannides, M., Fink, E., Moropoulou, A., Hagedorn,Saupe, M., Fresa, A., Liestøl, G., Rajcic, V., Grussenmeyer, P. (Eds.), Digital Heritage. Progress in Cultural Heritage: Documentation, Preservation, and Protection: 6th International Conference, EuroMed 2016, Nicosia, Cyprus, October 31 ,, November 5, 2016, Proceedings, Part I. Springer International Publishing, pp. 420–431.
Murtiyoso, A., Remondino, F., Rupnik, E., Nex, F., Grussenmeyer, P., 2014. Oblique Aerial Photography Tool for Building Inspection and Damage Assessment. ISPRS , International Archives of the Photogrammetry, Remote Sensing and Spatial Information Sciences XL,1, 309–313.
Nex, F., Remondino, F., 2014. UAV: platforms, regulations, data acquisition and processing, in: Remondino, F., Campana, S. (Eds.), 3D Recording and Modelling in Archaeology and Cultural Heritage: Theory and Best Practices. Archaeopress, Oxford, England, pp. 73–86.
Pierrot,Deseilligny, M., Paparoditis, N., 2006. A multiresolution and optimization,based image matching approach: An application to surface reconstruction from SPOT5,HRS stereo imagery. ISPRS , International Archives of the Photogrammetry, Remote Sensing and Spatial Information Sciences XXXVI.
Remondino, F., 2014. Photogrammetry , Basic theory, in: Remondino, F., Campana, S. (Eds.), 3D Recording and Modelling in Archaeology and Cultural Heritage: Theory and Best Practices. Archaeopress, Oxford, England, pp. 63–72.
Remondino, F., Fraser, C., 2006. Digital camera calibration methods: considerations and comparisons. ISPRS , International Archives of Photogrammetry, Remote Sensing and Spatial Information Sciences 36, 266–272.
Remondino, F., Spera, M.G., Nocerino, E., Menna, F., Nex, F., 2014. State of the art in high density image matching. The Photogrammetric Record 29, 144–166.
Remondino, F., Spera, M.G., Nocerino, E., Menna, F., Nex, F., Gonizzi,Barsanti, S., 2013. Dense image matching: Comparisons and analyses. Proceedings of the Digital Heritage 2013 1, 47–54.
Rupnik, E., Nex, F., Remondino, F., 2014. Oblique multi, camera systems,orientation and dense matching issues. ISPRS , International Archives of the Photogrammetry, Remote Sensing and Spatial Information Sciences 40, 107–114.
Suwardhi, D., Menna, F., Remondino, F., Hanke, K., Akmalia, R., 2015. Digital 3D Borobudur , Integration of 3D Surveying and Modeling Techniques. ISPRS , International Archives of the Photogrammetry, Remote Sensing and Spatial Information Sciences XL,5/W7, 417–423.