GROUND AND AERIAL DIGITAL DOCUMENTATION OF CULTURAL HERITAGE:
PROVIDING TOOLS FOR 3D EXPLOITATION OF ARCHAEOLOGICAL DATA
G. Cantoro a
a GeoSat ReSeAch Lab, Institute for Mediterranean Studies – Foundation for Research and Technology Hellas, Nikiforou Foka 130 - Rethymno (Crete, Greece); [email protected]
Commission II
KEY WORDS: Cultural Heritage, 3D, Point-clouds, Laser scanning, Digital Photogrammetry, Aerial Remote Sensing, On-Line Tools
ABSTRACT:
Archaeology is by its nature strictly connected with the physical landscape and as such it explores the inter-relations of individuals with places in which they leave and the nature that surrounds them. Since its earliest stages, archaeology demonstrated its permeability to scientific methods and innovative techniques or technologies. Archaeologists were indeed between the first to adopt GIS platforms (since already almost three decades) on large scale and are now between the most demanding customers for emerging technologies such as digital photogrammetry and drone-aided aerial photography.
This paper aims at presenting case studies where the “3D approach” can be critically analysed and compared with more traditional means of documentation. Spot-light is directed towards the benefits of a specifically designed platform for user to access the 3D point-clouds and explore their characteristics. Beside simple measuring and editing tools, models are presented in their actual context and location, with historical and archaeological information provided on the side. As final step of a parallel project on geo-referencing and making available a large archive of aerial photographs, 3D models derived from photogrammetric processing of images have been uploaded and linked to photo-footprints polygons. Of great importance in such context is the possibility to interchange the point-cloud colours with satellite imagery from OpenLayers. This approach makes it possible to explore different landscape configurations due to time-changes with simple clicks.
In these cases, photogrammetry or 3D laser scanning replaced, sided or integrated legacy documentation, creating at once a new set of information for forthcoming research and ideally new discoveries.
1. INTRODUCTION
1.1 Project background and ratio
Photogrammetry and 3D Laser Scanning are nowadays becoming more and more common entries in the lexicon of contemporary archaeologists as well as of other professionals. A quick search in the database “the Web of Science”, shows a consistent and fast growing use of such technologies in scientific papers of any field (“photogrammetry” and “laser scanning” had respectively 1κ3 and 1020 entries in 2007 versus 598 and 1924 in 2015). This is probably due to the fact that traditional landscape studies have been based on 2D images or flat representations of multi-dimensional space (i.e. maps, aerial photographs or satellite imagery); therefore, the need to explore the proper third dimension and combine it with the forth one, namely “time”, which is the ultimate clue of archaeological studies, inheritably geographically-based (Forte, 1997).
3D documentation (whether via photogrammetry or laser scanning) is a rapidly developing field of research. Ease of use of processing software and affordability of required equipment are often an important factor in the spreading of new methods or techniques, which are therefore quickly preferred to other more time-consuming approaches. If it is quite common the tendency to consider 3D as “novel” approach (iέeέ in comparison to more “traditional” methods of paper illustration), as a matter of fact the first reference to serious works in 3D for cultural heritage dates back to 1970s (Biek, 1974). What is actually still missing (despite the large literature on the topic, see for instance Frischer and Dakouri-Hild, 2008) is the availability of appropriate tools for the exploration and exploitation of three-dimensional data.
Cultural Heritage branches, such as archaeological documentation, historical building monitoring, conservation and restoration, landscape change-detection studies, are all heavily based on artefacts appearance and evolution across time. To do so, they historically take advantage of photographs and it is therefore easy to understand the link between Cultural Heritage photography and (today) digital photogrammetry. It is not just about recording historical artefacts (from landscape to movable objects), since 3D information can now be processed and produce new information on the detailed shape of a surface where colours can be hidden or replaced to highlight specific features (Cantoro, 2015).
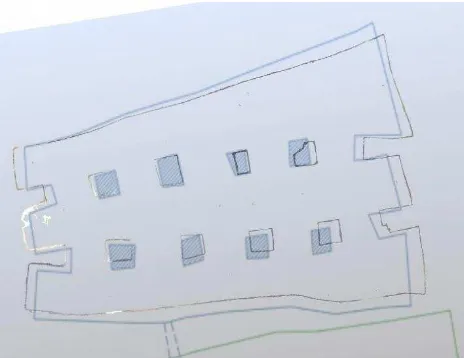
Indeed, when sufficient pictures are available for a given object they can be “translated” into three-dimensional point-cloud, giving birth to a copy (i.e. via 3D printing) of the original that can be used i.e. for display purposes in museums. Despite the possibility of scaled replicas of the originals, not much has been done so far in terms of 3D data exploitation. Oftentimes, minimal efforts are required to create an environment for a simple visual inspection of 3D digital object. Less time is instead devoted to the creation of tools or facilities for proper spatial analysis. It happens more and more frequently to see the use or the presentation of 3D models as ultimate mean of documentation in contrast to traditional “2D” architectural drawings without the explication of the added benefit of one method on another or without the justification of what can be seen or understood with one method over another (Figure 1).
Figure 1: Visual comparison of 2D drawing of the Roman cistern at Eleftherna (light blue; edited from Figure1 Tsigonaki and Yangaki, 2013, p. 432) and tomography from 3D laser scanning (black line of points; laser scanning section from G. Cantoro).
The undoubted value of 3D documentation consists in its being a tool, i.e. for damage assessment analysis, since with both photogrammetry and laser scanning one can get a precise, digital and measurable copy of the object under investigation, with the supplementary benefit derived from the repetition and comparison of time-series datasets. For example, the critical and complementary use of photogrammetry and laser can greatly assist CH experts in highlighting or numerically quantifying damages, changes or loss of material on a wall surface.
On the other hand, 3D data loses its importance and use in a research context when its visual aspect exceeds the documentary value. Indeed, a point-cloud is a medium through which a message is passed; quality and density of the 3D cloud does not necessarily improve the value and volume of transmitted information. Furthermore, as for every broadcasting, a language or a transmission protocol needs to be set and shared between transmitter and receiver.
The effort beneath the projects presented here goes in this direction: to provide the user (receiver of the message/information) with the linguistic tools (namely an enriched web interface) for the “decryption” or simplification -and thus (ideally) underst-anding- of transmitted message (the point-cloud associated with archaeologically relevant information). Occasions for the presentation of such a critical approach are the recently funded project “Water in Crete” for the 3D digital ground documentation of water-related cultural heritage of the major Greek island, and the WEB-GIS of the first Aerial Archaeological Survey over Crete, Greece.
2. 3D GROUND DOCUMENTATION
In the framework of the Programmatic Contract between the General Secretariat of Research and Technology and the Foundation for Research and Technology Hellas under the framework of the Hellenic Republic and Siemens Settlement Agreement, a project has been set up at the GeoSat ReSeArch lab, Institute for Mediterranean Studies (FORTH) in collaboration with the Eforate of Classical Antiquities of Rethymno (protocol number 7080/2015 of the Eforate), Crete (Greece). The project consists in accurate, non-invasive and three-dimensional documentation of archaeological artefacts of Crete related with public water management heritage.
A list of Venetian and Ottoman fountains and ancient baths was compiled with items in need of monitoring or characterized by particular archaeological value. Those artefacts have been 3D scanned with different technologies with the perspective of creating a shared database to be used by experts and general public for research or touristic purposes.
Certainly, the complete and three-dimensional documentation of standing monuments in a touristic place is not often an easy task. The narrow roads in which some of the investigated monument are located imposed specific strategies for data acquiring and for minimizing the inconvenience for the potential visitors. The most paradigmatic and popular between these artefacts in Rethymno is the Rimondi Fountain, located in a small square in the old town, often mandatory passage for all visitors moving between the seaside and the characteristic buildings and roads of the city.
Up to now (the project will conclude in March 2017), fourteen monuments have been fully documented: five only with digital photogrammetry (namely Nikiforou Foka Fountain; Prevelaki; Panou Kwronaiou; Patriarxou ύriroriouν “Troumpa” tou Koumpe), one only with laser scanner for poor light conditions and difficulties to illuminate it properly (Roman cistern at Elertherna, Figure 1) and the others (Rimondi fountain; Valinte Tsami; Patelarou; Kara Mousa; Igoumenou Gavriil; Roussospiti; Foteinos; Episkopi) with photogrammetry and 3D laser scanning.
In all cases a total station and a differential GPS was also employed to assure a correct scale and orientation in space and the proper positioning of the final model in the available cartography. Simple targets (normally 6 to 20, according to the complexity of the structure, black and white chessboard grids, were positioned with removable blue-tack in specific location of the surface to be documented. These targets where then measured with Total Station and referred to known GPS points. A set of photographs where then taken from multiple angles with a professional calibrated camera. A 3D laser scanning was then undertaken of the same area, using multiple stations according to the concavities and convexities of the surface. After this phase, targets were removed and a new set of images was collected in order to obtain a clean colour-texture of the surface as final result. The employed targets were such that the laser scanner could recognize them and use them for faster alignment between scans. The absolute coordinate of such automatically recognized targets could be used in photogrammetric software for orientation, scaling and geo-referencing. Following this procedure, the point-cloud derived from photogrammetric processing and the one from the laser scanner could be accurately overlaid one on the other and compared.
This easy and repeatable procedure allowed also, as side product, to assess the accuracy of photogrammetry in comparison with terrestrial laser scanning. Paradigmatic example is the result of such comparison on the Kara Mousa fountain, considering the complexity of the building itself for both photogrammetry and laser scanning. In such a case, using the laser scanner as benchmark and using only the automatically measured targets for alignment, the cloud-to-cloud comparison resulted in a very low error, with the largest majority of points being less than 1-2 mm apart (Figure 2).
Figure 2: KaraMousa, differences between the laser scanner and the photogrammetric point-cloud. Despite the complexity of the architecture, the error is below 3mm (red) on the rooftop and around the building, which was hardly accessible and mostly covered from a closeby three or grass, and mostly between 1 and 2mm (blue and green).
Fundamental part of the project consisted in the creation of a custom-made platform for sharing the results with the community. The constructed web-interface
(http://photogrammetry.ims.forth.gr/siemens) was chosen
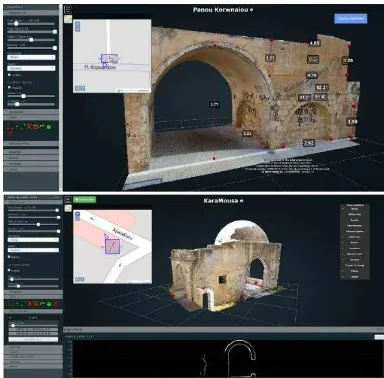
between several alternatives, having in mind the simplicity of use (and installation), the broad range of available intuitive tools and the possibility to run on any modern browser without the need of any special software or plugin. Using the Potree API (Schütz, 2015), webpages can show dense point-clouds (at variable intensity according to the velocity of internet connection of the visitor) in a user-friendly environment. Furthermore, some pre-set tools allow the user to take measurements and sections from the 3D model for research needs (Figure 3). A small map (displayed on top left of the screen as OpenLayers image, Schaub, 2016) shows also the exact location of the artefacts in the city so that interested audience can decide to pay a visit to better appreciate details.
Figure 3: Two examples of possible measurements and analyss on the web-portal of “Water in Crete”ν Ottoman fountain “Panou Koronaiou” (on top) with linear and area measurements and Kara Mousa (bottom) with a cross section (red line on the cloud) and its profile representation.
Furthermore, each 3D model is linked to a web-GIS of archaeological sites of Crete (result of DigitalCrete projects by the hosting institution, see Sarris et al., 2008) so that historical and archaeological information (Figure 4) can be visualized as complement of the digital model.
Figure 4: Example of the historical information for one specific artefact extracted (and provided as link in every point-cloud page) from the Digital Crete project web-database.
In this way, all the presented 3D model can be explored, measured, sectioned, visualized from different angles and comparison can be undertaken between their laser scanning and photogrammetric representation (when both available) with ease. Furthermore, items can be visualized in their geographical context and with all the available archaeological information (chronological framework, inscriptions information where available, bibliographic references and protection and conservation status as Cultural Heritage).
3. AERIAL ARCHAEOLOGICAL SURVEY ONLINE
In 2012 an extensive aerial survey has been undertaken in Crete for monitoring the natural conditions of archaeological sites (Cantoro, 2017). In the specific project, thousands of oblique photographs have been acquired from a touristic airplane (Cessna 172) with professional DSLR camera. The project started from the assumption that the visualization of the position of known cultural heritage sites and their assessment of natural or human-driven endangerment (Chalikias and Cantoro, 2014) is definitely beneficial and often a good starting point for further valorising or protection actions. At the same time, it was clear that large scale historic/archaeological artefacts (such as abandoned temporary villages, castles, field boundaries, retaining walls or water management systems) are even difficult to map from the ground when located in impervious spots. Five site-oriented flights were therefore planned with the aim to “freeze the moment” and document the actual condition of specific areas. When possible, photographs were collected with a level of overlapping that could allow a photogrammetric 3D reconstruction of areas of interest (i.e. mountains, gullies, prominent features). Flights resulted in a wealthy amount of information in more than 2500 still pictures.
The thousands of oblique photographs have been processed in separate steps such that each still picture has been:
1. geotagged, thanks to a handheld GPS data logger; The International Archives of the Photogrammetry, Remote Sensing and Spatial Information Sciences, Volume XLII-2/W3, 2017
2. grouped with others, based on the GPS point and sequence proximity;
3. processed with photogrammetric software for the production of draft geotiffs then accurately geo-positioned; 4. georeferenced one by one based on the positioned geotiff (Figure 5);
5. uploaded to a custom-made web-GIS as footprint polygons enriched with extra information (such as shooting point coordinate, camera pitch and yaw, author of the photograph and funding sponsor) and linked to the relative 3D point-cloud.
Figure 5: Footprints and flight's path (each in different colour) of the Aerial Archaeological Survey in Crete on the online platform
(accessible at the address
http://photogrammetry.ims.forth.gr/webgis/).
For the specific purpose of the project (step 4 above), the free software AutoGR-Toolkit (developed at the facilities of the GeoSat ReSeArch lab, see Cantoro, 2015) have been fully exploited. This set of tools allows for an automatic, fast and accurate georeferencing of images with the use of image matching algorithms (i.e. SIFT, ORB, AKAZE and others, see Cantoro, 2012 and Appendix) and open source libraries (i.e. GDAL, OpenCV, Proj4 and more). Indeed, one of the module of this Toolkit can produce in no time (depending on the computer performances) hundreds of matching points between two images (that can be used to georeferenced aerial photographs on top of given orthophotos or maps) and vectorial footprints ready for GIS applications.
All the information extracted by photogrammetric processing of images, such as the camera orientation in space and the shooting position and altitude, are made available through the platform so that more advanced search can be undertaken on specific area. For example it may be possible to filter a subset of images for a given area based on camera tilting (in order to exclude extremely oblique images) or altitude (to get higher resolution with images closer to the ground).
The dataset, enriched with preliminary archaeological photointerpretation, has been then organized in a webGIS platform for the expert community, so that interested scholars may easily contribute to enrich the material with archaeological content and benefit from a bird-eye view over their area of interest. Furthermore, a specific spatial query (Figure 6) allows the user to visualize if archaeological sites have been previously recognized in the area covered by the footprint and link to the specific information and bibliography (as for the previous presented project).
Figure 6: Screenshot of the WEB-GIS of the Aerial Archaeological Survey. Spatial queries automatically executed on every photo-footprint return the availability of known archaeological sites in Digital Crete database (in this example, one site -namely Malia, Heraklion- has been identified and link to specific forms is provided in a next screen.
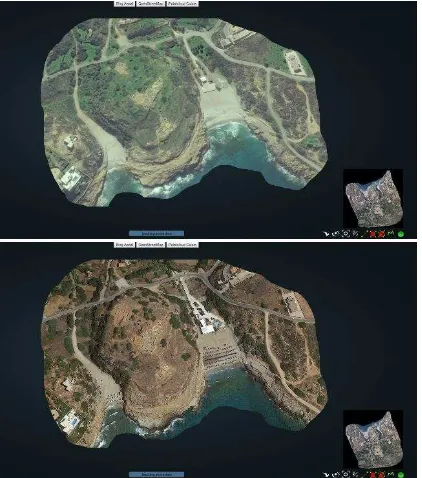
As final step of the project and taking full advantage of the Potree library (Figure 7), 3D models from aerial photographs have been uploaded and linked to the aforementioned photo-footprints. Of great importance in such context is the possibility to interchange the point-cloud colours with satellite imagery from OpenLayers. This approach makes it possible not only to appreciate the photographed archaeological site in their three dimensions, but also allows to explore different landscape configurations due to time-changes.
Figure 7: 3D point-cloud with two different colour textures (from original aerial photographs and from Bing provided image), thanks to the combination of Potree and OpenLayers libraries (elaborated on Proof of Concept provided by Potree demo website).
CONCLUSIONS
The ground and aerial documentation projects presented here were moved by the need of presenting the archaeological The International Archives of the Photogrammetry, Remote Sensing and Spatial Information Sciences, Volume XLII-2/W3, 2017
community with meaningful information related to the specific artefacts represented in their three (and four, where time-change could be added) dimensions.
Although they may seem like simple visualization and not real analytical tools, the customized online platforms constitute a first step in the creation of appropriate tools to forward the research from 2D to 3D in cultural heritage. In contrast to what stated by Miller and Richards, according to whom "to date the catalyst for visualization in archaeology has not been the search for improved techniques for discovering new knowledge but rather for improved ways for presenting existing knowledge to the public."(Miller and Richards, 1995), the proposed approach tried to provide and make accessible tools for interpretation and understanding of cultural heritage. The same as theorized in early 2000 by Barceló with the term “manipulation”, referring to a platform of experimentation in which a “geometric, visual language” is used instead of words to describe and explain archaeological data (Barceló, 2001, p. 225). Following on what he also argues, namely that “the main reasons for visual models is to help to see what the data seem to say and to test what you think you see”, the presented projects had the ambition to propose a possible approach of sharing data and providing what is known and arguably considered as biased legacy information, with what is the pure geometrical appearance and data of the object of study.
More tools are going to be proposed in the presented project websites, because, as said above, they have to be considered as platforms for experimentation and manipulation of data.
ACKNOWLEDGEMENTS
The water-related archaeological monuments of Crete have been 3D documented (with laser scanner and digital photogrammetry) in the framework of the Programmatic Contract between the General Secretariat of Research and Technology and the Foundation for Research and Technology Hellas under the Siemens Settlement Agreement with the Hellenic Republic, in collaboration with the Eforate of Classical Antiquities of Rethymno (protocol number 7080/2015 of the Eforate), Crete (Greece). Special thank goes to Lemonia Argyriou, Nikos Papadopoulos, Cristina Manzetti and Maria Vakondiou for their precious help in data collection. Thanks also to Angelos Chliaoutakis and Aris Kidonakis for their support for the web-interface.
The web-GIS of photographs from the first aerial archaeological survey over Crete is the result of an initial financial support from ArchaeoLandscapes Europe project, then prosecuted and improved at the facilities of the GeoSat ReSeArch Lab (IMS-FORTH). The web interface and the background functionalities have been developed and customized by Angelos Chliaoutakis.
REFERENCES
Barceló, J.A., 2001. Virtual reality for archaeological explanation. Beyond “picturesque” reconstructionέ Archeologia e Calcolatori XII, 221–244.
Biek, L., 1974. Progress with LERNIE, in: Wilcock, J.D., Laflin, S. (Eds.), Proceedings of the Annual Conference Organised by the Computer Centre University of Birmingham. Presented at the Computer Applications in Archaeology, Birmingham, pp. 59–63.
Cantoro, G., 2017. Handling hundreds of aerial images without ground references: archaeological photointerpretation in the era of digital photogrammetry. Archeologia Aerea.
Cantoro, G., 2015. Aerial Photogrammetry: when Archaeology meets SIFT, in: Ivanisevic, V., Veljanovski, T., Cowley, D., Kiarszys, G., Bugarski, I. (Eds.), Recovering Lost Landscape. Institute of Archaeology, Belgrade, Belgrade, Serbia, pp. 117– 128.
Cantoro, G., 2012. Speeding up Georeferencing with Subpixel Accuracy, in: Archaeology in the Digital Era Volume II. Presented at the 40th Conference on Computer Applications and Quantitative Methods in Archaeology, Amsterdam University Press, Southampton, pp. 752–760.
Chalikias, K., Cantoro, G., 2014. Endangered Cretan Landscapes: Using Digital Applications and Geospatial Information for the Recording and Monitoring of Recent Landscape Transformation in Southeast Crete, in: Proceedings of the 1st CAA-GR Conference. Presented at the CAA-GR, GeoSat ReSeArch Lab IMS-FORTH, Rethymno, Crete (Greece), pp. 229–236.
Forte, M., 1997. Introduction, in: Forte, M., Siliotti, A. (Eds.), Virtual Archaeology. Re-Creating Ancient Worlds. Harry N. Abrams.
Frischer, B., Dakouri-Hild, A. (Eds.), 2008. Beyond illustration: 2d and 3d digital technologies as tools for discovery in archaeology. Archaeopress, Oxford.
Miller, P., Richards, J., 1995. The Good, the Bad, and the Downright Misleading: Archaeological Adoption of Computer Visualisation, in: Huggett, J., Ryan, N. (Eds.), Proceedings of the Computer Applications and Quantitative Methods in Archaeology. Presented at the Computer Applications and Quantitative Methods in Archaeology (CAA94), Tempus
Reparatum, Oxford, pp. 19–22.
doi:http://dx.doi.org/10.15496/publikation-3402
Sarris, A., Trigkas, V., Papadakis, G., Papazoglou, M., 2008. A web-GIS approach to cultural resources management in Crete: the digital archaeological atlas of Crete, in: Posluschny, A., Lambers, K., Herzog, I. (Eds.), Layers of Perception. Proceedings of the 35th International Conference on Computer Applications and Quantitative Methods in Archaeology. Presented at the Computer Applications and Quantitative Methods in Archaeology (CAA2007), Berlin, pp. 1–6.
Schaub, T., 2016. OpenLayers Library [WWW Document]. URL https://openlayers.org/ (accessed 1.10.17).
Schütz, M., 2015. Potree API - www.potree.org.
Tsigonaki, C., Yangaki, A., 2013. Archaeological research at the Sector II of the Cistern of Eleftherna and the ceramic finds (Οδ αλχαδκζκγδεΫμ Ϋλευθεμ κυ ΤκηΫα ΙΙ δμ ειαηεθΫμ βμ ζετγελθαμεαδβηαλ υλέα βμεελαηδεάμ), in: Archaeological Work of Crete (Αλχαδκζκγδεσ Έλγκ Κλά βμ) 3, University of Crete, Greece, Rethymno, Crete (Greece), pp. 429–448. The International Archives of the Photogrammetry, Remote Sensing and Spatial Information Sciences, Volume XLII-2/W3, 2017