HOUSEDIFF: A MAP-BASED BUILDING CHANGE DETECTION
FROM HIGH RESOLUTION SATELLITE IMAGERY
USING GEOMETRIC OPTIMIZATION METHOD
N. Ishimaru a, *, K. Iwamura a, Y. Kagawa b, T. Hino b a
Hitachi, Ltd., 1-18-13, Soto-Kanda, Chiyoda-ku, Tokyo, Japan
–
(nobuhiro.ishimaru.yu, kazuaki.iwamura.wx)@hitachi.com
bHitachi Solutions, Ltd., 4-12-7, Higashishinagawa, Shinagawa-ku, Tokyo, Japan
–
(yoshiaki.kagawa.yy, takashi.hino.ea)@hitachi-solutions.com
KEY WORDS: Change Detection, Updating, Building, Urban, High resolution, Quickbird
ABSTRACT:
This paper presents a novel structural image analysis method based on geometric optimization techniques towards automatic building change detection. The aim of this method is to efficiently detect the changes of various buildings such as small houses and houses with complex roof in an urban area from high resolution satellite imagery by comparing with spatial database (maps). The previous research has indicated of the effectiveness of a map-based building change detection approach, and further investigation suggests the following three problems; (1) the large diversity of building types, roof shape, roof materials, illumination condition and shadow, (2) the difficulty of imagery and maps matching which normally leads to considerable position error, (3) the capacity of extracting various types of newly-built buildings. To solve these problems, we propose a new geometric optimization method which consists of the following two steps; (1) the building recognition based on a combinatorial optimization method for optimal building boundary extraction, (2) the newly-built building extraction based on an optimal building hypothesis search method. The experimental results showed that the detection rate was approximately 89% for existing and changed buildings, and approximately 83% for newly-built buildings. These results demonstrate the effectiveness of the proposed geometric optimization methods to integrate bottom-up and top-down analysis. By combining the locally detected image features with consideration of regional contexts from map, our method can achieve highly accurate building change detection in urban area. The method has been applied to a building change detection service named "HouseDiff" and succeeded in assisting users.
1. INTRODUCTION
Timely and precise update and maintenance of spatial database has been a challenge for the practical GIS applications such as land use management and disaster management. As shown in advanced examples of QuickBird, WorldView-1, and WorldView-2 from DigitalGlobe, the recent development of high resolution satellite in image accuracy and coverage, and short observation repetition makes it an ideal data source for the purpose of automatic building change detection.
This paper presents a novel structural image analysis method based on geometric optimization techniques towards automatic building change detection. The aim of this method is to efficiently detect the changes of various buildings such as small houses and houses with complex roof in an urban area from high resolution satellite imagery by comparing with spatial database (maps). Several different approaches have been proposed for building change detection as well as map feature extraction, such as feature-based (Kazama et al, 2010; Guo et al, 2010), rule-based (Ishimaru et al, 2005), model-based (Fisher et al, 1998; Huertas et al, 1998), and map-model-based (Ogawa et al, 1999). The previous research, map-based approach, has indicated of the effectiveness of top-down (model-driven) image analysis approach using map polygons as building models. The simulated high resolution satellite imagery was applied in the research, and our further investigation using the actual high resolution satellite imagery suggests the following three problems. First is the large diversity of building types which range from the simple
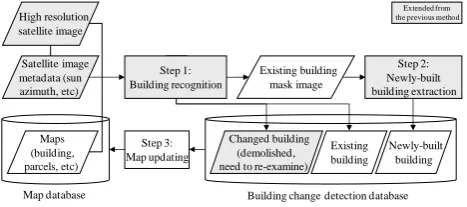
buildings with dark flat roof to the complex buildings with various types of roof shape, roof materials, illumination condition and shadow. Second is the difficulty of imagery and maps matching which normally leads to considerable position error especially in the case of using simplified map. Third is the capacity of extracting various types of newly-built buildings. To solve these problems and improve the recognition accuracy, we propose a new geometric optimization method which consists of the following two steps. The first step is the building recognition based on a combinatorial optimization method for optimal building boundary extraction so as to solve the first and second problems. The second step is the newly-built building extraction based on an optimal building hypothesis search method to solve the first and third problems. Figure 1 shows an overall framework of a map-based building change detection algorithm.
Step 2: Newly-built building extraction
Extended from the previous method
Satellite image metadata (sun azimuth, etc) High resolution satellite image
Maps (building, parcels, etc)
Existing building
Newly-built building
Map database Building change detection database
Step 3: Map updating
Existing building mask image
Changed building (demolished, need to re-examine) Step 1:
Building recognition
Figure 1. Framework of a map-based building change detection algorithm
By matching and comparing imagery with maps to automatically identify a building status on maps as "existing", "changed (demolished and need to re-examine)" or "newly-built", this method realizes a service which provide "building change detection information" to users. The service named "HouseDiff" allows users to investigate only the parts of imagery that are most likely changed, which will lead to the reduction of cost and labour.
The remainder of this paper will focus on the two steps extended from the previous method (Ogawa et al, 1999), which are, the building recognition (Step 1) in chapter 2, and the newly-built building extraction (Step 2) in chapter 3. Chapter 4 provides the experimental results that demonstrate the validity of the proposed method and discussion. Finally, chapter 5 gives a conclusion.
2. BUILDING RECOGNITION
The first step is the building recognition. It determines whether the buildings still exist by matching the new imagery and the old map. This step focuses on the boundaries of buildings to evaluate the difference between imagery and maps. The boundaries can be extracted effectively if map figures are utilized as a guide of those presence, position, and direction. We regard the building boundary extraction as a combinatorial optimization problem of light-dark and dark-light edge segments along the building map figure using graph theory known as the shortest path search method. The shortest path is calculated by Dijkstra method using weighted undirected graph of edge segments. The evaluation of the difference between imagery and map figures is done by an energy cost of the shortest path search calculation considering the edge quality information (i.e. distance from map figure line, edge power, edge continuity, and edge presence). The optimization method allows to resolve the large and complex combinatorial problem and to extract the optimal boundaries with the acceptable position error and various types of target buildings (i.e. brighter than background, darker than background, and its
combination). Furthermore, it becomes possible to extract a building with weak boundaries due to similar materials of roof and background, and partly occluded by trees.
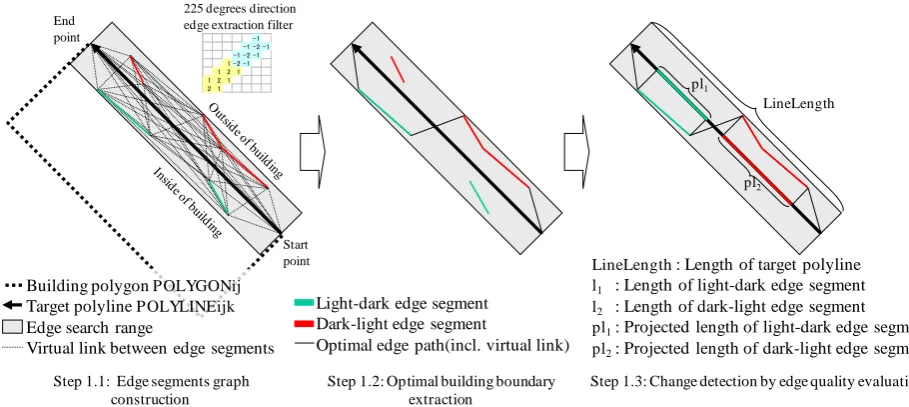
Figure 2 and 3 show the algorithm outlines. Figure 4 shows an example of results that confirmed the validity of this algorithm.
begin
Step 1.1: Edge segments graph construction
(a) For each parcel PARCELi in the map; For each building polygon POLYGONij in the parcel; For each polyline POLYLINEijk in the building polygon;
(b) Extract candidate edge segments along the polyline (c) Extract vector data (both end point) for each edge segment, and calculate its weight (equation (1))
(d) Construct a weighted undirected graph of edge segments (e) Add virtual links to the graph to connect all edge segments, and calculate those weight (equation (1)) with penalty factor (weighted twice)
Step 1.2: Optimal building boundary extraction
(a) Search the shortest path from POLYLINEijk start point to POLYLINEijk end point using the weighted undirected graph by Dijkstra method (combinatorial optimization of edge segments by minimizing energy cost)
Step 1.3: Change detection by edge quality evaluation
(a) Calculate the edge quality evaluated value EdgeValue of each optimal building boundary (equation (2))
(b) Calculate the edge quality evaluated value EdgeValueAll of whole building by a linear weighted combination of EdgeValues (equation (3))
(c) Evaluate the EdgeValueAll and detect the change (equation (4))
(d) Output the detected change information (demolished, need to re-examine)
end
Figure 2. Optimal building boundary extraction algorithm
-1 -1 -2 -1 -1 -2 -1 1 -2 -1 121 121
21 pl1
pl2
LineLength
Light-dark edge segment Dark-light edge segment
Optimal edge path(incl. virtual link)
225 degrees direction edge extraction filter
LineLength : Length of target polyline l1 : Length of light-dark edge segment l2 : Length of dark-light edge segment pl1: Projected length of light-dark edge segment pl2: Projected length of dark-light edge segment
Step 1.1: Edge segments graph construction
Step 1.2: Optimal building boundary extraction
Step 1.3: Change detection by edge quality evaluation
End point
Start point
Building polygon POLYGONij Target polyline POLYLINEijk Edge search range
Virtual link between edge segments
Figure 3. Optimal building boundary extraction
(a) (b) (c) (d) (e)
Figure 4. Example of optimal building boundary extraction result. (a)(b)(c)(d)Extracted edges. (e)Extracted building boundary. (green=light-dark direction edge, red=dark-light direction edge, color brightness=edge strength)
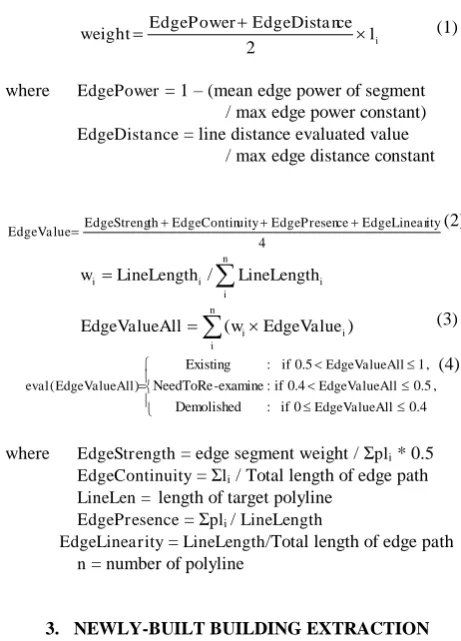
The edge evaluated values provide scores between 0 and 1, and are defined as follows (see also Figure 2 and 3):
i EdgeDistance = line distance evaluated value
/ max edge distance constant
4
LineLen = length of target polyline EdgePresence = Σpli / LineLength
EdgeLinearity = LineLength/Total length of edge path n = number of polyline
3. NEWLY-BUILT BUILDING EXTRACTION
The second step is the newly-built building extraction. It uses a new optimal building hypothesis search method based on a general building model considering roof shapes and relation between sun azimuth and the shadow of building. We investigate the building hypothesis by using the most fundamental shape of buildings: rectangular. The optimal building hypothesis search method is realized as a process to generate a number of building hypotheses, repeat hypotheses testing and modification, and aggregate hypotheses. The process comprises generating combinations of building candidate regions corresponding to roof surfaces, rectangular fitting, and rule-based region merging, respectively. The optimal building hypothesis search method allows efficient
extraction of complex buildings consisting of multiple roof surfaces such with bright or dark colored roof surface, or its combination.
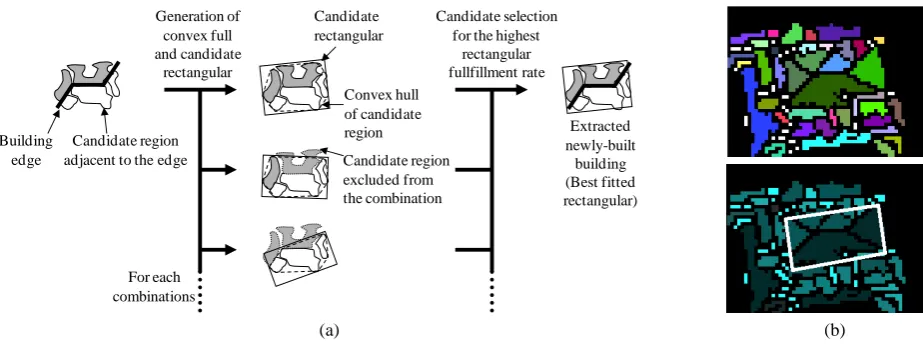
Figure 5 shows the candidate region types. Figure 6 through 8 and Table 1 show the algorithm outlines. Figure 8(b) shows an example of results that confirmed the validity of this algorithm.
MIDDLE
Figure 5. Candidate region types for newly-built building extraction (solid line=candidates, dashed line=non-candidates)
begin
Step 2.1: Building candidate region generation (a) Detect edges using the 8-directional edge filter (b) Mask the edge regions/pixels on the image
(c) Mask the other regions/pixels not corresponding to the buildings (i.e. existing building, its shadow, tree, road, etc.) (d) Generate building candidate regions by region segmentation except the masked pixels
Step 2.2: Building hypotheses generation (region combinations by the sun and shadow context analysis)
(a) Select two directional edges which are the most orthogonal to the sun vector as building candidates
(b) Generate an adjacent candidate regions list for each building candidate edge (describing region type in Figure 5) (c) Generate instances of rectangular building model (generating combinations of the candidate edge and the candidate regions, and calculating initial fulfillment rate by rectangular fitting)
Step 2.3: Optimal building hypothesis search
(a) Sort the rectangular building model instances in descending order of the fulfillment rate. For each instance; (b) Aggregate hypotheses (rule-based region merging considering the spatial relationship among instances,Table 1) (c) Hypotheses testing and modification (rectangular fitting, Figure 8)
(d) Repeat Step 2.3 until convergence Step 2.4: Post-processing
(a) Remove result(s) with low fulfillment rate (< 0.4) (b) Output the extracted newly-built building information end
Figure 6. Newly-built building extraction algorithm Extracted weak edge.
Extracted edge partly occluded by trees.
Step 2.1: Building candidate region generation Step 2.2: Building hypotheses generation
Rectangular building model INSTANCE C Rectangular
building model INSTANCE A
Rectangular building model
INSTANCE B
Step 2.3: Optimal building hypothesis search
Candidate edge A
Candidate edge B
Candidate edge C
Region merge
Rectangular building model
INSTANCE C Rectangular
building model INSTANCE A Connection
Step 2.4: Post-processing
Unification
Initial rectangle
Extracted building Edge selection
in the orthogonal direction to the sun vector
Edge at 90 dgrees Edge at 135
degrees
Link
Repeat until convergence
Evaluate the result and finalize process
Rectangular building model
INSTANCE B
Candidate region
Initialize instances for each candidate
edge Candidate region
Figure 7. Newly-built building extraction
Rule type Inclusion Connection Unification
Geometry relationship
contain / inside / covers / equal touch / adjacent overlap / intersect
Merge rules
・ Merged to the one which includes (the other)
・ Merged to the any when the range is equal
・ Merged to the BRIGHT dominant one only when the rectangular fulfillment rate improves
・ Merged to the one with a higher rectangular fulfillment rate ・ Merged to the one with a longer
edge when rectangular fulfillment rate is the same
Examples
Merge
BRIGHT domina nt combina tion
MIDDLE domina nt combina tion
BRIGHT
BRIGHT MIDDLE
MIDDLE
Merge MIDDLE
MIDDLE
BRIGHT
BRIGHT Merge
Table 1. Rule-based region merging (bold line=building candidate edge)
Generation of convex full and candidate
rectangular
Building edge
Candidate region adjacent to the edge
For each combinations
Convex hull of candidate region Candidate rectangular
Candidate region excluded from the combination
Candidate selection for the highest
rectangular fullfillment rate
Extracted newly-built
building (Best fitted rectangular)
(a) (b) Figure 8. Rectangular fitting. (a)Algorithm.
(b)Example of rectangular fitting result (5 or 41 regions selected, rectangular fulfillment rate 0.45).
4. EXPERIMENTAL RESULTS AND DISCUSSION
4.1 Experimental Results
The experiments have been performed using actual high resolution satellite imagery and experimental maps. The experimental area is located in Hamamatsu city, a residential area in Shizuoka Pref., Japan. The satellite imagery is panchromatic QuickBird imagery (geometrically corrected 0.7m resolution). The map is digitized manually. Approximately 5% (23 of 490) of building polygons in the map are removed randomly to evaluate the newly-built building extraction accuracy. The result is shown in Figure 9 and indicates that the changes of small buildings (i.e. 10m wide) could be detected while using high resolution satellite imagery which spatial resolution is relatively low compared with that of aerial photography, especially in dense urban contexts. 4.2 Discussions
4.2.1 Overall accuracy: Table 2 shows building detection accuracy. The meaning of "changed" buildings includes "demolished" and "need to re-examine" buildings.
For existing and changed buildings, the detection rate was approximately 89%. About half of the 54 misdetections were caused by digitizing errors of the experimental map figures (they looked almost changed). This result suggests that even a possibility of a small change can be detected by this method. Misdetections were caused by buildings with highly dark colored roof or very complex roof structure (i.e. half-hipped roof, monitor roof). Meanwhile, there were a few misdetections of buildings with simple flat roof. The results indicate the efficiency of the optimal boundary extraction with the acceptable position error and various types of buildings. Furthermore, the ability of extracting buildings with weak edges by similar materials of roof and background, and partly occluded by trees are confirmed. For newly-built buildings, the detection rate was approximately 83%. Misdetections were caused by buildings located too closely to other buildings so that the region segmentation process failed, and colored too dark to see even with human eyes. False detections were caused by only cars and vegetation. The results indicate that the complex buildings consisting of multiple roof surfaces with bright or dark colored, or its combination, were extracted efficiently.
(a) (b) (c)
(d) (e) (f)
Figure 9. Experimental result of building change detection. (a)QuickBird satellite imagery (Hamamatsu city, Japan). (b)Experimental map (buildings, parcels). (c)Overlaid imagery and map. (d)Detected results. (e)Changed and newly-built
buildings. (f)Updated map. (yellow=existing, red=demolished, blue=newly-built, green=need to re-examine)
©DigitalGlobe ©DigitalGlobe
©DigitalGlobe ©DigitalGlobe
Detection rate
Misdetection rate
False detection rate Existing 89% (=436/490) 11% (=54/490) -
Changed - - 11% (=54/490)
Newly-built
83% (=19/23) 17% (=4/23) 35% (=8/23) Table 2. Overall accuracy of the result using proposed method
4.2.2 Comparison with previous method: Both Table 3 and Figure 10 show a comparison of the result by the proposed and previous methods. The results indicate that proposed method improves the accuracies in both existing/changed building recognition and newly-built building extraction. For the existing and changed building recognition, in the previous method, when the region segmentation process failed, the buildings tended to be misdetected as the region of the buildings was expanded. However, in the proposed method, buildings were correctly detected as existing buildings, even the weak edges can be extracted as a boundary if they locate in the right position as well as right direction. For the newly-built building detection, in the previous method, a lot of parking or open space whose boundary was similar to nearby buildings was extracted as candidate regions. However, in the proposed method, while the types of target buildings were extended to those with combination of bright and dark colored roofs or those with different shapes from nearby buildings, the detection results were reasonably stable and reliable.
Those results are much better than those of the previous method while using actual high resolution satellite imagery and detection of various types of target buildings. Therefore, the validity of the proposed method was confirmed. The proposed method has been applied to an actual building change detection service named "HouseDiff" (Carroll, 2001) as a part of recognition engine, and succeeded in assisting users such as local governments to maintain highly accurate, up-to-date building data.
(a) (b)
Figure 10. Comparison of results. (a)The previous method. (b)The proposed method. (yellow=existing, red=changed,
blue=newly-built) Previous
method
Proposed method
Improve-ment rate Existing (correct detection) 32 35 +9.4%
Changed (false detection) 4 1 -75.0%
Newly-built(false detection) 16 1 -93.8% Table 3. Result assessment of previous and proposed methods
5. CONCLUSIONS
This paper has presented a map-based building change detection algorithm using geometric optimization method, which consists of the building recognition based on a combinatorial optimization method and the newly-built building extraction based on an optimal building hypothesis search method. The experimental results indicate the effectiveness of the methods to integrate bottom-up and top-down analysis to achieve highly accurate building change detection in urban area, and confirmed the validity of the method while using actual QuickBird high resolution satellite imagery and detection of various types of target buildings. The method was applied to an actual building change detection service named "HouseDiff" and succeeded in assisting users. Further research should include improvement of the robustness of the algorithms by applying pattern recognition and machine learning methods to expand the HouseDiff service widely.
REFERENCES
Carroll, R. W., 2001. Detecting Building Changes through Imagery and Automatic Feature Processing. In: Proc. of 2001 URISA Annual Conference, California, USA.
Fischer, A., Kolbe, T. H., T., Lang, F., Cremers, A. B., Förstner, W., Plümer, L., and Steinhage, V., 1998. Extracting Buildings from Aerial Images using Hierarchical Aggregation in 2D and 3D. Computer Vision and Image Understanding, 72(2), pp.185-203.
Guo, T., and Kazama, Y., 2010. Towards automation of building damage detection using WorldView-2 satellite image: the case of the Haiti earthquake. In: Proc. of Earth Resources and Environmental Remote Sensing/GIS Applications, SPIE Vol.7831, 783108.
Huertas, A., and Nevatia, R., 1998. Detecting Changes in Aerial Views of Man-Made Structures. In: Proc. of Sixth International Conference on Computer Vision (ICCV '98), pp.73-80.
Ishimaru, N., and Iwamura, K., 2005. An integrated framework for map generation by analyzing hyperspectral imagery. In: Proc. of IEEE International Geoscience and Remote Sensing Symposium (IGARSS '05), Vol.6, pp.3772-3775.
Kazama, Y., and Guo, T., 2010. House damage assessment based on supervised learning method: case study on Haiti. In: Proc. of Image and Signal Processing for Remote Sensing XVI, SPIE Vol.7830, 78301F.
Ogawa, Y., Iwamura, K., and Nomoto, Y., 1999. A map-based approach for extracting buildings from aerial images. In: The International Archives of Photogrammetry and Remote Sensing, Onuma, Japan, Vol.XXXII, Part.5-3W12, pp.29-36.
ACKNOWLEDGEMENTS
The authors would like to thank Dr. Tao Guo from Hitachi Central Research Laboratory for many and valuable discussions and comments. The authors also would like to thank Mr. Fuminobu Komura for his kind support and encouragement.