A NEW APPROACH FOR SUBWAY TUNNEL DEFORMATION MONITORING
:
HIGH-RESOLUTION TERRESTRIAL LASER SCANNING
Li Jian a, Wan Youchuan a, , Gao Xianjun a
a
School of Remote Sensing and Information Engineering, Wuhan University,129 Luoyu Road, Wuhan, China, [email protected],( ychwan, juxgao) @whu.edu.cn
Commission V, WG V/3
KEY WORDS:Terrestrial Laser Scanning, deformation monitoring, subway tunnel, high precision, moving least squares
ABSTRACT:
With the improvement of the accuracy and efficiency of laser scanning technology, high-resolution terrestrial laser scanning (TLS) technology can obtain high precise points-cloud and density distribution and can be applied to high-precision deformation monitoring of subway tunnels and high-speed railway bridges and other fields. In this paper, a new approach using a points-cloud segmentation method based on vectors of neighbor points and surface fitting method based on moving least squares was proposed and applied to subway tunnel deformation monitoring in Tianjin combined with a new high-resolution terrestrial laser scanner (Riegl VZ-400). There were three main procedures. Firstly, a points-cloud consisted of several scanning was registered by linearized iterative least squares approach to improve the accuracy of registration, and several control points were acquired by total stations (TS) and then adjusted. Secondly, the registered points-cloud was resampled and segmented based on vectors of neighbor points to select suitable points. Thirdly, the selected points were used to fit the subway tunnel surface with moving least squares algorithm. Then a series of parallel sections obtained from temporal series of fitting tunnel surfaces were compared to analysis the deformation. Finally, the results of the approach in z direction were compared with the fiber optical displacement sensor approach and the results in x, y directions were compared with TS respectively, and comparison results showed the accuracy errors of x, y, z directions were respectively about 1.5mm, 2mm, 1mm. Therefore the new approach using high-resolution TLS can meet the demand of subway tunnel deformation monitoring.
Corresponding author.
1. Introduction
With the development of laser scanning technique, its accuracy keeps enhancing. The single-point accuracy of phase laser scanner has reached 1mm, and which of the VZ-400 scanner from Riegl Company has reached 2mm. Because of this improvement, in the highly precise deformation monitoring fields, more projects trend to use laser scanner. If combining TLS and highly precise TS, the errors of laser scanner will be corrected and the observation accuracy will be further improved. This combination can be applied to some highly precise deformation monitoring in such fields as bridges, tunnels, high buildings, dams and so on. Additional measurements of deformation monitoring are carried out by exploring single-point triangulation to measure the coordinates of control points in different time. This monitoring method costs long observation time and intense labor, is poor in automatic aspects and is constrained by the layout of the control points, resulting in that it can only reflect the local deformation not the entire deformation and the observation accuracy is easily influenced by observation conditions. TLS can quickly acquire the entire point cloud information of the objects whose deformation will be monitored in a short time and then through processing data the entire deformation of these monitored objects can be analyzed. So this approach has become hot in deformation monitoring.
At present, some internal scholars have started such researches, but most of them are focused on the application of TLS to the deformation monitoring of those projects that require not very
point cloud segmentation method to extract suitable point from the point cloud acquired by TLS was employed to monitor the deformation of a 100 m long tunnel and improve the accuracy of deformation monitoring (Lindenbergh et al., 2005). A deformation of a cylindrical tunnel was monitored by firstly fitting the cylindrical model and then exploiting the statistical tests method to statistically analyze the deformation monitoring data of the tunnel (Van Gosliga et al., 2006).
According to these researches some problems existed in the deformation monitoring of tunnels by using TLS: firstly, because of lacks of some necessary control strategies, the registration accuracy of the point cloud data acquired in a few adjacent stations in the tunnel is a little low, so it needs to be improved; secondly, TLS can acquire magnanimity point cloud data causing that it is difficult to search out the homologous point in the scanning data acquired in different time, so there still is not a good approach to monitor dynamically just by using the original point cloud data. To solute the above problems, this paper proposed some solutions which combined the data acquired by TLS, TS and levels to register the data of adjacent stations and improve the registration accuracy.
2. The algorithm based on the normal vectors of point cloud
Because of the large amount of point cloud data, there is much redundancy information. Hence it is crucial to quickly extract reliable feature information from such dense point cloud data. This paper proposed a point cloud segmentation algorithm which can retain the feature of point cloud based on the variance of normal vectors of point cloud. This algorithm extracts the features of the point cloud according to the angle variance of the normal vectors of the point cloud, retains more points in those places where the feature is obvious but retains surfaces. Figure 1 illustrates the normal vectors of points on the curved surfaces.
Figure1. The normal vectors of points on the curved surfaces
Step 1 - Find the closest point to P, and assume it is Q, join P and Q to compose an edge of the first triangular surface. Step 2 - Traverse other k points closest to P (except Q), assume the traversal point is Q′, calculate each angle ∠QPQ′. Set an angle threshold and select the Q’ that corresponds to the shortest edge from those angles which satisfies the condition as one point of the first triangular surface (PQ’ are the points on clockwise direction, then continue searching the next triangle in the clockwise direction; Otherwise, the search will be carried on in the anticlockwise direction.
Step 4 - Then change the start edge to PQ’ and traverse the array in the direction which is given in the third step to find the next point that satisfies these conditions to construct the next triangle. Keep on this iteration calculation until all the triangular surfaces that satisfied the conditions are found and store them in an index array.
In this algorithm, the tangent plane of a point P is defined as a surface which is fitted by the N points closest to P, and a vertical line going through this point of the tangent plane is recorded as the normal vector of this point. Because all the points adjacent to P may not be located in one plane completely, it is necessary to convert its tangent plane to minimize the eigenvalues of Cv and their responsible eigenvectors. Then the eigenvector which is responded to the minimum positive eigenvalue can reflect approximately as the vertical line of the tiny tangent plane or the normal vector of this point.
The angle of the normal vectors of adjacent points can be located on the edge of the features. Then through setting some suitable thresholds point cloud can be divided into different segments. The concrete implementation steps are illustrated as following: continue the above three steps. Among the K points, if there is any point which is in other classes different from the class
Step 5 - Cluster the point cloud data which have been classified already again, and then resample these point cloud.
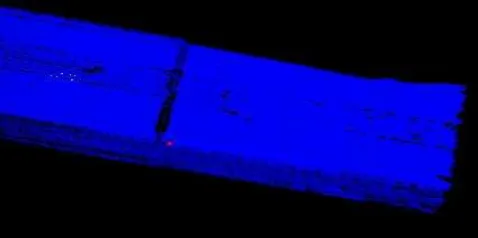
The original point cloud data acquired in one station is illustrated in Figure 2. The point cloud data processed by the clustering and segmentation algorithm is shown in Figure 3 where different colors represent different classes. Figure 4 illustrates the point cloud after resampled.
Figure 2. Original point cloud data
Figure 3. Point cloud data processed by clustering and segmentation
Figure 4. Point cloud data after resampled
3. Experiments and analysis
3.1 Test flow
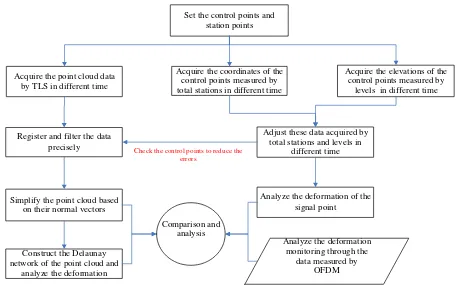
In this test, the deformation of a 100m long subway tunnel which is located in the conjunction part between the Tianjin No.1 subway tunnel and the Tianjin west railway station was monitoring. Because the west railway station is in construction, the excavating and construction in the place above the No.1 subway tunnel led to its deformation. When the deformation exceeds definite extent, it will affect the safety of the subway. Therefore, it is significant to monitor the deformation of this section of the subway. Three different monitoring methods by optic fibre displacement meter (OFDM), the TS and TLS have been adopted into the deformation monitoring of this section of the subway tunnel. The deformation monitoring flow by using TLS is illustrated in Figure 5.
Set the control points and station points
Acquire the coordinates of the control points measured by total stations in different time
Acquire the elevations of the control points measured by
levels in different time
Register and filter the data precisely
Adjust these data acquired by total stations and levels in
different time
Simplify the point cloud based on their normal vectors
Check the control points to reduce the errors
Construct the Delaunay network of the point cloud and
analyze the deformation
Analyze the deformation of the signal point
Analyze the deformation monitoring through the
data measured by OFDM Acquire the point cloud data
by TLS in different time
Comparison and analysis
Figure 5. The deformation monitoring flow
The entire process of the deformation monitoring consisted of three parts: data acquisition, data processing and comparison
the tangent planes extraction of the point cloud data and the construction of the model of the entire tunnel, and the adjustment of the data acquired by TS and levels.
3.2 Data collection and registration combination can correct the coordinate errors of those control points measured by TLS. In the experiment 4 targets at least were placed as control points in each station.
In the process of the data acquisition and processing, owing to influence of the errors of the instruments themselves, the subjective factors of the observers and the atmospheric temperature factor, there are deviations between the observed data and the real data. Only through adopting strict requirement in every step to improve the accuracy can the errors of the observed data be minimized. Especially for those control data measured by TS and levels, generally the same control point need to be measured repeatedly and these repeat observations would be adjusted to calculate the final results.
Date
Table 6. The point cloud data information of the subway tunnel
The data of control points measured by TS and levels were adopted to register the overlapped data acquired from different stations. This method can greatly improve the registration accuracy. Table 7 shows the registration accuracy of each station. If without the control of the data acquired by using TS and levels, the standard deviation of registration is about 4mm, while if adopted them, the error is controlled within 1mm. The registration accuracy is improved significantly. Because it influences the following data processing, for which it is crucial to improve the registration accuracy. Table 7. Registration accuracy between the adjacent stations
3.3 Analysis of the deformation of the subway tunnel
The point cloud data of the subway tunnel acquired in different time period were continued to be simplified after registered and pre-processed. Then the number of point was reduced from 1 million to 200 thousand which meant the number of remaining points was only about 20% of the number of original points. However they still retained the features of original point cloud and improved the speed of the construction of the triangulation. Direct construction of Delaunay triangulation retained the original information of the tunnel and they can reflect the curve surface condition of the tunnel. Hence the analysis result of the deformation would be more accurate.
Through establishing the models of the point cloud data acquired by scanning more than twice respectively, the deformation of the tunnel can be analysed continually. Two datasets of the same place were superimposed together to
compare their difference which can reflect the tendency of the deformation of the tunnel. This reflection is visual but there still lacks an exact standard to measure the deformation. Since the difference of the elevations between two models can reflect the concrete tendency and degree of deformation more exactly, it would provide more enough proof to support the determination.
A model of the tunnel after one scanning is illustrated in Figure 8. An integrated model constructed by superimposing two models which were constructed respectively by two different point cloud datasets of the same tunnel acquired in different time is illustrated in Figure 9, in which the data of blue color represents the model acquired in the first time and the orange data is the second model. From this Figure, it is obviously visual that the elevation in the second model is lower than the first model in the roof, which means there is some deformation in the roof. Then a curve on behalf of the difference between the elevations of the two models is illustrated in Figure 10. It reflects the deformation of about 70m subway tunnel, in which the most serious deformation located in a place of the tunnel between 50 m and 60 m and the difference reached 0.11 m.
Figure 9. Comparison of two models constructed by two datasets acquired in different time
Figure 10. The curve of the difference of the elevations between two models
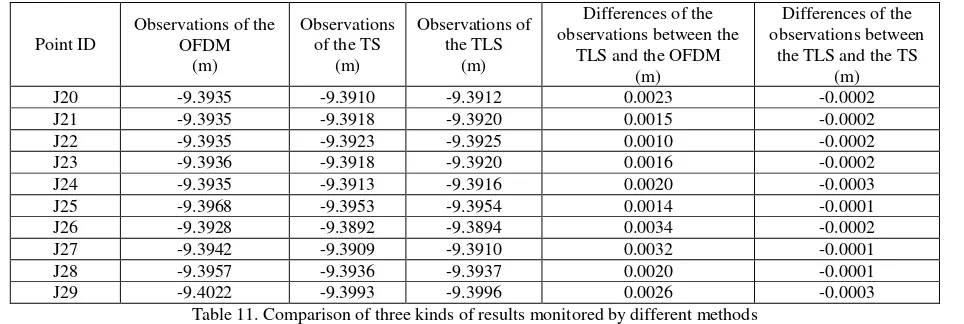
The results monitored by the method proposed in this paper were respectively compared to the results monitored by TS and
OFDM, as the Table 11 illustrates.
Point ID
Observations of the OFDM
(m)
Observations of the TS
(m)
Observations of the TLS
(m)
Differences of the observations between the
TLS and the OFDM (m)
Differences of the observations between
the TLS and the TS (m)
J20 -9.3935 -9.3910 -9.3912 0.0023 -0.0002
J21 -9.3935 -9.3918 -9.3920 0.0015 -0.0002
J22 -9.3935 -9.3923 -9.3925 0.0010 -0.0002
J23 -9.3936 -9.3918 -9.3920 0.0016 -0.0002
J24 -9.3935 -9.3913 -9.3916 0.0020 -0.0003
J25 -9.3968 -9.3953 -9.3954 0.0014 -0.0001
J26 -9.3928 -9.3892 -9.3894 0.0034 -0.0002
J27 -9.3942 -9.3909 -9.3910 0.0032 -0.0001
J28 -9.3957 -9.3936 -9.3937 0.0020 -0.0001
J29 -9.4022 -9.3993 -9.3996 0.0026 -0.0003
Table 11. Comparison of three kinds of results monitored by different methods
The comparison in the table 3 illustrates that there were small differences between the points coordinates measured by TLS and the TS that was because the point cloud data acquired by TLS was corrected by the coordinates of those control points measured by the TS, while the differences between TLS and OFDM were a little big and the maximum error reached 3.4 mm. Although this error did not exceed the constrained error of 5mm, it was too big for deformation. The monitoring result of OFDM is more precise, but due to this measurement needed to put the instrument inside body of the tunnel which cost too much and caused destruction of the tunnel, it is not an optimal
method. If the accuracy of the deformation monitoring by TLS can be improved further, the TLS will be a better choose for deformation monitoring.
4. Conclusion
accuracy and hard to transform the coordinates as well as other problems, then proposed a method of improving the accuracy of registration accuracy and solving the problem of the transformation of the coordinates by combining the TLS, the TS and the level. In addition, the point cloud was simplified via a segmentation algorithm based on their normal vectors meanwhile their features were still reserved. At last a few models of the tunnel constructed by the point cloud data acquired in different time were exploited to monitor its whole deformation. A few experiments based on these theories were carried out to analyze the accuracy and feasibility of the application of monitoring the deformation of the subway tunnel by TLS. In contrast with OFDM, the results show that the accuracy of TLS still needs to be improved to apply to the deformation monitoring of the subway tunnel. This problem in these fields needs to solve based on more researches.
References
XU, J., WANG, H., LUO, Y., WANG, S., YAN, X., 2010. Deformation monitoring and data processing of landslide based on 3D laser scanning [J]. Rock and Soil Mechanics, 31(7), pp. 2188-2191.
CAI, L., WU, K., ZHANG, S., 2010. Application of point cloud plan fitting to deformation monitoring using 3D laser scanner.
Science of Surveying and Mapping, 35(5), pp.231-232
Gordon, S., Lichti, D., Stewart, M., Franke, J., 2004. Modeling point clouds for precise structural deformation measurement. International Archives of Photogrammetry and Remote Sensing 35.
Park, H., Lee, H., Adeli, H., Lee, I., 2007. A new approach for health monitoring of structures: terrestrial laser scanning. Computer‐Aided Civil and Infrastructure Engineering 22, pp.19-30.
Bitelli, G., Dubbini, M., Zanutta, A., 2004. Terrestrial laser scanning and digital photogrammetry techniques to monitor landslide bodies. International Archives of Photogrammetry, Remote Sensing and Spatial Information Sciences, 35(Part B5), pp.246-251.
Lindenbergh, R., Pfeifer, N., Rabbani, T., 2005. Accuracy analysis of the Leica HDS3000 and feasibility of tunnel deformation monitoring. In: Proceedings of the ISPRS Workshop, Laser scanning, Vol. XXXVI(3/W3), Enschede, The Netherlands, pp. 24–29.
Van Gosliga, R., Lindenbergh, R., Pfeifer, N., 2006. Deformation analysis of a bored tunnel by means of terrestrial laser scanning. Proceedings of International Archives of Photogrammetry, Remote Sensing and Spatial Information Sciences, 36( Part 5), pp.25-27.