Adversarial legalism and transaction costs:
The industrial-flight hypothesis revisited
C. Leigh Anderson
a,b,*, Robert A. Kagan
ca
Carleton University, 1125 Colonel By Drive, Ottawa, ON, Canada, K1S 5B6 b
The University of Washington, Daniel J. Evans School of Public Affairs, Box 353055, Seattle, WA 98195, USA
c
University of California Center for the Study of Law and Society, School of Law, Berkeley, CA 94720, USA
Keywords: International; Law and economics
1. Introduction and motivation
Empirical evidence that firms respond to differences in environmental compliance costs among jurisdictions—the industrial-flight hypothesis— has been mixed. In this article, we propose a new explanation for this ambivalence, which also sheds light on an emerging paradox in overseas investment: U.S. capital outflows appear to be sensitive to rising abatement costs, yet the investment recipients increasingly are countries with comparably stringent environmental standards. Our explanation for this paradox is based on the role of regulatory process costs, usually left out of total compliance costs. Most empirical work has looked for capital movement in response to differential abatement costs, predicting that investment would flow from environmentally stringent regimes to those with more lax environmental regulations, for example, from the United States to some developing coun-tries. But little evidence has been found of these pollution havens. If, however, at the margin it is regulatory process costs, liability risks, and uncertainties that constitute the most important compliance cost differentials, then we have been looking for U.S. capital outflows in the wrong places.
What constitutes the total costs of compliance, or their impact, has not been settled in the empirical literature. Jaffe et al. (1995) provide a taxonomy of the costs of environmental regulation, beginning with the regulators’ administrative costs and the firms’ compliance
*Corresponding author. Tel.: 206-543-0365; fax: 206-543-1096.
E-mail address: [email protected] (L. Anderson)
costs. They also list legal and other transaction costs and acknowledge the extra expense generated by the legislative and adversarial approach to regulation in the United States. Because these latter costs are particularly difficult to measure, however, they are often ignored in empirical work. It is this bias, we argue, that leads to incorrect hypotheses about the effect of regulations on a firm’s investment, production, and location decisions. Our goal in this article is simply to raise this issue and to begin to explore the implications and plausibility of these transaction and process costs.
Section 2 provides some background on adversarial legalism and transaction costs, followed in section 3 by a discussion of the limited measures available for these costs. Since data are unavailable for directly testing our hypothesis, in section 4 we present evidence in an effort to refute, or at least to cast doubt on, the competing industrial-flight hypotheses. We find that the share of U.S. direct investment abroad (DIA) in dirty industries, relative to clean industries, is increasing within several countries in the Organization for Economic Cooper-ation and Development (OECD) that have relatively strict environmental regulCooper-ations but cooperative legal and regulatory regimes. Additionally, Europe has been increasing their worldwide share of dirty DIA from the United States. At the same time, European shares of clean DIA are falling, suggesting that the increase in dirty DIA is not simply a response to Europe becoming an increasingly favorable investment location for reasons unrelated to environmental regulations. Though our empirical results are necessarily tentative and our analysis is limited by available data, we conclude in section 5 that the policy debate over harmonizing environmental regulations to discourage industrial flight is, at least, incomplete without considering the regulatory and legal institutions that create, monitor, and enforce those regulations.
2. Adversarial legalism and transaction costs
Empirical explorations of the industrial-flight hypothesis have primarily focused on differences in the direct compliance costs of environmental regulation—that is, the capital and operating costs of installing the control or abatement technologies mandated by the country’s de jure regulations and laws. Total compliance costs to the firm, however, also will depend on indirect compliance costs associated with the implementation, monitoring, and sanctioning of environmental regulations, i.e., regulatory transaction or process costs.1These
costs arise from permit applications, preparing environmental assessments, assessing and proving compliance, and resolving disputes. They include the opportunity costs of regulatory delays and bureaucratic red tape, the diversion of managerial time, litigation, lobbying, insurance, legal, consulting and certification costs, and other costs arising from legal unpredictability. Some research indicates that these legal process costs are very salient to
1
companies, at least in the United States, and may amount to a significant proportion of total compliance costs.2
De facto costs of compliance depend on the probability that noncompliance will be
detected and sanctioned.3 Sanctions include legal penalties, adverse publicity, and
reputa-tional effects.4The higher the de facto costs and adverse publicity sanctions in a national
regime, especially when they are also accompanied by legal uncertainty concerning what constitutes adequate compliance, the more we would expect companies to incur process costs related to documenting and proving compliance and to defensive legal services. Both of these conditions, according to interview-based studies of multinational corporations, are charac-teristic of the United States.5
The dirtier the industry, the more costly we expect the direct and indirect process costs to be because of permit delays, liability risks, public activism, regulator scrutiny, etc. Although quantitative cross-industry comparisons of regulatory process costs do not exist, this as-sumption seems plausible because pollution from dirty industries tends to be more publicly visible and represents a greater source of political concern. Regulators, accordingly, tend to target the most visible and threatening sources of pollution and to insist on full regulatory compliance. Regulated firms in dirty industries, therefore, often invest more heavily in monitoring and proving compliance. At the same time, pollution abatement and control operations tend to be especially costly in dirty industries and, hence, to engender more intense efforts by industry to negotiate exceptions and modification, or even to evade some regulatory requirements— both of which intensify the risk of conflict with regulators and, hence, increase process costs.
3. Evidence on direct and indirect compliance costs
We are proposing that indirect compliance costs arising from adversarial legalism are higher in the United States than in other OECD countries. We are also proposing that the countries whose share of dirty U.S. DIA is increasing have direct compliance costs that are comparable to the those of the United States and are stricter than many countries not receiving the dirty DIA. We are suggesting, therefore, that at the margin the costs of adversarial legalism and the American regulatory process may help to explain why dirty U.S. DIA is increasing in countries with relatively strict direct-compliance costs but lower process costs.6
2
See Kagan & Axelrad (1997, 2000) and Vogel (1986).
3That de facto compliance differs from de jure regulations is evidenced by a 1990 survey of American
businesses indicating that approximately 75% of respondents had been penalized for noncompliance (Deloitte & Touche/ Stanford University, 1990).
4
The value of reputation is difficult to assess, but we would expect it to increase the relative compliance levels of firms with proportionately large brand-name investments such as high-visibility multinational corporations.
5
See Kagan & Axelrad (1997).
6Other production cost differentials do not appear to offer good reasons for DIA leaving the United States for
3.1. Evidence on the indirect costs of compliance arising from adversarial legalism
Relative to the legal systems of other developed countries, the U.S. system is often said to entail particularly high indirect compliance or process costs, arising from American “adversarial legalism” and style of regulatory enforcement.7 Multiple case studies suggest
that legal costs are higher in the United States because of legal service costs, accountability costs, opportunity costs, and the costs of divisiveness and delegitimation.8 Legal costs are
higher because of the greater complexity and changeability of American law, and because of the size of the legal sanctions for being wrong. Accountability costs for proving compliance, which include the ongoing costs of “. . .reporting, record-keeping, testing, employee-educa-tion, certifications, and so on,”9are also higher in the United States, as are the opportunity
costs from regulatory delays, the permit process, and public participation. Finally, higher costs arise in the United States from a system that fosters an adversarial relationship between a firm and regulator that ultimately impedes the exchange of information and cooperation. Unfortunately, there are no aggregate quantitative data available to support this claim. Some components of these process costs, such as the opportunity costs from bureaucratic delay, the costs of dealing with uncertainty, and the costs of divisive relationships, are difficult to quantify. Others that are more easily measured, such as lawyers’ and technicians’ fees for ensuring regulatory compliance, are not recorded across firms in any standard or transparent manner that allows for comparison.10There is, however, a wealth of anecdotal
information from multinational corporations11as well as comparative studies of regulatory
and legal enforcement styles.12This information is based on detailed company and country
case studies, and extensive interviewing.
These studies suggest that as a result of a more adversarial and legalistic style, process costs tend to be substantially higher in the United States than in other OECD countries, which tend to employ a much less legalistic and punitive regulatory style and in which the threat of costly litigation is far lower.13The costs of legal uncertainty are higher in the United States
because of 1) the greater fragmentation of political authority over regulation in the United
as a percentage of gross national product, as obtained from the World Bank) suggest that taxes are relatively low in the United States. Likewise, annual measures of unit labor costs from the United Nations International Labor Organization consistently suggest that labor costs, including nonwage payments, are relatively low in the United States. There is also no reason to believe that capital, material, or technology costs are higher in the United States than in other OECD countries, though easily comparable international data are unavailable. Even if other production cost differentials existed that favored the OECD countries, it is not clear why they would favor dirty DIA, whose shares are increasing, but not clean DIA, whose shares are declining.
7
See Kagan (1991).
8See Kagan & Axelrad (1999). 9
See Kagan & Axelrad (1999) at 28.
10Perhaps surprisingly, many companies do not perform bookkeeping in a standardized manner that allows
comparable measures, such as lawyer’s fees paid toward ensuring compliance, to be extracted from their accounts.
11
See Kagan & Axelrad (1997, 2000).
12See Kagan (1991) and the table of studies cited in Kagan & Axelrad (1997). 13
States and 2) the distinctive character of the American judiciary. In the United States, state and federal governments have independent and overlapping lawmaking powers in many spheres of environmental regulation. Because of the prevalence of divided government, American rule-making agencies are more subject to conflicting and shifting political pres-sures and to ad hoc statutory commands than are agencies in parliamentary systems. Because American legislatures are more open to a variety of interest group pressures, regulatory legislation and rules in the United States are more detailed and complex than in other economically advanced democracies.14In the United States, both federal and state courts are
more aggressive than most foreign judiciaries in hearing challenges to and reinterpreting regulatory law. Adjudication in the United States relies more heavily on the quality and intensity of lawyering than in most other economically advanced democracies, the American judiciary is politically rather than professionally selected, and American judges are more adventuresome.15American adversarial legalism also adds to direct or “substantive”
com-pliance costs because U.S. regulators are reported to be less willing to make case-by-case adjustments to regulatory rules based on environmental and cost factors specific to particular production sites and technologies.16Several company-level case studies show that these legal
process costs—particularly those arising from permitting processes and accountability re-quirements—are often very significant.17
Our rankings of regulatory process costs for other countries are based on comparative studies that indicate that Japan has particularly low regulatory process costs For example, in a recent study of waste regulation and water pollution control, researchers found that the multinational manufacturer’s U.S. subsidiaries felt compelled to focus more on legal exper-tise in their regulatory affairs departments than their Japanese counterparts, who could concentrate on technical expertise.18For a plastic products multinational facing comparable
standards and installing similar control systems in the United States and Japan, the American subsidiaries faced an extra layer of monitoring and labor costs to comply with more detailed emissions records and lengthier reports.19Denmark and the Netherlands are considered to
have considerably less legalistic governmental cultures than Germany and the United States20 In a recent case study on cleaning up toxic waste sites, the result of the U.S.
Comprehensive Environmental Response, Compensation and Liability Act (CERCLA) (“Su-perfund”) statute was “constant and costly legal conflict,” leading to more acrimony and less
Economic Cooperation and Development (1985), found that environmental regulation had a disproportionate impact on U.S. productivity compared to some of its main trading partners.
14
Kagan (2000).
15See Jacob et al. (1996), Kagan (1991), Atiyah & Summers (1987), and Langbein (1985). 16
See Braithwaite (1985), Bardach & Kagan (1982), Kelman (1981), and Vogel (1986). Harrison (1995) suggests that this may lead to higher compliance in the United States relative to Canada, though we do not know at what cost.
17See Kagan & Axelrad (2000). 18
See Kagan & Axelrad (2000) at 30, and see chapters 2 and 3.
19See Kagan & Axelrad (2000) at 29. 20
cooperation than clean-up efforts in Denmark and the Netherlands.21In general, Germany is
considered to have similar direct compliance costs to the United States, but lower regulatory costs. For example, installing similar pollution-control equipment at Ford Motor Co. plants took 5–17 months in Germany for approval, compared to over 4 years in the United States.22
Studies of legal culture in Canada generally place it between the United States and United Kingdom in terms of legalism.23Based on these and other country studies, we would rank
in order of highest process costs: the United States, Canada and Germany, the Netherlands, Sweden, Belgium and the United Kingdom, and Japan.24
For developing countries, where less evidence on costs arising from the regulatory style has been documented, we assume that the most troublesome regulatory process costs are those that arise in systems whose bureaucracy and legal institutions are pervaded by bureaucratic delay, corruption, and legal unpredictability.25 Political or legal instability,
uncertainty, and corruption increase transaction costs by increasing the amount that individ-uals and organizations must spend (relative to state efforts) delineating their legal obligations and enforcing their rights. Costs will vary according to a company’s political connections and ability to negotiate the system.
3.2. Evidence on the direct costs of environmental regulatory compliance
Limited time-series data exist on U.S. pollution-abatement operating costs, which are often used to proxy the stringency of environmental regulations, and comparable abatement cost data are unavailable for most other countries.
Tobey (1990) used a United Nations Conference on Trade and Development (UNCTAD) survey to rank 23 countries on a scale of 1 (most tolerant) to 7 (most strict) for environmental stringency. For Europe and the countries in our sample, the United Kingdom is ranked at 4, Denmark, Germany, and the Netherlands at 5, Finland and Norway at 6, and Sweden, the United States, and Japan, the most stringent, at 7.26 Unfortunately, Tobey’s rankings are quite dated.
If pollution reduction over time, adjusting for industrial activity, is a reasonable proxy for the stringency of environmental protection, then a recent study comparing 17 OECD nations from 1970 or 1975–1990 suggests that the United States is toward the middle or bottom on how stringently environmental substances are regulated.27 Despite the prescriptive and
21
See Kagan & Axelrad (2000) at 1–10.
22Kagan & Axelrad (2000) at 34 –35. 23
See Blankenburg & Bruinsma (1994) on the Netherlands and Hoberg (1991, 1993) on Canada.
24See also Lundqvist (1980), Kelman (1981), and Niemeijer (1989). 25
Discovering and negotiating the appropriate bribe can be more costly than in an uncorrupt bureaucracy (Mauro, 1995).
26
See Tobey (1990) at 196.
27Scruggs (1998). The measures were the percentage reduction in nitrogen oxide (NOx), sulfur oxide (SOx),
punitive nature of U.S. environmental regulation, the study ranked the United States 13th of 17 countries on an index measuring the rate of progress on reducing harmful substances. Germany was first, followed by the Netherlands, Sweden, Japan, and the United Kingdom, which was ranked as number 11. Even if compliance standards are slightly higher in the United States than elsewhere (which the evidence does not support), this seems to suggest that multinational corporations are not engineering plants in Europe to lower environmental standards.28
Our conclusions do not require that these OECD countries have compliance costs as high as the United States. We do require, however, that compliance regulations be relatively more costly in these OECD countries than in the developing country regions. This would imply that dirty DIA is leaving the United States for industrialized regimes where the advantages of their lower indirect compliance costs outweigh the costs of their higher direct compliance costs, relative to developing country destinations. Our results are more provocative, however, by asserting that the U.S. DIA destinations have the same, or higher, direct compliance costs. We could then argue it was adversarial legalism and process costs alone that were driving investment flows. While we believe the qualitative evidence suggests that the recipient countries have higher, or at least comparable, standards to the United States, without better data we must limit ourselves to suggesting that investment leaving the United States is moving to locations with relatively higher direct compliance costs, but lower process costs, over destinations with more lax regimes but higher process costs.
4. Evidence on the role of adversarial legalism
Because data limit our ability to directly test our hypothesis that process costs affect investment decisions, one approach is to indirectly lend support by refuting, or at least casting doubt on, the competing hypotheses.29 We begin by considering four possible
hypotheses concerning the response of firms to differences in environmental regulatory costs.
HYPOTHESIS 1: There is a significant response to jurisdictional differences in direct
abatement costs but not in response to indirect process costs.
This proposition reflects the most common test of the industrial-flight hypothesis where an increase in investment is predicted for dirty industries, relative to clean industries, in developing countries assumed to have less stringent environmental standards.
Evidence of these developing country pollution havens is sparse. Standard explanations
28
It seems unlikely that firms would choose to locate or invest where direct compliance costs are highest, just to provide themselves with the incentive to engineer to the highest standards. If the goal was to be able to eventually sell new control technologies, these could be engineered at any location without incurring the additional costs that arise from moving investment around.
29
for the insignificant responses include arguments that the costs of compliance are relatively small compared to labor, transportation, and other cost considerations and that compliance costs are often nonbinding because the regulations are not enforced. There is also speculation that firms install similar technologies and standards across all facilities to operate at the (more stringent) levels of their home country requirements regardless of local restrictions. The reasons include concern about reputation effects and legal repercussions over lower standards in overseas facilities, cost effectiveness having common operating and production processes, and expectations that direct compliance costs in most regimes will be rising over time but that regulatory and legal regime cost differences will be more enduring.30Even if
any of the above hold only for a small set of firms, results may be obscured at the aggregate level.
Data are limited, and cross-country measures of abatement costs are unavailable. Time-series methods focusing on the United States are limited by the difficulty of attributing capital flows to particular domestic policies. Depending on the industry and the policy or regulation, firms may make investment or production decisions in advance of expected legislation, at the same time, or with some delay. Each policy has its own timetable, pathway, and participants for deliberations, implementation, and enforcement. Compliance deadlines are often phased in, and federal levels of regulatory enforcement vary among administra-tions.31 Further, it is impossible to aggregate over regulatory enforcement, which varies
among states. State governments carry the work on air, water, and solid waste controls (with the exception of the Superfund), and they enforce product liability law in their courts. Finally, if companies’ responses to regulatory costs are cumulative, based on their assess-ment and projection of costs associated with a number of regulatory programs, it would be difficult to identify which regulatory event triggered any particular movement of capital abroad.
The technology-forcing explanation challenges the underlying theory that more stringent environmental regulations lower average productivity, arguing instead that the costs of regulation may be offset by productivity and innovation benefits that accrue to firms as a result of their compliance efforts—the so-called “green gold” effect.32In a national survey
of firms, Florida (1996) finds evidence that research and development-intensive firms
30Union Carbide’s 1984 accident in Bhopal, India is claimed to have increased overseas compliance levels by
American chemical manufacturers and prompted their Responsible Care program. See Levinson (1996).
31For example, potentially important laws, such as the U.S. Toxic Substances Control Act and Resource
Conservation and Recovery Act of 1976, predate our time series, though compliance deadlines only gradually set in as regulations were enacted. Although there was considerable governmental enforcement of the 1972 Water Pollution Control Act Amendments in the mid- and late 1970s, federal cases declined sharply under the Reagan administration until criticism from the Democratic Congress led to intensified regulatory enforcement in 1984. Meanwhile, private enforcement suits by environmental groups increased in 1981–1982, accelerated in 1983, and continued at a reasonably high level through the rest of the 1980s. In 1990, Congress amended the Clean Air Act to encourage citizen suits against violators of air pollution regulations, as had been authorized much earlier in water pollution. See Miller (1987) at 12–13, Greve (1989) at 15–29, Wood & Waterman (1991), and Wood (1988).
32See, for example, Porter (1991) and Porter & van der Linde (1995). Robinson (1995) has aptly referred to
pursuing manufacturing and organizational innovations have a greater incentive and capacity for environmental innovations. Landy & Cass (1996), however, question how frequently regulations provoke profit-maximizing businesses to suddenly recognize previously over-looked productivity increasing innovations. They note Robinson’s observation that technol-ogy-forcing regulations divert “economic resources and managerial attention away from productivity-enhancing innovation.”33Similarly, Palmer et al. (1995), in a critique of Porter
& van der Linde (1995), argue that there may be cases of firms discovering otherwise overlooked productivity-enhancing innovations while responding to environmental regula-tions, but that, in general, this increasing stringency increases costs and decreases compet-itiveness.34Palmer et al. (1995) point out that estimates of product and process offsets are
less than 2% of pollution-abatement and control expenditures.35 The results of these and
other studies have cast doubt on the general applicability of the technology-forcing argu-ment.36
HYPOTHESIS2: There is no significant response to jurisdictional differences in either the
direct abatement costs or in the indirect process costs.
In this case, no systemic differences between dirty and clean industries would be pre-dicted; i.e., they would move similarly to different locations according to differences in other country-specific characteristics.37
HYPOTHESIS3: There is no significant response to jurisdictional differences in the direct
abatement costs but there is in response to the indirect process costs.
Under this hypothesis, we would predict an increase in investment in dirty industries, relative to cleaner industries, in jurisdictions with efficient bureaucracies and low-cost, predictable, dispute resolution mechanisms.
HYPOTHESIS 4: There is a significant response to jurisdictional differences in both the
direct abatement costs and in the indirect process costs.
Predicting the direction of investment in this case would depend on the relative size of the direct and indirect cost differentials, because they may work in opposite directions. For example, the environmental standards of many European countries are relatively stringent and costly, but those countries have cooperative, low-cost regulatory processes. The impor-tance of process costs also may arise from who bears them. The legal, delay, and uncertainty
33See Robinson (1995) at 389. 34
An exception may arise if the regulations lead to strategic interaction among the polluting industries and the regulators, but Palmer et al. (1995) stress that this is also a special case.
35
See Palmer et al. (1995) at 127, 128.
36For example, Robinson (1995), Low & Yeats (1992), Barbara & McConnell (1990), Jorgenson & Wilcoxen
(1993), Robison (1988), Gray (1987), and Christainsen & Haveman (1981).
37This holds to the extent that the clean/dirty firm characteristic is a unique split between industries and not,
costs arising from adversarial legalism can directly affect firm managers who are making investment and location decisions. In contrast, simple direct abatement costs can, at least over time, be partially passed on to consumers or shareholders who do not make these investment or location decisions.38
The last two hypotheses contain the basic proposition of our article: regulatory process costs can affect firm investment decisions. Distinguishing between these two hypotheses rests on the evidence that firms respond to differences in environmental abatement costs; i.e., support for the traditional conception of the industrial-flight hypothesis. Establishing this would support hypothesis 4 over hypothesis 3, and it would also allow us to refute hypothesis 2.
If the evidence is for capital flight in response to abatement costs, and investment is moving to high-cost-process regimes, we cannot rule out that process costs are important, just that they do not dominate. This is the evidence from empirical work looking for capital flight primarily to developing countries (hypothesis 1). If the evidence is for capital flight and if investment is moving to high-abatement but low process cost regimes, this supports the proposition that both regulatory substance and process are important, and that for some industries, process costs dominate (hypothesis 4).
With this in mind, we begin by briefly recounting the evidence that investment in dirty industries responds to abatement costs in the United States, thereby casting doubt on hypotheses 2 and 3.39 Distinguishing between the remaining two hypotheses relies on the
destination of the capital. If direct investment in dirty industries relative to clean industries is increasing faster in stringent, but bureaucratically and legally low-cost regimes than in lax, but bureaucratically and legally inefficient regimes, this further supports hypothesis 4 that process costs matter.
4.1. Evidence of industrial flight in response to abatement costs
The empirical work on a firm’s responsiveness to environmental regulations has generally looked at either changes in capital flows or changes in commodity flows.40 Most of the
capital flow studies have looked for evidence of movement to laxer regulatory regimes, usually assumed to be in developing countries.41 In some of the earliest work, Leonard
(1988) found a significant increase in U.S. foreign direct investment in chemicals and mineral processing for capital expenditures in Brazil, Ireland, Mexico, and Spain . Overall, however, he found that the predicted changes in foreign direct investment were small.
38We thank an anonymous referee for this point. The extent to which direct abatement costs are passed on
depends on substitution.
39Parts of this review were originally done by Richard Brooks. For a fuller review, see Anderson et al. (1996),
Levinson (1996), Jaffe et al. (1995), or Olewiler (1994).
40There are also studies that look at changes in productivity, though a productivity decline associated with
environmental regulations does not imply capital outflow.
41Exceptions are the United States-based location studies. See Bartick (1988), McConnell & Schwab (1990),
Olewiler (1994) updated parts of Leonard’s study and similarly found no “... discernable, lasting increase in the share of direct investment going to LDCs.”42
Xing & Kolstad (1995), who also focus on the U.S. chemical industry, have one of the only studies to have found evidence of industrial flight to developing countries. Using reported sulfur emissions as a measure for de facto environmental stringency across coun-tries, they find that lax environmental regulations are a significant determinant of U.S. foreign direct investment.
The largely inconclusive results for the capital flow studies have led many to conclude that U.S. firms do not respond to differences in compliance costs. All that one can conclude, however, is that capital is not flowing to developing countries. If process costs matter (hypothesis 4), we would not necessarily expect to see capital flight to developing countries, because bureaucratic delay and corruption are often more costly there than in the United States.
Whether or not investment is leaving the United States remains the important question, the destination depends on the magnitude of the direct and indirect compliance cost differentials. A more accurate measure of capital responsiveness to abatement costs, therefore, may be in trade flow studies of dirty industry products. If regulations increase production costs without increasing productivity, one would expect the competitiveness of highly regulated domestic industries to decline relative to their competitors in nations with less regulation and, all else being equal, have declining net exports.
Kalt (1981) attempted to test this hypothesis by analyzing changes in net exports over a decade beginning in 1967 for 78 U.S. industries. He found that higher environmental regulatory compliance costs were associated with lower net exports for the manufacturing industries in his sample, though not for all manufacturing. Still, Kalt’s findings provided some empirical support for the industrial-flight hypothesis. Robison (1988) reached the same implication using United States-world and United States-Canadian trade patterns from 1973–1982. Looking at 78 industry categories, he identified changes in United States-world trading patterns as U.S. environmental regulation became more stringent relative to the rest of the world. He did not find such changes in United States-Canadian trade patterns, where national environmental regulatory policies are well aligned.
Low & Yeats (1992) looked at the distribution of U.S. industries that had high pollution-abatement costs from 1965–1988. They found that over the years the proportion of these dirty industries fell in developed countries (particularly in North America) and rose in developing countries (particularly in Southeast Asia), suggesting that developing countries were quickly gaining a comparative advantage in these industries. Some qualifications and alternative explanations for these results are discussed by the authors.43There is, nonetheless,
a clear implication that strict environmental standards adversely affect competitiveness in certain high-pollution industries.
Anderson et al. (1996) looked at changes in the revealed comparative advantage (RCA)
42See Olewiler (1994) at 72. 43
of countries from 1965–1991 for over 100 SITC commodity groups.44There was evidence
of a shift in RCA, and hence in the production of pollution-intensive industries to developing countries, after 1985. Our results also suggested an overall decline in the production of the dirtiest industries and/or a movement to economies, such as in Eastern European countries, not included in our sample.
Other empirical studies that similarly point toward changing trade patterns as a result of increased environmental regulation, though with small trade effects, include the following: the Congressional Budget Office (1985), D’Arge (1974), U.S. Environmental Protection Agency (1992), and Organization for Economic Cooperation and Development (1985).
There are some exceptions in the evidence for net investment outflows as proxied by trade activity including Grossman & Krueger (1993), who looked at United States-Mexico trade in the manufacturing sector for 1987, and Tobey (1990), who used a subjective scale to represent the stringency of environmental policies. On balance, however, we believe that there is enough evidence emerging to support the contention that on the margin, firms respond to differences in the direct costs of environmental regulations.
4.2. The destination of DIA: evidence in response to process costs
We are suggesting that one explanation for the weak empirical evidence of pollution havens is the misplaced focus on developing countries as investment recipients, which results from considering only direct abatement costs, rather than including indirect process costs as part of total compliance costs. If regulatory process costs and the U.S. system of adversarial legalism are relatively more costly for dirty industries than the abatement cost differentials, then investment would move to regimes with low process costs, all else being equal. These same regimes often have high abatement costs.
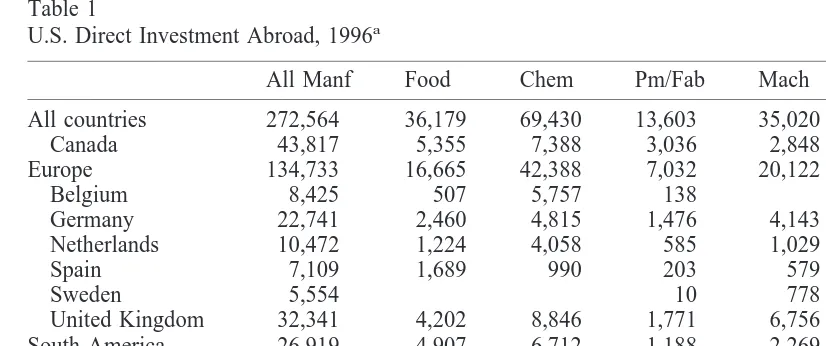
We start with a snapshot of DIA to see whether, in fact, environmentally stringent regimes have been receiving dirty industry investment.45Table 1 shows the most recent U.S. DIA in
millions of dollars for the following six available two-digit standard industrial classification (SIC) manufacturing categories: food and kindred products; chemicals and allied products; primary metal industries; machinery except electrical; electric and electronic equipment; and transportation equipment.46 Chemicals and primary metals are the two dirtiest industries
across all media (air, water, and solid waste) as measured by a ratio of pollution-abatement
44RCA was calculated for developed and developing economies as a commodity’s share of that economy’s
total trade relative to the commodity’s share of world trade.
45“U.S. direct investment position abroad is the value of the U.S. parents’ equity in, and net outstanding loans
to, their foreign affiliates ... viewed as the U.S. parents’ contribution to the total assets of their foreign affiliates or as financing provided by the U.S. parents to their foreign affiliates in the form of debt or equity.” See U.S. Department of Commerce, BEA, U.S. Direct Investment Abroad, (1995) at M3.
46Net capital outflows are “Funds that U.S. parent companies provide to their foreign affiliates (gross outflows)
operating costs to the industry’s total value of output.47Food products are the third dirtiest
in terms of air and water costs. Rankings for the remaining three sectors vary by medium, though they are all cleaner than the first three sectors by this measure.
DIA data are presented for those countries discussed in section 2, on which we have relatively good information about the nature of their legal and regulatory processes. For comparison, Table 1 also gives figures for several regions and Mexico, which is often cited as a recipient of U.S. environmentally driven capital flight. No comparable studies on adversarial legalism are available for countries in these regions or Mexico.
These DIA flows alone tell us nothing more than that U.S. firms find Canada and several countries in Europe to be the most attractive investment locations. There are, however, two ways this data can be examined across dirty and clean industries for evidence related to indirect regulatory and legal costs: each controls for different factors. First, we can look at the ratio of an industry’s DIA in a particular country to total DIA for that country—the industry’s share of that country’s DIA. This adjusts for country characteristics, such as exchange rates and taxes, that would affect all industries (though not identically). Second, we can look at the ratio of an industry’s DIA in a particular country to worldwide DIA for that industry—the country’s share of that industry’s DIA. This controls for changes in product demand and other industry characteristics that would affect all countries. In both cases, all
47This is the most common measure. Pollution-abatement operating costs “include depreciation on, and fuel
and electricity for, the pollution abatement capital assets,” and “salaries and wages, contract work/services, materials, leasing, and miscellaneous costs spent abating pollution” (U.S. Department of Commerce, 1995, at 1). See Jaffe et al. (1995) for a discussion of weaknesses with these measures.
Table 1
U.S. Direct Investment Abroad, 1996a
All Manf Food Chem Pm/Fab Mach Elect Trnsp
All countries 272,564 36,179 69,430 13,603 35,020 29,519 33,543
Canada 43,817 5,355 7,388 3,036 2,848 1,726 11,224
Europe 134,733 16,665 42,388 7,032 20,122 12,089 12,133
Belgium 8,425 507 5,757 138 492
Germany 22,741 2,460 4,815 1,476 4,143 1,492 5,501
Netherlands 10,472 1,224 4,058 585 1,029 839 548
Spain 7,109 1,689 990 203 579 954 1,736
Sweden 5,554 10 778 33
United Kingdom 32,341 4,202 8,846 1,771 6,756 2,705 1,384
South America 26,919 4,907 6,712 1,188 2,269 798 4,171
Central America 12,290 4,295 2,237 572 1,842
Mexico 11,408 3,977 1,920 419 572 454 1,842
Africa 1,822 430 239 320 91 174 120
Asia and the Pacific 49,382 4,394 8,724 1,517 9,095 13,214 4,050
Japan 16,534 620 2,486 327 4,918 2,173 2,710
a
else being equal, we would expect dirtier industries, for whom the regulatory and legal process costs are more important, to have greater shares within countries known for their cooperative regimes, and for those countries to have greater shares of worldwide DIA in these industries. Because many of these regimes also have the most stringent environmental regulations, this expectation contrasts sharply with the simple industrial-flight hypothesis that excludes process costs, which would predict smaller shares of dirty industries in these same countries.
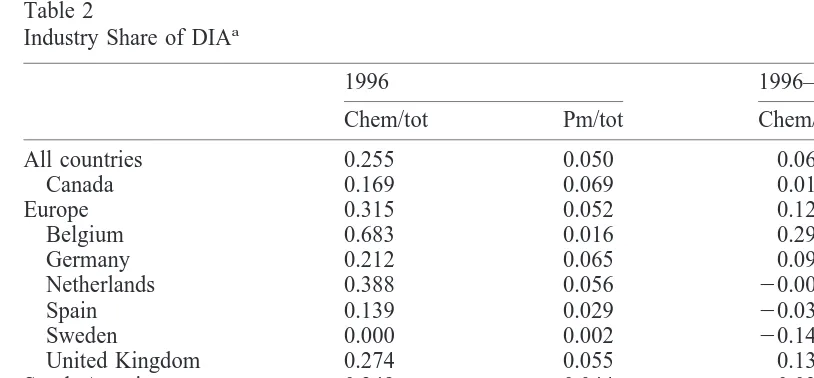
Table 2 gives the industry’s share of each country’s 1996 DIA for the two dirtiest industries: chemicals and allied products; and primary and fabricated metals. The average for all countries is approximately 0.26 for chemicals, and 0.05 for metals. For both industries, this is below the European averages and above the South American, Central American, and Asian and Pacific averages. Though these are regional averages that may be misleading, they are at least consistent with our hypothesis. The relative amount of dirty investment is higher than average in some environmentally stringent regimes such as Belgium, the Netherlands, and the United Kingdom in the chemical industry, and Canada, Germany, the Netherlands, and the United Kingdom in primary metals. These regimes, however, are also noted for their cooperative and consultative regulatory processes relative to the United States This measure does not hold, however, for Japan, ranked with the United Kingdom as having the lowest process costs, and Sweden, ranked next lowest along with Belgium and the Netherlands.
What has happened over time as abatement costs have been rising in the United States? Since 1977, the earliest year for which we have comparable data, the average share of chemical industry DIA within a country has increased by 6.3%. The average increase in Europe is more than twice this amount (0.128), and in South America it is half this amount
Table 2
Industry Share of DIAa
1996 1996–1977
Chem/tot Pm/tot Chem/tot Pm/tot
All countries 0.255 0.050 0.063 20.025
Canada 0.169 0.069 0.017 20.012
Europe 0.315 0.052 0.128 20.013
Belgium 0.683 0.016 0.290 20.030
Germany 0.212 0.065 0.093 0.005
Netherlands 0.388 0.056 20.008 20.049
Spain 0.139 0.029 20.032 20.080
Sweden 0.000 0.002 20.144 20.127
United Kingdom 0.274 0.055 0.133 20.018
South America 0.249 0.044 0.037 20.049
Central America 0.182 0.000 20.097 20.109
Mexico 0.168 0.037 20.102 20.087
Africa 0.131 0.176 20.072 0.013
Asia and the Pacific 0.177 0.031 20.056 20.027
Japan 0.150 0.020 20.086 20.008
a
(0.037). In Central America (20.097) and Asia and the Pacific (20.056), the chemical industry is claiming a declining amount of DIA. Primary metal DIA has declined, on average, across all countries (20.025), but by a smaller amount in Canada (20.012) and Europe (20.013) than in South and Central America (20.049 and20.109, respectively) and Asia and the Pacific (20.027).
In summary, the dirtiest industries have above-average shares of DIA in Europe as a whole, and in several specific countries with relatively stringent environmental regulations, but cooperative regulatory and legal regimes. These shares have been increasing at an above-average rate, or decreasing at a below-average rate, since 1977. Clean industry’s shares, by definition, have been declining at rates above the worldwide average. In contrast, in groups of countries considered to have more lax environmental regimes, but less efficient and predictable legal systems, the share of dirty industry DIA has been falling.
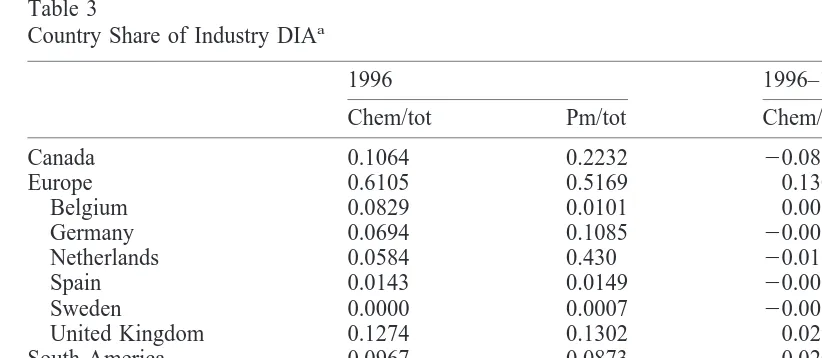
To control for any changes in industry-specific conditions that may be affecting these results, Table 3 shows DIA shares calculated as a proportion of each industry’s worldwide DIA— each country’s share of that industry’s DIA— hence it holds constant variations in industry investment due to changes in worldwide demand or cost conditions particular to the industry.
Again, the simple industrial-flight argument would predict that, regardless of the starting point, shares of dirty DIA to the most environmentally stringent regimes would have decreased since 1977. What is apparent in Table 3, however, is that, in many cases, shares of DIA have, on average, increased to the stringent regimes, and have increased more than shares of the clean industries.
In Europe, the share of worldwide manufacturing DIA has risen 0.3%. This rise, however, is due to increases in the share of worldwide food (0.05), chemical (0.13), and primary and
Table 3
Country Share of Industry DIAa
1996 1996–1977
Chem/tot Pm/tot Chem/tot Pm/tot
Canada 0.1064 0.2232 20.083 20.038
Europe 0.6105 0.5169 0.130 0.089
Belgium 0.0829 0.0101 0.001 20.015
Germany 0.0694 0.1085 20.003 0.015
Netherlands 0.0584 0.430 20.015 20.007
Spain 0.0143 0.0149 20.005 20.017
Sweden 0.0000 0.0007 20.005 20.012
United Kingdom 0.1274 0.1302 0.029 0.000
South America 0.0967 0.0873 20.020 20.044
Central America 0.0322 0.0000 20.034 20.066
Mexico 0.0277 0.0308 20.027 20.033
Africa 0.0034 0.0235 20.014 20.012
Asia and the Pacific 0.1257 0.1115 0.009 0.037
Japan 0.0358 0.0240 20.003 0.012
a
fabricated metal (0.089) DIA. If dirty industry DIA increased just because Europe was an increasingly attractive place to invest, it is difficult to explain why Europe’s share of the three cleanest industries—machinery, electrical machinery, and transportation equipment— has simultaneously fallen.48 For example, Germany’s overall DIA share has fallen, but due
mostly to a decline in clean industry investment. At the same time, the share of worldwide DIA in the two dirtiest industries has fallen in South and Central America, and Asia and the Pacific. These figures broadly support empirical findings that have led to skepticism about the existence of pollution havens. Olewiler (1994), looking at DIA in the chemical industry through 1991, noted that, “Investment grew by only 30 percent in Argentina, but by 277 percent in Japan, which has some of the most stringent environmental regulation (and barriers to trade) in the world. In aggregate dollars, direct investment in the developed countries far exceeded that in less developed countries (LDCs).”49
Combined with earlier studies on trade in dirty products, the industry and country shares of dirty DIA offer limited evidence that DIA responds to the substance of environmental regulations (hypotheses 1 and 4), but that investment in some dirty industries is moving to high-compliance-cost regimes (hypothesis 4). This suggests there is some other factor common, and specific, to these dirty industries. We are proposing that this factor may be the high process cost in the United States brought on by its regulatory style and adversarial legalism.
5. Summary
Our article centered on the proposition that transaction costs and regulatory process matter in investment location decisions and, more specifically, that the regulatory process and adversarial legalism of the United States discouraged investment or production in certain industries. We tried to support our proposition that process costs matter by casting doubt on the competing hypotheses and by data exploiting differences in DIA between the dirty and clean industries. We wanted to show that a disproportionate amount of the dirty investment leaving the United States was headed for stringent but cooperative regimes with relatively low process costs.
We found that dirty industry shares of DIA within several of these regimes was increasing, relative to clean industry DIA. We also found that these regimes have been increasing their worldwide share of dirty U.S. DIA. The major recipient of dirty investment has been Europe, where direct environmental compliance costs are also relatively high. To counter the claim that firms are just interested in securing a toehold within the European Union, we found that within Europe some of the largest recipients of dirty capital have been the countries with the toughest abatement costs, but the most cooperative regimes. Further, we found that although worldwide investment shares to Europe in the three dirty industries were increasing, Euro-pean shares of worldwide investment in the three cleaner industries were decreasing. So,
48Because we are using shares of DIA by industry, the reason cannot lie with changes in product demand. 49
clearly the attractiveness of Europe is industry specific, with the pollution intensity of these industries being one common factor.
The biggest cost difference between the United States and these countries, we propose, arises from the regulatory process and adversarial legalism in the United States. Taxation and other production costs are a less likely factor, because taxes and labor costs are at least as high in Europe as in the United States and skilled labor is available in both. Moreover, these three industries represent three different United Nations-ranked labor skill levels (chemicals are high skill, food is medium skill, and primary metal industries are low skill) and differences in labor and taxation do not explain the patterns between dirty and clean industries that we observe. Although proximity to markets, domestic economic conditions, and a desire to secure a position with the European Union (rather than efforts to reduce regulatory process costs) may have contributed, again, this does not explain the particular unison of capital outflows in the dirtiest industries.
Although the evidence is admittedly limited, we hope that it provides some insights into the potential importance of considering the costs of the legal and regulatory regime as part of total compliance costs. We believe that the evidence is provocative enough to suggest that any policy debate over differences in the stringency of environmental regulations is incom-plete without considering the differential costs arising from the regulatory and legal regimes that create, monitor, enforce, and sanction those regulations.
Acknowledgments
The authors thank Richard Brooks for valuable research assistance and the Pew Charitable Trust and Berkeley Roundtable on the International Economy for helping to fund this research.
References
Anderson, C. L., Kagan, R. A., & Brooks, R. R. (1996). Adversarial legalism, transaction costs, and industrial flight. Working paper for the Trade Environment and Policy Project, University of California, Berkeley. Atiyah, P. S., & Summers, R. (1987). Form and Substance in Anglo-American Law. Oxford, UK: Clarendon
Press.
Barbara, A. J., & McConnell, V. D. (1990). The impact of environmental regulations on industry productivity: direct and indirect effects. J Environ Econ Management 18, 50 – 65.
Bardach, E. & Kagan, R. A. (1982). Going By The Book: The Problem of Regulatory Unreasonableness. Philadelphia, PA: Temple University Press.
Bartick, T. J. (1991). Who Benefits from State and Local Development Policies? Kalamazoo, MI: W.E. Upjohn Institute for Employment Research.
Blankenburg, E. & Bruinsma, F. (1994). Dutch Legal Culture. Boston, MA: Kluwer Publishers.
Braithwaite, J. (1985). To Punish or Persuade: Enforcement of Coal Mine Safety. Albany, NY: SUNY Press. Christainsen, G. B., & Haveman, R. H. (1981). The contribution of environmental regulations to the slowdown
in productivity growth. J Environ Econ Management 8, 381–390.
D’Arge, Ralph. (1974). International trade, domestic income, and environmental controls: some empirical estimates. In A. Kneese (Ed.), Managing the Environment: International Economic Cooperation for Pollution
Control (pp. 289 –315). New York: Praeger.
Deloitte and Touche/Stanford University. (1990). The Environmental Transformation of U.S. Industry. San Francisco, CA: Deloitte and Touche.
Florida, R. (1996). The environment and the new industrial revolution: zero defects, inventory, and emissions. Friedman, Joseph, Gerlowski, D. A., & Silberman, J. (1992). What attracts foreign multinational corporations?
Evidence from branch plant location in the United States. J Regional Sci 32, 403– 418.
Gray, W. B. (1987). The cost of regulation: OSHA, EPA, and the productivity slowdown. Am Econ Rev 77, 998 –1006.
Gray, W. B. (1997). Plant location: do different industries respond differently to environmental regulation? Paper presented at the 1997 American Economics Association meetings, New Orleans, LA.
Greve, M. S. (1992). Private enforcement, private rewards: how environmental suits became an entitlement program. In M. Greve & F. Smith, Jr. (Eds.), Environmental Politics: Public Costs, Private Rewards (pp. 105–128). New York: Praeger.
Grossman, G. M., & Krueger, A. B. (1993). Environmental impacts of a North American free trade agreement. In P. Garber (Ed.), The Mexico-U.S. Free Trade Agreement. Cambridge, MA: MIT Press.
Harrison, K. (1995). Is cooperation the answer? Canadian environmental enforcement in comparative context.
J Policy Anal Management 14, 221–244.
Hoberg, G. (1993). Environmental policy: alternative styles. In M. Atkinson (Ed.), Governing Canada: State
Institutions and Public Policy (pp. 308 –342). Toronto: HBJ-Holt.
Hoberg, G. (1991). Sleeping with an elephant: the American influence on Canadian environmental regulation.
J Public Policy 11, 107–131.
Huppes, G., & Kagan, R. A. (1989). Market oriented regulation of environmental problems in the Netherlands.
Law Policy 11, 215–239.
Jacob, H., Blankenburg, E., Kritzer, H., Provine, D., & Sanders, J. (1996). Courts, Law and Politics in
Comparative Perspective. New Haven, CT: Yale University Press.
Jaffe, A. B., Peterson, S. R., Portney, P. R., & Stavins, R. N. (1995). Environmental regulation and the competitiveness of U.S. manufacturing: what does the evidence tell us? J Econ Lit XXXIII, 132–163. Jorgenson, D.W., & Wilcoxen, P. J. (1993). Energy, the environment, and economic growth. In A. V. Kneese,
& J. L. Sweeney (Eds.), Handbook of Natural Resource and Energy Economics, Amsterdam, Netherlands: North-Holland.
Kagan, R. A. (1991). Adversarial legalism and American government, J Policy Anal Manage 10, 369 – 406. Kagan, R. A. (2000) The consequences of adversarial legalism. In R. A. Kagan & L. Axelrad (Eds.), Regulatory
Encounters: Multinational Corporations and American Adversarial Legalism. Berkeley, CA: University of
California Press.
Kagan, R. A., & Axelrad, L. (1997). Adversarial legalism: an international perspective. In P. S. Nivola (Ed.),
Comparative Disadvantages? Social Regulations and The Global Economy. Washington, D.C.: Brookings
Institution.
Kagan, R. A., & Axelrad, L. (Eds). (2000) Regulatory Encounters: Multinational Corporations and American
Adversarial Legalism. Berkeley, CA: University of California Press.
Kalt, J. P. (1981). The impact of domestic environmental regulatory policies on U.S. international competitive-ness. In M. Spence & H. A. Hazard (Eds.), International Competitiveness (pp. 221–262). Cambridge, MA: MIT Press.
Kelman, S. (1981). Regulating America, Regulating Sweden: A Comparative Study of Occupational Safety and
Health Policy. Cambridge, MA: MIT Press.
Bhagwati & R. E. Hudec (Eds.), Fair Trade and Harmonization—Prerequisites for Free Trade? Cambridge, MA: MIT Press.
Low, P., & Yeats, A. (1992). Do dirty industries migrate? In P. Low (Ed.), International Trade and the
Environment, World Bank Discussion Papers 159. Washington, D.C.: World Bank.
Lundqvist, L. (1980). The Tortoise and the Hare: Clean Air Policies in the United States and Sweden. Ann Arbor, MI: University of Michigan Press.
Mauro, P. (1995). Corruption and growth. Q J Econ CX 681–712.
McConnell, V. D., & Schwab, R. (1990). The impact of environmental regulation on industry location decisions: the motor vehicle industry. Land Econ 66, 67– 81.
Miller, J., & Environmental Law Institute. Citizen suits: private enforcement of federal pollution control laws (Environmental Law Institute, 1987).
Niemeijer, B. (1989). Urban land use planning and building control in the Netherlands: flexible decisions in a rigid system. Law Policy 11 121–152.
Organization for Economic Cooperation and Development. (1985). Environmental Policy and Technical Change. Paris: OECD.
Olewiler, N. (1994). The impact of environmental regulation on investment decision. In J. Benidickson, G. B. Doern, & N. Olewiler (Eds.), Getting the Green Light: Environmental Regulation and Investment in Canada, Policy Study 22. Toronto: C.D. Howe Institute.
Palmer, K., Oates, W. E., & Portney, P. R. (1995). Tightening environmental standards: the benefit-cost or the no-cost paradigm? J Econ Perspectives 9, 119 –132.
Porter, M. E. (1991). America’s green strategy. Sci Am 264, 168.
Porter, M. E., & van der Linde, C. (1995). Toward a new conception of the environment-competitiveness relationship. J Econ Perspectives 9 97–118.
Robinson, J. C. (1995). The impact of environmental and occupational health regulation on productivity growth in U.S. manufacturing. Yale J Regulation 12, 387– 434.
Robison, H. D. (1988). Industrial pollution abatement: the impact on balance of trade. Can J Econ XXI, 187–197. Sanders, J., Jacob, H., Blankenburg, E., Kritzer, H., Provine, D., & Sanders, J. (1996). Courts, Law and Politics
in Comparative Perspective. New Haven, CT: Yale University Press.
Scruggs, L. A. (1998). Sustaining Abundance: Environmental Performance in Advanced Societies. Ph.D. Dis-sertation, Duke University.
Tobey, J. A. (1990). The effect of domestic environmental policies on pattern of world trade: an empirical test.
Kyklos 43, 191–209.
U.S. Department of Commerce, Bureau of Economic Analysis. (1995). U.S. Direct Investment Abroad. Wash-ington, D.C.: U.S. Government Printing Office.
U.S. Department of Commerce, Bureau of the Census. (1995). Manufacturers’ Pollution Abatement Capital
Expenditures and Operating Costs. Washington, D.C.: U.S. Government Printing Office.
U.S. Environmental Protection Agency. (1992). National Air Quality and Emissions Trend Report. Staff report, Office of Air Quality Planning and Standards, EPA-450-R-92-001.
Wheeler, D., & Mody, A. (1992). International investment location decision: the case of U.S. firms. J Int Econ
33, 57–76.
Wood, B. D. (1988). Principals, agents, and responsiveness in clean air enforcement. Am Poli Sci Rev 82, 213–234.
Wood, B. D., & Waterman, R. (1991). The dynamics of political control of the bureaucracy. Am Poli Sci Rev 85, 801– 828.
Xing, Y., & Kolstad, C. D. (1995). Do lax environmental regulations attract foreign investment? University of California, Santa Barbara, Department of Economics Working Paper #6-95.